
This document explains how to use the CUD analysis report on the Google Cloud console to understand the effectiveness and financial impact of your committed use discounts (CUDs).
Overview
You can purchase a commitment to receive committed-use discounts (CUDs). When you purchase a commitment, you commit to a minimum amount of usage or spend on a service or product for a specified term. In return, you receive discounts on your usage. Google Cloud offers two types of CUDs:
- Resource-based CUDs: You get a credit back to offset the on-demand price in exchange for your commitment to purchase a minimum level of Compute Engine resources belonging to a particular machine series and region. You can purchase resource-based commitments only for Compute Engine. Eligible resources include vCPUs, memory, GPUs, and local SSDs. For more information, see the Resource-based CUDs documentation
- Spend-based CUDs: You get a discount in exchange for your commitment to spend a minimum amount for eligible services for a specified time duration. Spend-based CUDs are available for a number of Google Cloud services. For more information, see Spend-based CUDs.
You can use the CUD analysis report to answer questions such as:
- How much money am I saving with my CUDs?
- Am I getting the most out of my current commitments?
- How much of my eligible usage is covered by commitments?
- Can I save more by purchasing more commitments?
- Should I enable discount sharing for resource-based commitments to optimize my costs?
- Am I fully utilizing the CUDs I bought?
- What's my effective discount rate?
Required permissions
To view the CUD analysis report for all projects in your Cloud Billing
account, you must be a Billing Account
Administrator or Billing
Account Viewer.
Specifically, you need the permissions.billing.accounts.get and
billing.accounts.getSpendingInformation permissions on your Cloud Billing
account.
You need different permissions to view the CUD analysis report than you need to view the Cloud Billing report. While Project Owners, Project Editors, and Project Viewers can access Cloud Billing reports for their projects, these roles don't include the permissions required to view the CUD analysis report.
For more information about Cloud Billing permissions, see:
- Overview of access control
- Create custom roles for Cloud Billing
- Understanding predefined IAM roles for Cloud Billing
Access the CUD analysis report
To view the CUD analysis report for your Cloud Billing account:
In the Google Cloud console, go to the CUD analysis page.
At the prompt, choose the Cloud Billing account that you want to view.
Understand the CUD analysis report
You can use the CUD analysis report to view detailed information about your chosen commitment, broken down by the time period and level of detail that you need. The report includes summary cards, a stacked bar chart, and a summary table of the commitment's savings and costs to accompany the bar chart.
The CUD analysis report has two tabs:
CUD Coverage - CUD Coverage - Lets you analyze how much eligible spend is covered by your commitments. It shows usage at on-demand rates. As multi-priced Spend-based CUDs as already discounted, this lets you to see a normalized view of the spend covered.
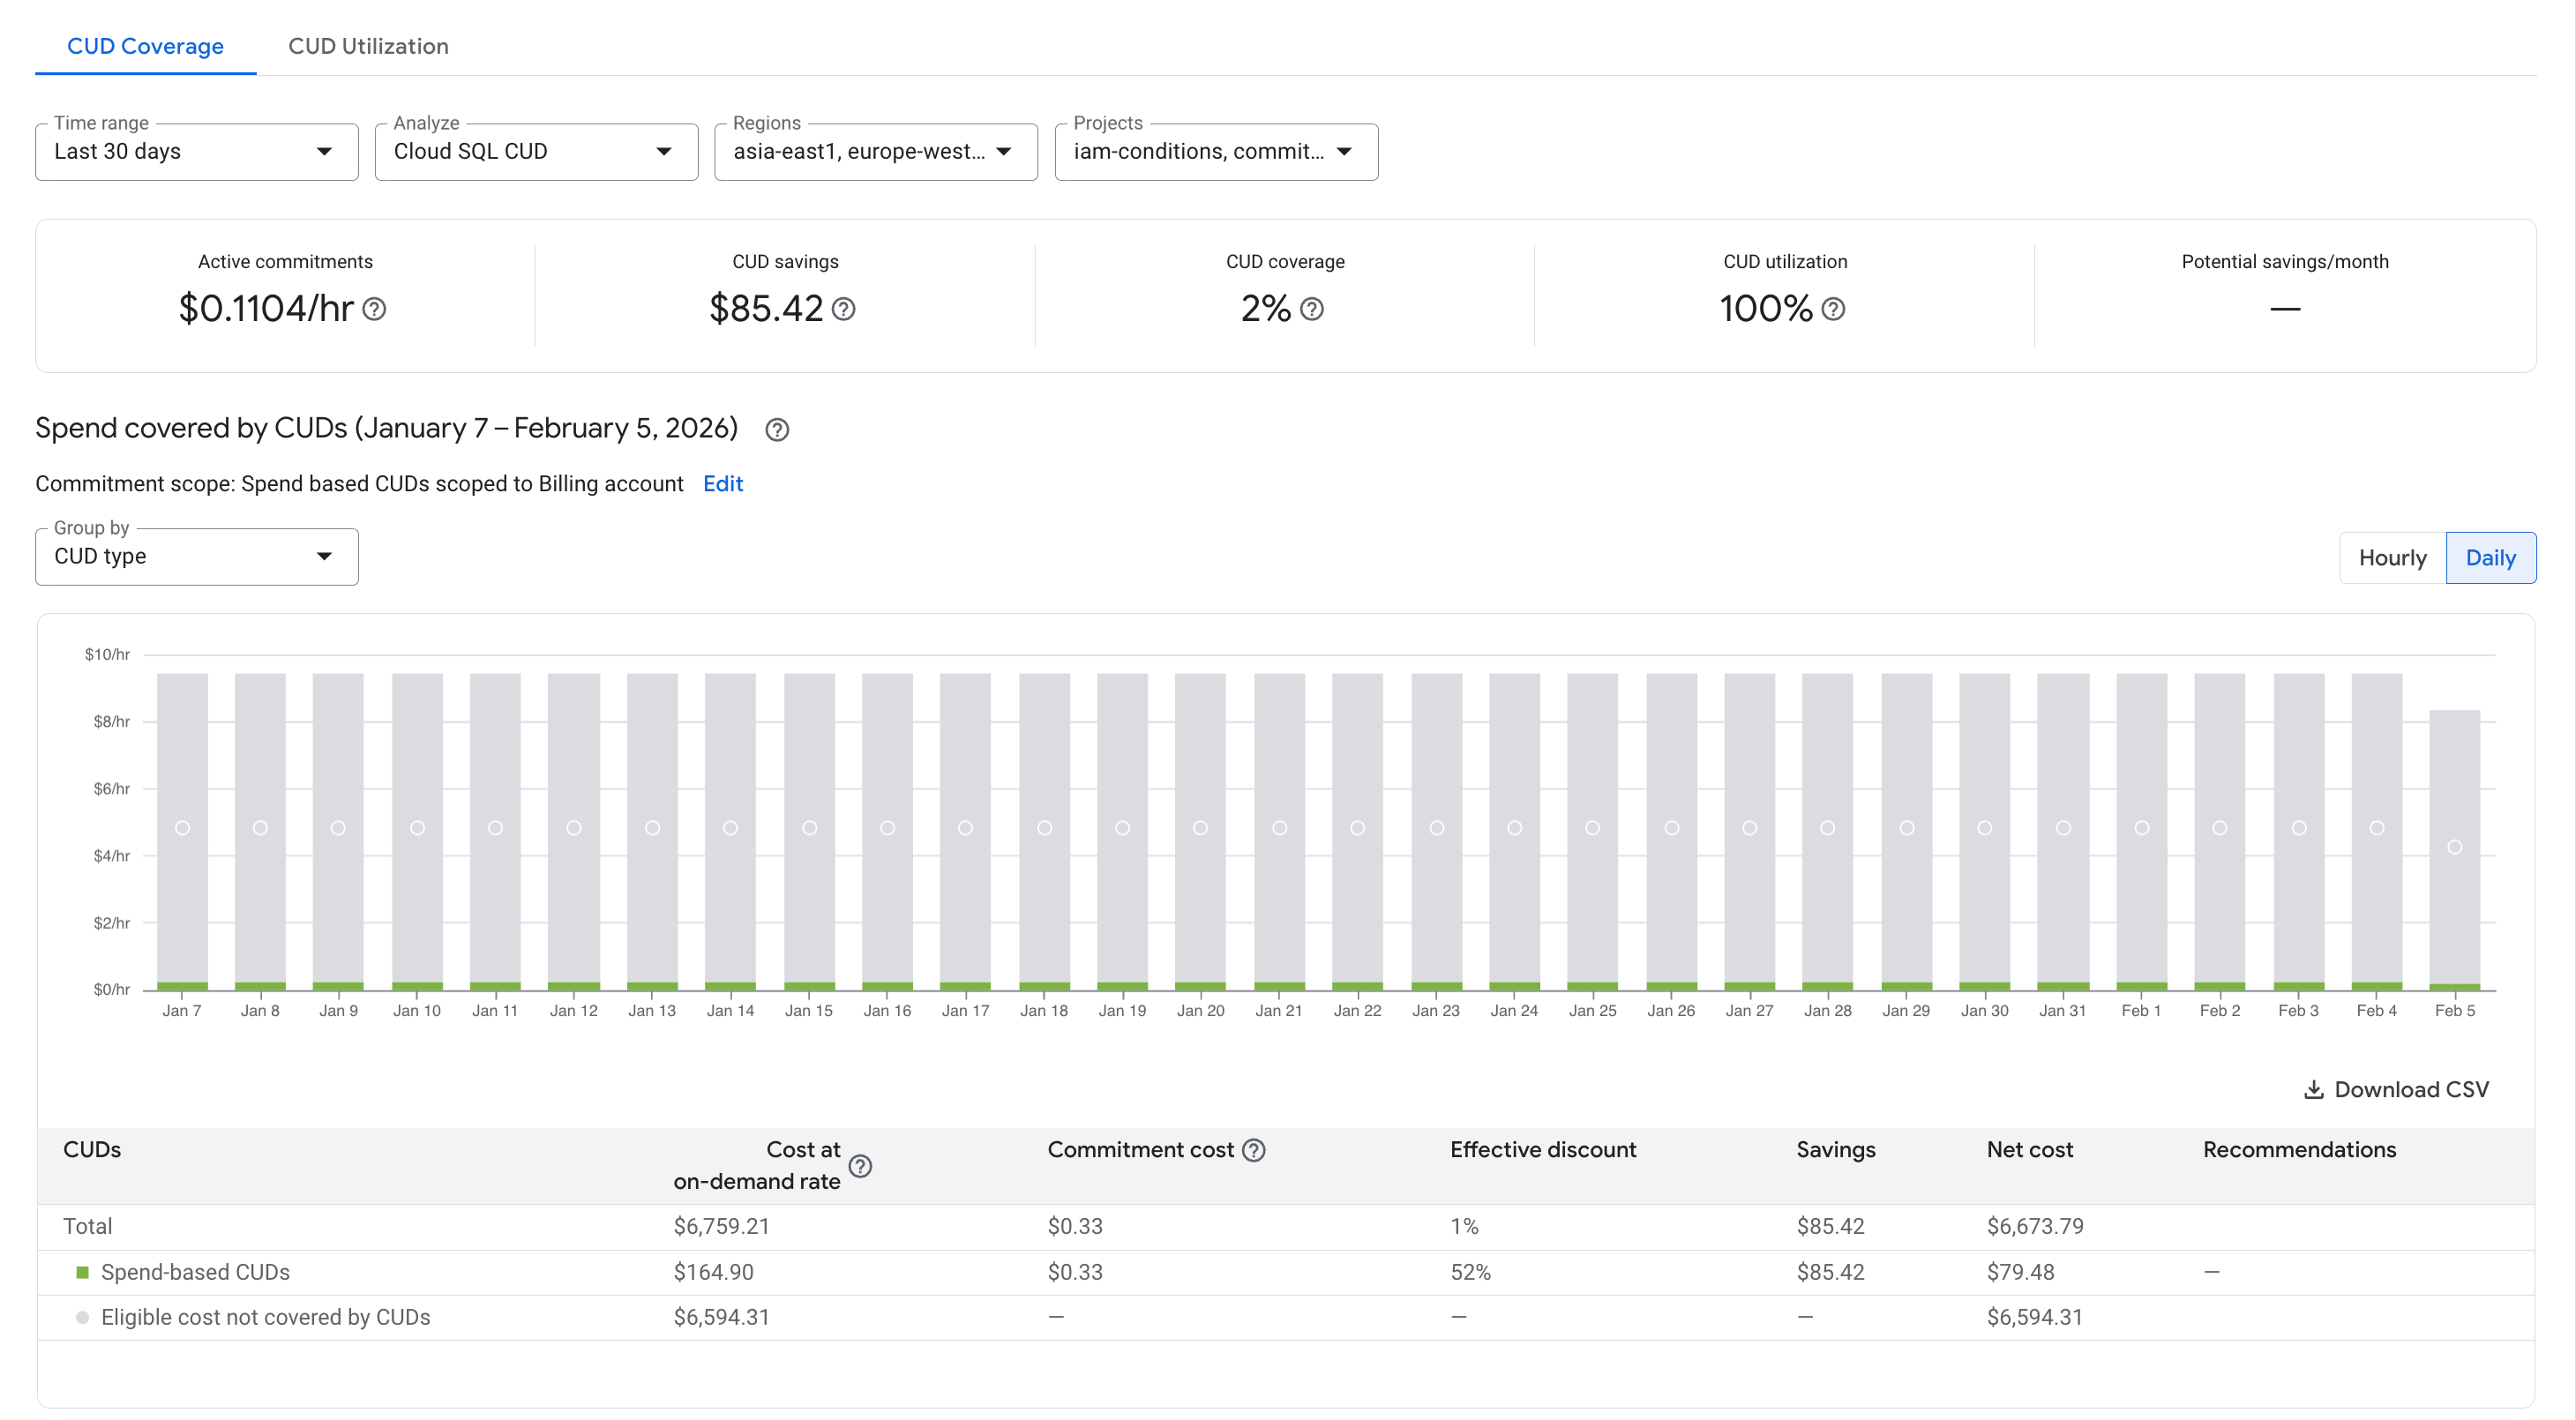
This lets you answer the following questions:
- How much am I covering with CUDs?
- How much am I paying at on-demand rates?
- How much have I saved with CUDs?
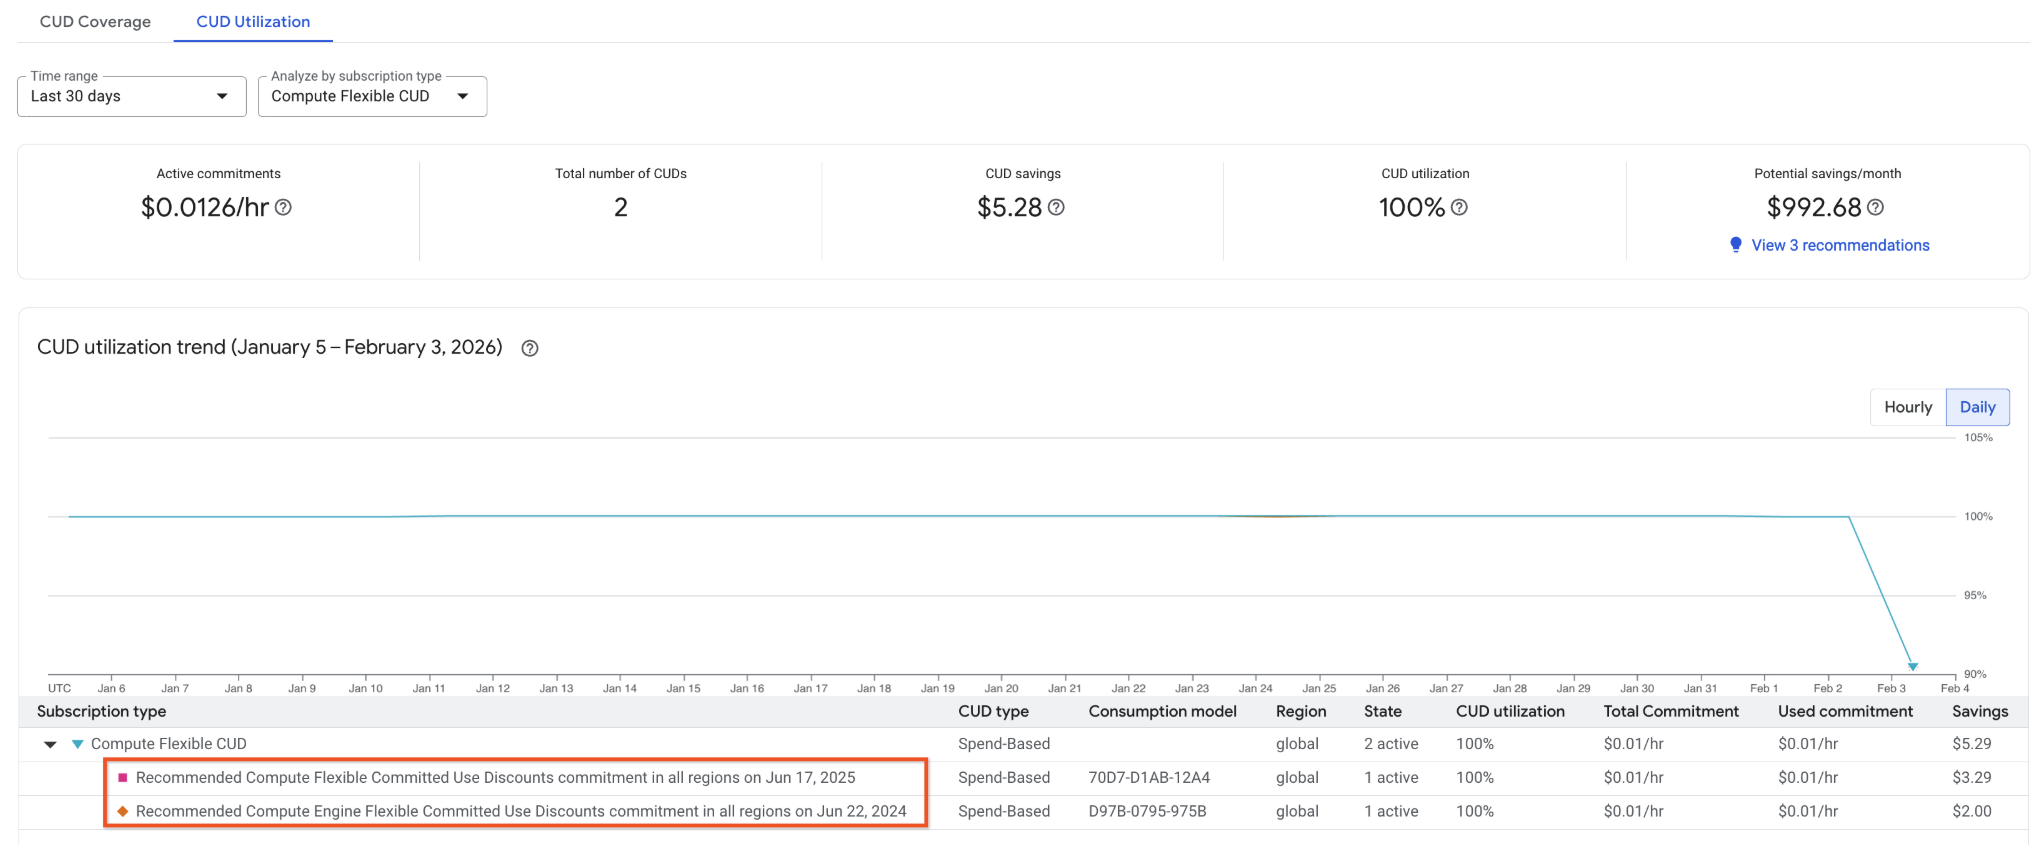
CUD Utilization - Lets you understand the efficiency of your existing commitment usage. This is displayed as a percentage graph over time. It has the capability to show the utilization for the following:
- Each spend-based commitment (each purchase), which is only available for CUDs in the new model, otherwise this granularity is unavailable.
The utilization for each resource-based CUD application scope, for example E2 cores in
us-west1.This lets you answer the following questions:
- Do I fully utilize my commitments?
- What CUDs am I wasting?
All the metrics shown are computed based on the time period you select. However, if you have commitments with different expiration dates, the analysis will show only the data for commitments that were active in the selected time period. Data from the last day might be incomplete due to data arriving late.
The new CUD Analysis lets you see multiple resources in an aggregated fashion. For example, you can analyze all your resource-based CUDs.
Summary cards
Summary cards above the stacked bar chart show the following details for the selected commitment type:
Active commitment: The current quantity of active commitments you purchased for a selected resource. The date range doesn't affect the calculation. The metric always shows the value of active CUDs as of today.
When you select multiple resource-based commitments, the card can't display the active commitment amount because of mismatched measurement units, for example, vCPUs compared to GiBs. In that case, the card displays the number of active commitments. You see something similar when you combine compute flexible CUDs and resource-based CUDs, which have separate units.
CUD savings: The savings from the commitments you purchased for the specified period.
CUD coverage: The percentage of your eligible spend for the specified period that's covered by the commitments you purchased.
Utilization of CUDs: The percentage of the commitments you purchased that were utilized during the specified period. The higher this value is, the more value you're getting from your commitments.
Potential savings: The estimated savings you'll receive if you buy additional commitments for eligible services in your billing account.
Stacked bar chart
The stacked bar chart appears below the summary cards and above the summary table, and shows the following details for the selected commitment type:
- Commitment-covered costs: The average daily costs at on-demand eligible rates covered by CUDs (lower part of the bar, using blue for resource-based CUDs credits and green for spend-based CUDs discounts).
- Eligible cost not covered: The average daily cost of usage charged at the standard, non-discounted, on-demand rate (gray-colored section of the bar).
To view details for an individual day, hold your pointer over the bar for that day.
Summary table
The summary table appears below the stacked bar chart and displays the following aggregate quantities for the selected filters and specified period:
- Cost at on-demand rate: The amount you would have paid without commitments. When you analyze resource-based CUDs for one resource (e.g. E2 Cores), the table will display the equivalent resource utilization averaged per hour, because resource-based CUDs are measured by resources, not cost.
- Commitment cost: The commitment fee for resource based CUDs (and also for spend-based commitments that use the legacy spend-based model). For analyzing new spend-based CUDs, this represents the portion of the CUD you didn't fully utilize and had to pay for. For example in a given hour, suppose that you commit to spending $10/hr, but only spend $8 on eligible discounted resources during a given hour. For that hour, you are charged $2 under this column to ensure you meet the $10/hr spend that you agreed per the commitment.
- Effective discount: The discount rate you obtained. This is calculated by dividing the savings by the cost at on-demand rates.
- Savings: The difference between Cost at on-demand rate and Net cost. Positive values represent your savings. Negative values indicate that you're not saving because you're underutilizing your commitments.
- Net cost - The total amount you paid, including on-demand plus CUD discounted resources plus commitment costs.
Analyze your CUDs
To analyze the effectiveness of your CUDs, complete the following steps.
Filter your report
Use the filters to adjust the scope of usage that's included in your report:
- Time range: The time range of the report. You can select a predefined range, or use a custom range (from one day to multiple years).
- Analyze: The type of commitment that you want to analyze. You can select from any active spend- or resource-based commitments or any areas with eligible usage.
- Resource type: The specific resources that you want to analyze. This is available when you select Analyze.
- Regions: The regions included in the report. You can select all (default), multiple, or a single region. This is only available for region-specific CUDs.
- Projects: The projects included in the report. You can select all (default), multiple, or a single project.
- Resource based and Compute Flexible CUD: Represents all resource-based commitments and compute flexible commitments together. This view takes GCE resources covered by resource-based CUD and layers FlexCUD coverage data onto those specific resources. This lets you see the combined impact of both CUD types on the same resources. However, it doesn't cover Compute Engine resources that are exclusively covered by Flex CUDs, like SSD disks and non-Compute Engine resources that could be covered by a flexible CUD, like Cloud Run or Google Kubernetes Engine.
Adjust groupings and data granularity
Adjust your bar chart settings to view the data that's most important to you. You can edit the following settings:
- Group by: View bar chart data by CUD type, CUD type per region, service, and region. The Group by option is available for resource-based CUDs alone or resource-based CUDs and flexible CUDs.
Data granularity: View commitment usage by daily (default) or hourly granularity. Select hourly granularity to analyze:
- Usage patterns throughout the day.
- When during the day you underutilized your commitment.
- Fluctuations in daily usage.
You can query 30 days for hourly data granularity and 3 years for daily granularity, but requesting large datasets might result in slower performance.
Commitment under-utilization
Your commitment utilization shows you how effectively you're using your CUDs. Several factors can lead to underutilization, such as:
- Your overall usage for the day was below your commitment level.
- Your usage varied throughout the day and was lower than your commitment level for part of the day.
- Your usage and commitments were in different regions.
- Your usage and commitments were in different projects and you hadn't enabled discount sharing for your Cloud Billing account.
Even if you underutilize your commitment, the discounted rate for your commitment-covered usage can result in lower overall costs compared to paying on-demand prices.
Commitment coverage
If your report shows Eligible costs not covered by CUDs, it means that you're not maximizing your potential savings. This happens when your eligible usage exceeds your current commitments.
- If your additional usage comes from stable workloads, consider purchasing additional commitments to cover the extra costs at a discounted rate.
- If your additional usage comes from Compute Engine projects, consider enabling discount sharing to extend your existing resource-based CUDs to those projects. This can help you save costs without buying new commitments.
Download your report
To download a CSV file of your CUD analysis report, click the CSV button in the bottom right corner of the bar chart. The CSV provides the hourly granular data that is used to render the graphs. It provides valuable information such as each of the resource SKUs used, service, consumption model, start and end times of usage, and more. The CSV export is limited to 10,000 rows.
Understand discount sharing for resource-based commitments
Enable CUD sharing for maximum savings
If you have the same resources across multiple projects and in the same regions, you can use discount sharing to maximize your savings by applying the CUDs across multiple projects, which prevents underutilization.
This lets you:
- Reduce management overhead: Manage discounts across your billing account, rather than individually.
- Maximize discount usage: Pool resources to fully use your CUDs.
For more information, see Share resource-based CUDs across projects.
Understand how CUDs impact your bill
Google Cloud uses a balance sheet format for your bill:
We display credits from savings programs, such as Committed Use Discounts (CUDs), in your cost reports to provide a direct and transparent view of your actual savings.
- The Savings programs column shows your actual savings. This is the
final, bottom-line amount you saved compared to what you would have paid at
on-demand prices.
- This column is calculated as follows: Cost at on-demand rates - costs at CUD consumption rate + CUD Fees (if applicable).
- A negative number indicates savings, while a positive number indicates the CUDs aren't generating savings (a loss).
Direct savings calculation
We apply your discounted price directly to any usage covered by a commitment. The Savings Programs column now directly shows you the difference between the on-demand price and what you actually paid. Using the same example: a CUD that costs $5.50/hr to cover $10/hr of on-demand usage.
Example: 100% Utilization
In this example, you fully used the resources covered by your commitment.
- Discounted Cost: Your cost for the resources is directly billed at the discounted CUD rate of $5.50. There are no separate fees or credits on the bill.
- Cost Calculation: Your final cost is just $5.50.
- Savings Programs: It now shows your actual, net savings.
- Calculation: On-Demand Cost - Final Cost
- $10.00 - $5.50 = $4.50
- The column displays -$4.50.
Savings presentation
The following table shows how savings are presented. In this example, your final cost is $5.5/hr and your savings is $4.5/hr.
| Scenario | Savings Programs column |
|---|---|
| 100% utilization | -$4.50 (Net savings) |
View CUD fees and credits in your data exports
If you export your Cloud Billing data to BigQuery, you can use queries to analyze the data.
If you export Cloud Billing data to BigQuery, your queries must account for both CUD models if you use a mix of products.
- New model CUDs: Do not look for usage credits. Use consumption_pricing_type to identify discounted usage and calculate cost using the direct rate. The fee for underutilization will appear as a net cost on the CUD fee SKU.
- Legacy model CUDs: Continue to sum usage cost (at list price) and credits to determine the final cost.
For examples of how you can use BigQuery queries to view your commitment fees and credits in your Cloud Billing data exports, see Committed use discount queries.
Data latency
Your Cloud Billing account receives reports of your VM usage costs multiple times per day, but cost data for commitment charges, CUD credits, and sustained use discount credits can be delayed for up to one-and-a-half days. This reporting difference can make your most recent costs from the current and previous day appear higher than expected until the credits to offset those costs are applied.
As new usage data arrives, Cloud Billing might revise the distribution of your discount multiple times. This can increase the usage line items in your Cloud Billing data export to your BigQuery dataset.
Related topics
- Learn more about CUDs.
- Learn how to calculate savings with Compute Engine flexible commitments.
- Learn how to use your Cloud Billing reports to understand cost trends.
- Learn how to use cost breakdown reports to understand your savings.
- Learn how to use BigQuery queries to view your commitment fees and credits in your Cloud Billing data exports.