
Bigtable에서 지리정보 데이터 작업
이 페이지에서는 GoogleSQL 지리 함수를 사용하여 Bigtable에 지리정보 데이터를 저장하고 쿼리하는 방법을 설명합니다. 지리정보 데이터에는 점, 선, 다각형 형태로 지구 표면의 기하학적 표현이 포함됩니다. 이러한 항목을 컬렉션으로 그룹화하여 위치, 경로 또는 기타 관심 영역을 추적할 수 있습니다.
기본 작업
전용 GoogleSQL지리 함수를 사용하면 Bigtable에서 지리정보 계산 및 쿼리 시간을 위해 데이터베이스 성능을 최적화할 수 있습니다. 기본 사용 예에서는 poi_data라는 column family가 하나 있는 tourist_points_of_interest 테이블을 사용합니다.
| poi_data | |||
|---|---|---|---|
| row key | name | 위치 | |
| p1 | 에펠탑 | POINT(2.2945 48.8584) |
지리 데이터 쓰기
지리정보 데이터를 Bigtable
열에 쓰려면
GeoJSON 또는
잘 알려진 텍스트 (WKT)
형식으로 지리 항목의 문자열 표현을 제공해야 합니다. Bigtable은 기본 데이터를 원시 바이트로 저장하므로 단일 열에 항목을 혼합하여 제공할 수 있습니다 (예: Points,
LineStrings, Polygons, MultiPoints, MultiLineStrings, 또는 MultiPolygons).
제공하는 지리정보 항목의 유형은 쿼리 시에 중요합니다. 데이터를 해석하려면 적절한 지리 함수를 사용해야 하기 때문입니다.
예를 들어 tourist_points_of_interest 테이블에 관광명소를 추가하려면
다음과 같이 cbt CLI 도구를 사용하면 됩니다.
- WKT 사용:
cbt set tourist_points_of_interest p2 poi_data:name='Louvre Museum'
cbt set tourist_points_of_interest p2 poi_data:location='POINT(2.3376 48.8611)'

cbt set tourist_points_of_interest p3 poi_data:name='Place Charles de Gaulle'
cbt set tourist_points_of_interest p3 poi_data:location='POLYGON(2.2941 48.8733, 2.2941 48.8742, 2.2957 48.8742, 2.2958 48.8732, 2.2941 48.8733)'
- GeoJSON 사용:
cbt set tourist_points_of_interest p2 poi_data:name='Louvre Museum'
cbt set tourist_points_of_interest p2 poi_data:location='{"type": "Point", "coordinates": [2.3376, 48.8611]}'

cbt set tourist_points_of_interest p3 poi_data:name='Place Charles de Gaulle'
cbt set tourist_points_of_interest p3 poi_data:location='{"type": "Polygon", "coordinates": [[ [2.2941, 48.8733], [2.2941, 48.8742], [2.2957, 48.8742], [2.2958, 48.8732], [2.2941, 48.8733] ]] }'
지리 데이터 쿼리
Bigtable Studio에서 GoogleSQL로 tourist_points_of_interest 테이블을 쿼리하고 지리 함수로 결과를 필터링할 수 있습니다.
예를 들어 트로카데로에서 1,500m 이내의 모든 관광명소를 찾으려면
다음 함수를 사용하면 됩니다.
ST_DWITHIN
SELECT _key, poi_data['name'], poi_data['location']
FROM points_of_interest
WHERE ST_DWITHIN(CAST(poi_data['location'] AS STRING), ST_GEOGPOINT(2.2874, 48.86322), 1500);
결과는 다음과 비슷합니다.
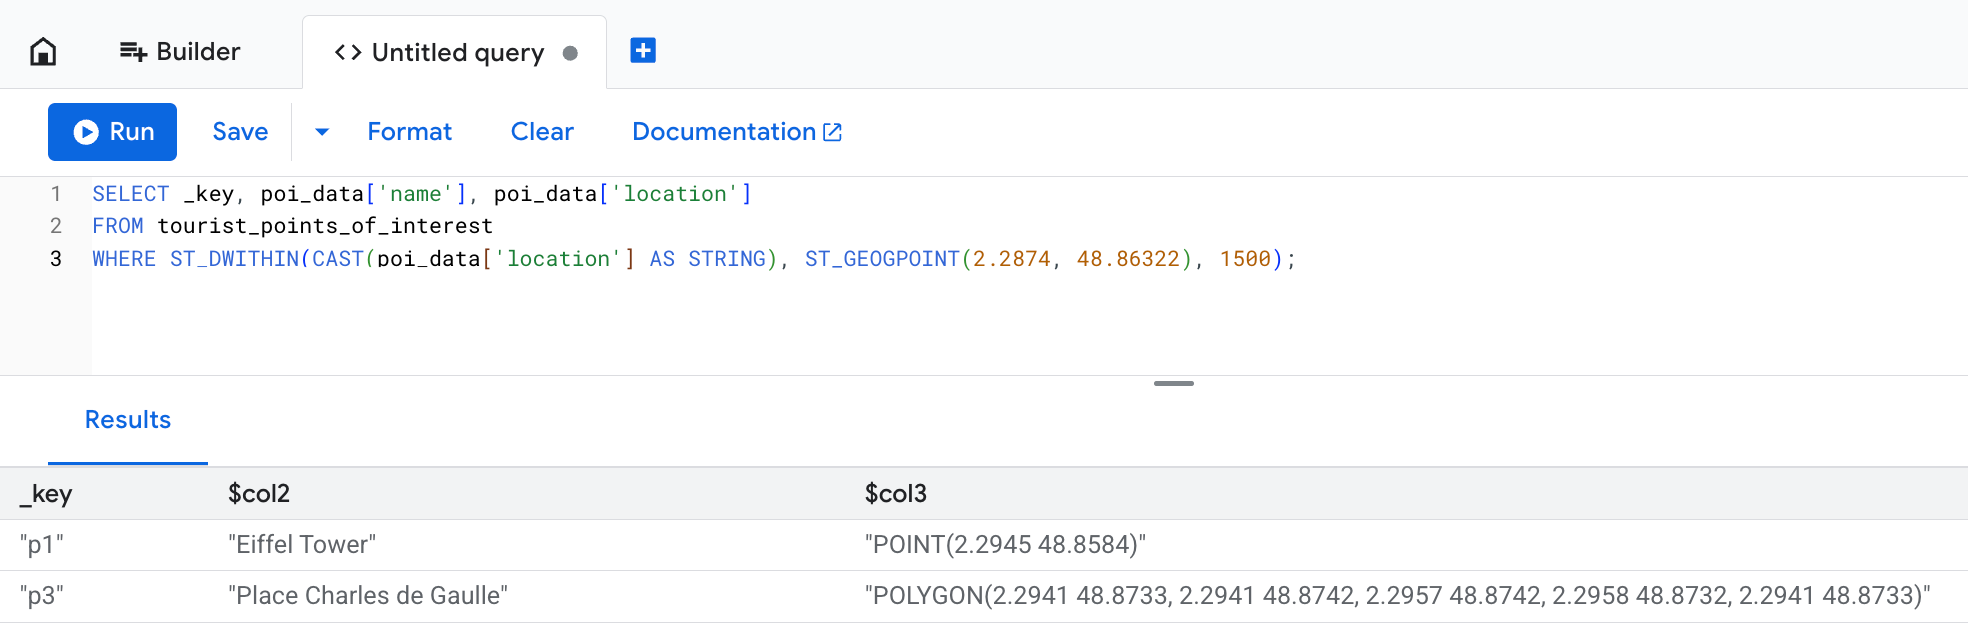
location 열에는 쓰기 작업에서 제공된 데이터의 원래 텍스트 표현이 표시되지만 Bigtable은 이를 바이트로 저장합니다.
이 예에서는 Place Charles de Gaulle 이 1,500m 제한을 초과하는 다각형으로 정의되어 있지만 쿼리 결과에 포함됩니다.
지리정보 항목에 포함된 모든 점이 예상 거리 내에 있으면 ST_DWITHIN 함수가 true를 반환하기 때문입니다.
고급 사용
다음 섹션에서는 지오펜싱 분석과 같은 복잡한 시나리오에 지리 함수를 사용하는 방법을 설명합니다. 쿼리 최적화 섹션에서는 성능 향상을 위해 지속적 구체화된 뷰를 사용하는 방법을 설명합니다.
Bigtable에서 지리 함수의 고급 사용을 설명하기 위해, 스노우힐 섬 남쪽에 서식하는 황제펭귄의 행동을 모니터링하는 연구원의 시나리오를 가정해 보겠습니다. 스노우힐 섬
장비는 각 펭귄에 대해 수백 개의 위치 핑을 제공하므로 이를 저장하기 위해 penguin_movements 테이블을 만듭니다.
| penguin_details | |||
|---|---|---|---|
| row key | penguin_id | 타임스탬프 | 위치 |
| ping#123 | pen_01 | 2025-12-06 08:15:22+00 | POINT(-57.51 -64.42) |
| ping#124 | pen_01 | 2025-12-06 10:22:05+00 | POINT(-57.55 -64.43) |
| ping#125 | pen_01 | 2025-12-07 12:35:45+00 | POINT(-57.58 -64.41) |
| ping#126 | pen_02 | 2025-12-12 06:05:11+00 | POINT(-57.49 -64.39) |
예: 지오펜스를 교차한 사용자 찾기
연구 중에 특정 먹이터 주변의 펭귄 행동을 관찰합니다. 가상 경계로 정의된 영역을 일반적으로 지오펜스 라고 합니다. 먹이터는 지오펜스 영역으로 간주될 수 있습니다.
2025년 12월 3일에 펭귄이 먹이터를 방문했는지 확인하려고 합니다. 이 질문에 답하려면 다음과 같이
ST_CONTAINS
함수를 사용합니다.
SELECT
  penguin_details['penguin_id'],
  penguin_details['location'],
  penguin_details['timestamp']
FROM
  penguin_movements
WHERE
  penguin_details['timestamp'] >= '2025-12-03 00:00:00 UTC'
  AND penguin_details['timestamp'] < '2025-12-04 00:00:00 UTC'
  -- The feeding ground boundary is defined with a WKT POLYGON entity
  -- Polygon's last point must be equal to its first point to close the loop
  AND ST_CONTAINS(
        ST_GEOGFROMTEXT('POLYGON((-57.21 -64.51, -57.23 -64.55, -57.08 -64.56, -57.06 -64.51, -57.21 -64.51))'),
        ST_GEOGFROMTEXT(CAST(penguin_details['location'] AS STRING))
      )
다음과 비슷한 결과가 표시됩니다.
+------------+----------------------+------------------------+
| penguin_id |       location       |       timestamp        |
+------------+----------------------+------------------------+
| pen_01     | POINT(-57.15 -64.53) | 2025-12-03 08:15:22+00 |
| pen_02     | POINT(-57.18 -64.54) | 2025-12-03 14:30:05+00 |
| pen_10     | POINT(-57.10 -64.52) | 2025-12-03 11:45:10+00 |
+------------+----------------------+------------------------+
예: 점을 경로로 변환
펭귄의 이동 방식을 더 잘 시각화하기 위해 다음과 같이
ST_MAKELINE
함수를 사용하여 개별
위치 핑을 LineStrings로 구성하기로 합니다.
SELECT
  penguin_id,
  DATE(timestamp, 'UTC') AS route_date,
  ST_MAKELINE(ARRAY_AGG(location_cast_to_geog)) AS route
FROM (
  -- Sub-expression to sort all location pings by timestamp
  -- This way you make sure individual points can form a realistic route
  SELECT
    penguin_details['penguin_id'] AS penguin_id,
    -- Extract and cast timestamp once
    CAST(CAST(penguin_details['timestamp'] AS STRING) AS TIMESTAMP) AS timestamp,
    -- Extract and cast location once
    ST_GEOGFROMTEXT(CAST(penguin_details['location'] AS STRING)) AS location_cast_to_geog
  FROM
    penguin_movements
  ORDER BY
    -- Pre-sorts location pings for the ARRAY_AGG function
    penguin_id, timestamp ASC
)
GROUP BY
  penguin_id,
  route_date
이 쿼리를 사용하면 연구에 대한 고급 통계를 얻을 수 있습니다. 예시 쿼리 및 결과를 보려면 다음 섹션을 펼칩니다.
각 펭귄의 일일 이동 거리는 얼마인가요?
각 펭귄이 매일 이동하는 거리를 계산하려면
ST_LENGTH 함수를 사용하면 됩니다.
SELECT
  penguin_id,
  route_date,
  ST_LENGTH(route) AS daily_distance_meters
FROM (
  -- Subquery to aggregate points into daily routes
  SELECT
    penguin_id,
    DATE(timestamp, 'UTC') AS route_date,
    ST_MAKELINE(ARRAY_AGG(location_cast_to_geog)) AS route
  FROM (
    -- Sub-expression to sort all location pings by timestamp
    -- This way you make sure individual points can form a realistic route
    SELECT
      penguin_details['penguin_id'] AS penguin_id,
      -- Extract and cast timestamp once
      CAST(CAST(penguin_details['timestamp'] AS STRING) AS TIMESTAMP) AS timestamp,
      -- Extract and cast location once
      ST_GEOGFROMTEXT(CAST(penguin_details['location'] AS STRING)) AS location_cast_to_geog
    FROM
      penguin_movements
    ORDER BY
      -- Pre-sorts location pings for the ARRAY_AGG function
      penguin_id, timestamp ASC
  )
  GROUP BY
    penguin_id,
    route_date
) AS DailyRoutes;
이 쿼리는 다음과 비슷한 결과를 반환합니다.
+------------+------------+-----------------------+
| penguin_id | route_date | daily_distance_meters |
+------------+------------+-----------------------+
| pen_01     | 2025-12-02 | 15420.7               |
| pen_03     | 2025-12-03 | 22105.1               |
| pen_32     | 2025-12-03 | 9850.3                |
+------------+------------+-----------------------+
일일 경로 중 지오펜스 영역 내에서 발생하는 부분은 얼마인가요?
이 질문에 답하려면 ST_INTERSECTION
함수로 결과를 필터링하여 펭귄 경로의 어느 부분이 지오펜스 영역과 교차하는지 확인합니다.
그런 다음 ST_LENGTH 함수를 사용하여 먹이터 내 이동 비율을 해당 날짜에 이동한 전체 거리와 비교하여 계산할 수 있습니다.
SELECT
  penguin_id,
  route_date,
  ST_LENGTH(ST_INTERSECTION(route, ST_GEOGFROMTEXT('POLYGON((-57.21 -64.51, -57.23 -64.55, -57.08 -64.56, -57.06 -64.51, -57.21 -64.51))'))) / ST_LENGTH(route) AS proportion_in_ground
FROM (
  -- Subquery to aggregate points into daily routes
  SELECT
    penguin_id,
    DATE(timestamp, 'UTC') AS route_date,
    ST_MAKELINE(ARRAY_AGG(location_cast_to_geog)) AS route
  FROM (
    -- Sub-expression to sort all location pings by timestamp
    -- This way you make sure individual points can form a realistic route
    SELECT
      penguin_details['penguin_id'] AS penguin_id,
      -- Extract and cast timestamp once
      CAST(CAST(penguin_details['timestamp'] AS STRING) AS TIMESTAMP) AS timestamp,
      -- Extract and cast location once
      ST_GEOGFROMTEXT(CAST(penguin_details['location'] AS STRING)) AS location_cast_to_geog
    FROM
      penguin_movements
    ORDER BY
      -- Pre-sorts location pings for the ARRAY_AGG function
      penguin_id, timestamp ASC
  )
  GROUP BY
    penguin_id,
    route_date
) AS DailyRoutes
WHERE
  ST_INTERSECTS(route, ST_GEOGFROMTEXT('POLYGON((-57.21 -64.51, -57.23 -64.55, -57.08 -64.56, -57.06 -64.51, -57.21 -64.51))'))
이 쿼리는 다음과 비슷한 결과를 반환합니다.
+------------+------------+----------------------+
| penguin_id | route_date | proportion_in_ground |
+------------+------------+----------------------+
| pen_01     | 2025-12-03 | 0.652                |
| pen_03     | 2025-12-03 | 0.918                |
| pen_32     | 2025-12-04 | 0.231                |
+------------+------------+----------------------+
지속적 구체화된 뷰로 쿼리 최적화
대규모 데이터 세트에 대한 지리정보 쿼리는 많은 행을 검사해야 할 수 있으므로 느릴 수 있습니다. Bigtable은 전용 지리정보 색인을 지원하지 않지만 지속적 구체화된 뷰를 사용하여 쿼리 성능을 개선할 수 있습니다.
이러한 뷰의 고유한 row key를 만들려면 GEOGRAPHY
유형을 S2 셀로 변환하면 됩니다.
S2는 구체 기하학에 대한 복잡한 삼각법을 수행할 수 있는 라이브러리입니다.
지리적 좌표를 기반으로 거리를 계산하는 것은 계산 비용이 많이 들 수 있습니다. S2 셀은 지구 표면의 특정 영역을 64비트 정수로 나타낼 수 있으므로 지속적 구체화된 뷰를 사용한 지리정보 색인에 적합합니다.
S2 셀을 정의하려면
S2_CELLIDFROMPOINT(location, level)
함수를 호출하고 세분성 level 인수를 제공합니다. 이 인수는
0에서 30 사이의 숫자이며 각 셀의 크기를 정의합니다. 숫자가 클수록 셀이 작아집니다.
펭귄 연구 예에서는 각 펭귄의 위치와 타임스탬프를 기준으로 색인이 생성된 지속적 구체화된 뷰를 만들 수 있습니다.
-- Query used to create the continuous materialized view
SELECT
  -- Create S2 cells for each penguin's location.
  -- Note that the `level` value is the same for each location so that
  -- every cell is the same size. This ensures consistency for your data.
  S2_CELLIDFROMPOINT(ST_GEOGFROMTEXT(CAST(penguin_details['location'] AS STRING)), level => 16) AS s2_cell_id,
  penguin_details['timestamp'] AS observation_time,
  penguin_details['penguin_id'] AS penguin_id,
  penguin_details['location'] AS location
FROM
  penguin_movements
이 뷰를 쿼리하여
지오펜스를 교차한 사용자는 누구인가요? 라는 질문
에 답하는 것은 2단계 접근 방식으로 훨씬 더 효율적입니다.
먼저 지속적 구체화된 뷰의 cell_id 색인을 사용하여 일반적인 근처에서 후보 행을 빠르게 찾은 다음 축소된 데이터 세트에 정확한 ST_CONTAINS 함수를 적용합니다.
SELECT
  idx.penguin_id,
  idx.location,
  idx.observation_time
FROM
  penguin_s2_time_index AS idx
WHERE
  -- Part one: use an approximate spatial filter and timestamp filter
  -- for fast scans on continuous materialized view keys.
  -- Use the S2_COVERINGCELLIDS function to create an array of S2 cells
  -- that cover the feeding ground polygon. The `level` argument must be the
  -- same value as the one you used to create the continuous materialized view.
  idx.s2_cell_id IN UNNEST(S2_COVERINGCELLIDS(
    ST_GEOGFROMTEXT('POLYGON((-57.21 -64.51, -57.23 -64.55, -57.08 -64.56, -57.06 -64.51, -57.21 -64.51))'),
    min_level => 16,
    max_level => 16,
    max_cells => 500
  ))
  AND idx.observation_time >= '2025-12-03 00:00:00 UTC'
  AND idx.observation_time < '2025-12-04 00:00:00 UTC'
  -- Part two: use ST_CONTAINS() on the returned set to ensure precision.
  -- S2 cells are squares, so they don't equal arbitrary geofence polygons.
  -- You still need to check if a specific point is contained within the area,
  -- but the filter applies to a smaller data set and is much faster.
  AND ST_CONTAINS(ST_GEOGFROMTEXT('POLYGON((-57.21 -64.51, -57.23 -64.55, -57.08 -64.56, -57.06 -64.51, -57.21 -64.51))'), idx.location);
제한사항
Bigtable은 지리 데이터로 작업할 때 다음 기능을 지원하지 않습니다.
- 3차원 도형. 여기에는 WKT 형식의 'Z' 서픽스와 GeoJSON 형식의 고도 좌표가 포함됩니다.
- 선형 참조 시스템. 여기에는 WKT 형식의 'M' 서픽스가 포함됩니다.
- 기본 도형 또는 멀티파트 도형 이외의 WKT 도형 객체. 특히 Bigtable은 Point, MultiPoint, LineString, MultiLineString, Polygon, MultiPolygon, GeometryCollection만 지원합니다.
ST_CLUSTERDBSCAN함수는 지원되지 않습니다.
GeoJson 및 WKT 입력 형식과 관련된 제약조건은
ST_GEOGFROMGEOJSON
및
ST_GEOGFROMTEXT를 참조하세요.
다음 단계
- 사용 가능한 지리 함수에 대해 자세히 알아보세요. GoogleSQL 지리 함수 개요를 참조하세요.