
This document shows you how to set up client-side and end-to-end tracing using OpenTelemetry. Before you can opt in for end-to-end tracing, you must set up client-side tracing. For more information, see Trace collection overview.
Before you begin
-
To ensure that the service account your application uses has the necessary permissions to set up trace collection, ask your administrator to grant the following IAM roles to the service account your application uses on your project:
-
All:
Cloud Telemetry Traces Writer (
roles/telemetry.tracesWriter)
-
All:
Cloud Telemetry Traces Writer (
Verify that the Cloud Trace and Telemetry API are enabled on your project. For more information on enabling APIs, see Enabling APIs.
Configure client-side tracing
To export traces using the OpenTelemetry Protocol (OTLP), configure your application. You can send data to either an OpenTelemetry Collector or directly to Cloud Trace through the Telemetry API. Both methods use the same dependencies and configuration. They differ only in the OTLP endpoint the exporter uses.
Export traces using OpenTelemetry Protocol
To export traces using OpenTelemetry Protocol, configure the OpenTelemetry SDK and OTLP exporter:
Add the necessary dependencies to your application using the following code:
Java
Go
go.opentelemetry.io/otel v1.28.0
go.opentelemetry.io/otel/sdk v1.28.0
go.opentelemetry.io/otel/exporters/otlp/otlptrace/otlptracegrpc v1.28.0
Node.js
"@opentelemetry/exporter-trace-otlp-grpc": "^0.57.0",
"@opentelemetry/sdk-trace-base": "^1.26.0",
"@opentelemetry/sdk-trace-node": "^1.26.0",
Python
pip install opentelemetry-api opentelemetry-sdk
pip install opentelemetry-exporter-otlp
Configure the OpenTelemetry object and enable tracing.
Java
Go
Node.js
Python
Configure end-to-end tracing
This section provides instructions for configuring end-to-end tracing on Spanner client libraries:
Add the necessary dependencies to your application using the following code:
Java
The existing client-side tracing dependencies are sufficient for configuring end-to-end tracing. You don't need any additional dependencies.
Go
In addition to the dependencies you need for client-side tracing, you also need the following dependency:
go.opentelemetry.io/otel/propagation v1.28.0Node.js
The existing client-side tracing dependencies are sufficient for configuring end-to-end tracing. You don't need any additional dependencies.
Python
The existing client-side tracing dependencies are sufficient for configuring end-to-end tracing. You don't need any additional dependencies.
Opt in for end-to-end tracing.
Java
SpannerOptions options = SpannerOptions.newBuilder()
  .setOpenTelemetry(openTelemetry)
  .setEnableEndToEndTracing(/* enableEndtoEndTracing= */ true)
  .build();
Go
Use the
EnableEndToEndTracingoption in the client configuration to opt in.client, _ := spanner.NewClientWithConfig(ctx, "projects/test-project/instances/test-instance/databases/test-db", spanner.ClientConfig{ SessionPoolConfig: spanner.DefaultSessionPoolConfig, EnableEndToEndTracing: true, }, clientOptions...)
Node.js
const spanner = new Spanner({
projectId: projectId,
observabilityOptions: {
tracerProvider: openTelemetryTracerProvider,
enableEndToEndTracing: true,
}
})
Python
observability_options={
"tracer_provider": tracer_provider,
"enable_end_to_end_tracing": True,
}
spanner = spanner.Client(project_id, observability_options=observability_options)
Set the trace context propagation in OpenTelemetry.
Java
OpenTelemetry openTelemetry = OpenTelemetrySdk.builder()
  .setTracerProvider(sdkTracerProvider)
  .setPropagators(ContextPropagators.create(W3CTraceContextPropagator.getInstance()))
  .buildAndRegisterGlobal();
Go
// Register the TraceContext propagator globally.
otel.SetTextMapPropagator(propagation.TraceContext{})
Node.js
const {propagation} = require('@opentelemetry/api');
const {W3CTraceContextPropagator} = require('@opentelemetry/core');
propagation.setGlobalPropagator(new W3CTraceContextPropagator());
Python
from opentelemetry.propagate import set_global_textmap
from opentelemetry.trace.propagation.tracecontext import TraceContextTextMapPropagator
set_global_textmap(TraceContextTextMapPropagator())
End-to-end tracing attributes
End-to-end traces can include the following information:
| Attribute name | Description |
|---|---|
| service.name | The attribute value is always spanner_api_frontend. |
| cloud.region | The Google Cloud cloud region of the Spanner API frontend that serves your application request. |
| gcp.spanner.server.query.fingerprint | The attribute value is the query fingerprint. To debug this query
further, see the TEXT_FINGERPRINT
column in the Query statistics tables. |
| gcp.spanner.server.paxos.participantcount | The number of participants involved in the transaction. For more information, see Life of Spanner Reads & Writes. |
| gcp.spanner.isolation_level | The attribute value is the isolation level of the transaction.
Possible values are SERIALIZABLE and
REPEATABLE_READ. For more
information, see Isolation levels overview. |
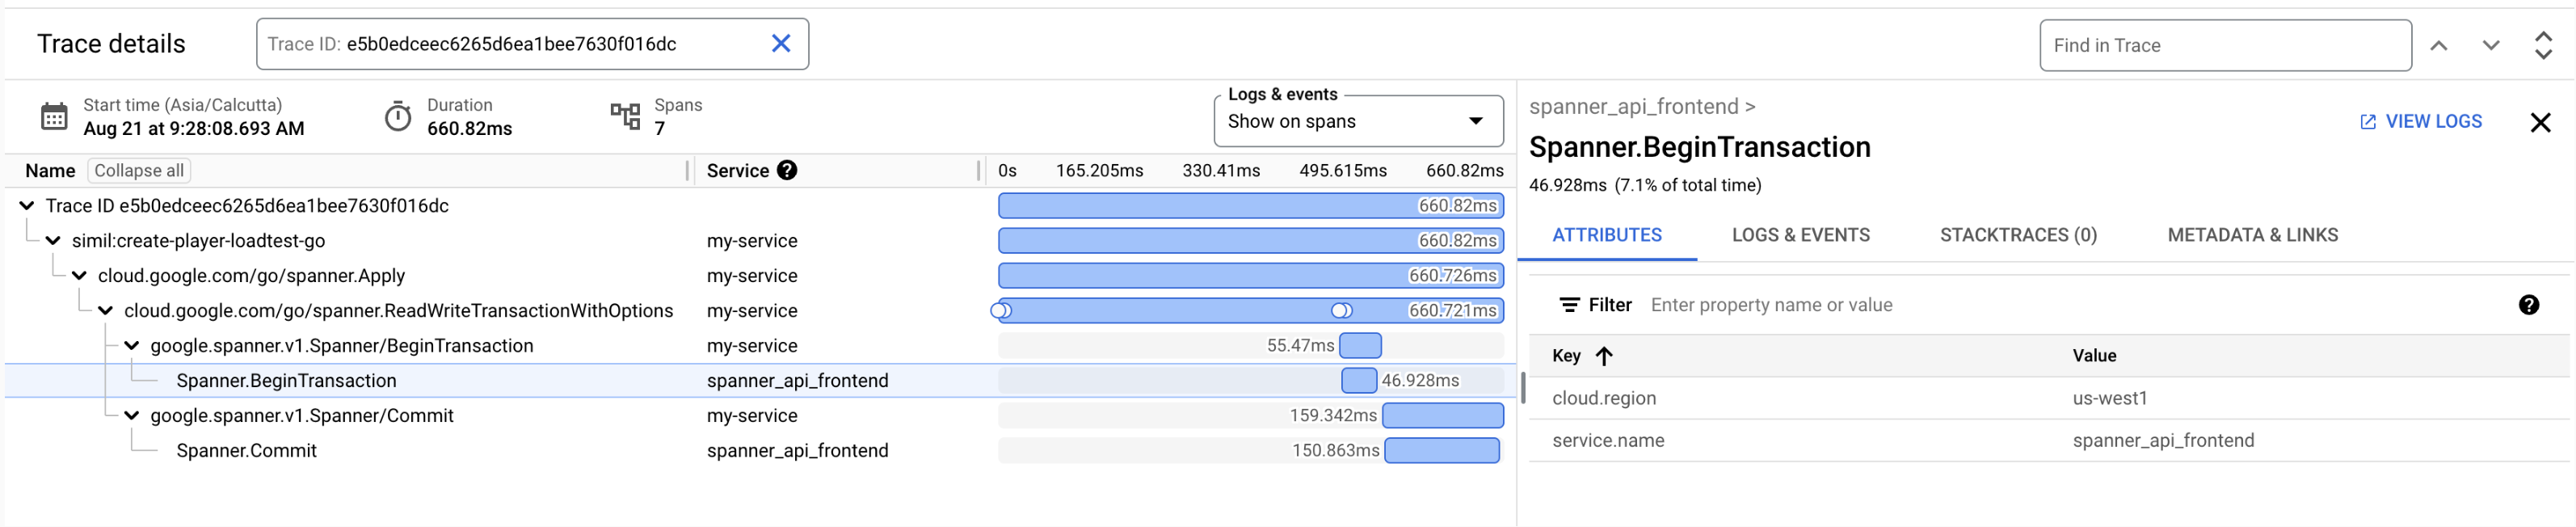
Sample trace
An end-to-end trace lets you view the following details:
- The latency between your application and Spanner. You can calculate network latency to see if you have any network issues.
- The Spanner API frontend cloud region where your application requests are being served from. You can use this to check for cross-region calls between your application and Spanner.
In the following example, your application request is being served by the
Spanner API frontend in the us-west1 region and the network
latency is 8.542ms (55.47ms - 46.928ms).
What's next
- For more information about OpenTelemetry, see OpenTelemetry documentation.