

Service-level objective (SLO) charts on a custom dashboard in Cloud Monitoring let you monitor the health, compliance, and remaining error budget of your services in a single view. Each chart summarizes how a service performs against a configured target so you can track SLO status across a set of services.
Before you can add an SLO chart, you must configure your services and SLOs; for more information, see SLO monitoring. The following screenshot illustrates a chart that displays the remaining error budget for an SLO:
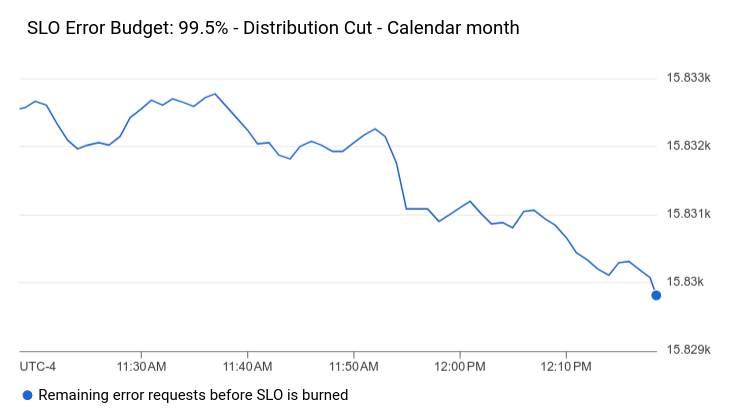
This document describes how to add SLO charts by using the Google Cloud console. To configure them by using the Cloud Monitoring API, see Create and manage dashboards by API and Dashboard with an SLO widget.
Before you begin
Complete the following in the Google Cloud project where you want to create and modify dashboards:
-
To get the permissions that you need to create and modify custom dashboards by using the Google Cloud console, ask your administrator to grant you the Monitoring Editor (
roles/monitoring.editor) IAM role on your project. For more information about granting roles, see Manage access to projects, folders, and organizations.You might also be able to get the required permissions through custom roles or other predefined roles.
For more information about roles, see Control access with Identity and Access Management.
You can put up to 100 widgets on a dashboard.
Display SLOs on a dashboard
To add an SLO chart to a dashboard, do the following:
-
In the Google Cloud console, go to the Dashboards page:
If you use the search bar to find this page, then select the result whose subheading is Monitoring.
- In the toolbar of the Google Cloud console, select your Google Cloud project. For App Hub configurations, select the App Hub host project or management project.
- Select a dashboard or click Create dashboard.
- In the toolbar, click add Add widget.
- In the Add widget dialog, select
 SLO.
SLO. - In the Choose an SLO to show data pane, click arrow_drop_down Service, and then select a service.
Select an existing SLO for the service from the Service-level Objectives menu.
If the chosen service has no SLOs, then a message tells you that you must create one. To add an SLO, click Create SLO. For more information about creating SLOs, see Creating an SLO. After you create an SLO, select it and proceed to the next step.
Select an SLO metric from the Service Level Objective Chart Type menu. You can select health, compliance, and absolute or fractional error budget. For more information about SLO metrics, see Retrieving SLO data.
Optional: Update the chart title.
To apply your changes to the dashboard, in the toolbar, click Apply. To discard your changes, click Cancel.
What's next
You can also add widgets to your custom dashboards that display the following:
For information about exploring charted data and filtering your dashboards, see the following documents: