

Dashboard templates in Cloud Monitoring let you quickly set up custom
dashboards with preconfigured charts for Google Cloud services such as
Compute Engine, Cloud Storage, and BigQuery. You can install
JSON templates from the template library in the Google Cloud console. You can also
install templates from the
GitHub monitoring-dashboard-samples repository by using
the Google Cloud console, the Google Cloud CLI, or the Cloud Monitoring API.
Install a dashboard template
Google Cloud console
To install a dashboard template by using the Google Cloud console, do the following:
-
In the Google Cloud console, go to the Dashboards page:
If you use the search bar to find this page, then select the result whose subheading is Monitoring.
In the toolbar of the Google Cloud console, select your Google Cloud project. For App Hub configurations, select the App Hub host project or management project.
Do one of the following:
To install a template from the library available in the Google Cloud console, do the following:
- Click Dashboard Templates.
- Find the dashboard that you want to install.
- Optional: To preview the dashboard, select it.
- Click playlist_add Add dashboard to your list and then complete the dialog.
The dialog lets you select the name of the dashboard, and add labels to the dashboard.
To install a dashboard by uploading a JSON file, do the following:
- Optional: To install a curated dashboard template, download the GitHub repository:
git clone https://github.com/GoogleCloudPlatform/monitoring-dashboard-samples.git
- Click Create Dashboard.
- In the dashboard toolbar, click settings Settings, select JSON, and then select JSON Editor.
For a new dashboard, the displayed code is similar to the following:
{ "displayName": "New Dashboard", "mosaicLayout": { "columns": 12, "tiles": [] }, "dashboardFilters": [], "labels": {} }- In the editor's toolbar, click upload File Upload.
- Select the file that contains the template and then click Open.
After the file is uploaded, the dashboard's JSON is updated.
If you see the following message, "Unable to save dashboard: Field mosaicLayout.tiles[0] has an invalid value", then select Grid in the dashboard toolbar.
- Optional: Customize the dashboard. For example, you can update the title, add a text widget that indicates the dashboard source, delete unwanted charts, or add charts.
- To save your modified dashboard, in the toolbar, click Save.
gcloud CLI
To install a dashboard definition by using the Google Cloud CLI, do the following:
Ensure the dashboard definition is accessible to your local system.
For dashboards stored in the GitHub repository, you can save specific dashboards, or you can download the entire repository:
git clone https://github.com/GoogleCloudPlatform/monitoring-dashboard-samples.gitIdentify the dashboards you want to install.
For example, in the GitHub repository, the directory
monitoring-dashboard-samples/dashboards/computecontains a file namedgce-vm-instance-monitoring.json.Issue the
gcloud monitoring dashboards createcommand and provide the JSON representation of the dashboard.For example, to install the dashboard
gce-vm-instance-monitoring.json, issue the following command:gcloud monitoring dashboards create --config-from-file=gce-vm-instance-monitoring.json --project=PROJECT_IDBefore you run the previous command, replace the following:
- PROJECT_ID: The identifier of the project. For App Hub configurations, select the App Hub host project or management project.
REST
To install a dashboard definition by using the Cloud Monitoring API, do the following:
Ensure the dashboard definition is accessible to your local system.
For dashboards stored in the GitHub repository, you can save specific dashboards, or you can download the entire repository:
git clone https://github.com/GoogleCloudPlatform/monitoring-dashboard-samples.gitIdentify the dashboards you want to install.
For example, in the GitHub repository, the directory
monitoring-dashboard-samples/dashboards/computecontains a file namedgce-vm-instance-monitoring.json.Call
dashboards.createand provide the JSON representation of the dashboard. In the API call, the parent is the project in which to create the dashboard. For App Hub configurations, select the App Hub host project or management project. This field has the following format:projects/PROJECT_ID
For more information, see Create and manage dashboards.
View the installed dashboard
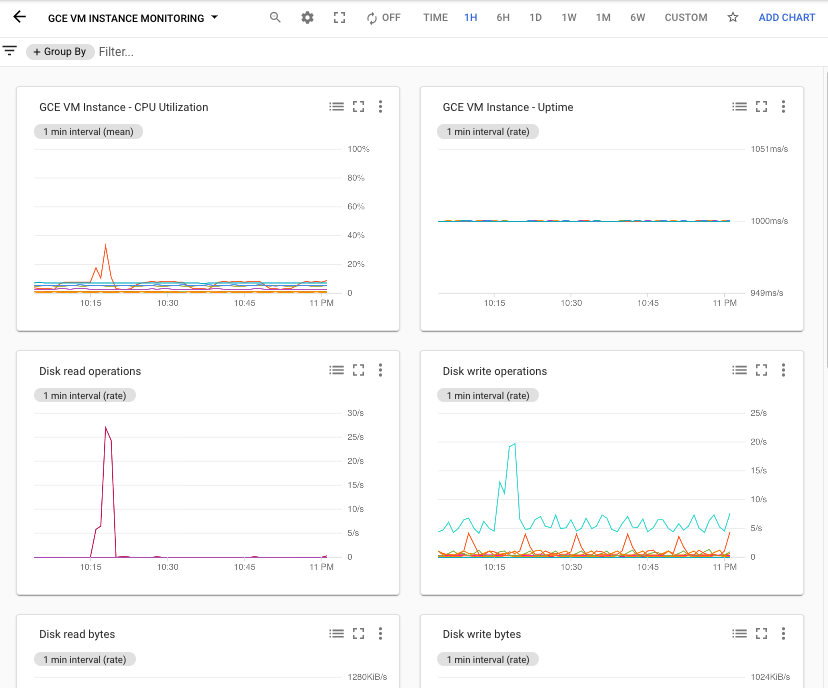
Each file in the repository creates a new custom dashboard. For example,
the file gce-vm-instance-monitoring.json creates a dashboard with the title
"GCE VM Instance Monitoring". To view this dashboard, do the following:
-
In the Google Cloud console, go to the Dashboards page:
If you use the search bar to find this page, then select the result whose subheading is Monitoring.
- In the toolbar of the Google Cloud console, select your Google Cloud project. For App Hub configurations, select the App Hub host project or management project.
- In the list of dashboards, click "GCE VM Instance Monitoring". If you have a lot of dashboards, then you might want to filter for custom dashboards or for the name of the new dashboard.
The following screenshot shows part of the installed dashboard:
Add or remove user-defined labels
Labels can help you locate dashboards based on the type of content
they display. For example, you might add the label prod to dashboards
that display information about production systems. Similarly, you might
add the label staging to indicate the dashboard displays information
about staging systems.
You can add labels only to custom dashboards. When a dashboard displays the Add labels to dashboard button, then you can configure which labels are applied to the dashboard.
To add or remove user-defined labels on a custom dashboard, do the following:
-
In the Google Cloud console, go to the Dashboards page:
If you use the search bar to find this page, then select the result whose subheading is Monitoring.
- In the list of dashboards, locate the dashboard and then click Add labels to dashboard.
- Do one of the following:
To create a label and add it to your dashboard, in the Create a new label section, enter the name of the label in the textbox and then click Create and apply.
- To configure which labels are added to your dashboard, click arrow_drop_down Select labels to apply, select the labels, and then click Ok.
- To save your changes, click Confirm.