

You can add alerting policy charts and incident widgets to your Cloud Monitoring custom dashboards to monitor policy thresholds and track open incidents alongside your metric data. An alerting policy chart displays the monitored time series, the threshold, and the number of open incidents. An incident widget provides a tabular view of incidents, letting you investigate policy conditions and incident details directly from your dashboard.
The information in this document is for the Google Cloud console. For information about using the Cloud Monitoring API, see the following documents:
- Create and manage dashboards by API.
- Dashboard with an
AlertChartwidget. - Dashboard with an
IncidentListwidget.
This feature is supported only for Google Cloud projects. For App Hub configurations, select the App Hub host project or management project.
Before you begin
Complete the following in the Google Cloud project where you want to create and manage dashboards:
-
To get the permissions that you need to create and modify custom dashboards by using the Google Cloud console, ask your administrator to grant you the Monitoring Editor (
roles/monitoring.editor) IAM role on your project. For more information about granting roles, see Manage access to projects, folders, and organizations.You might also be able to get the required permissions through custom roles or other predefined roles.
For more information about roles, see Control access with Identity and Access Management.
You can put up to 100 widgets on a dashboard.
Add alerting policies to a dashboard
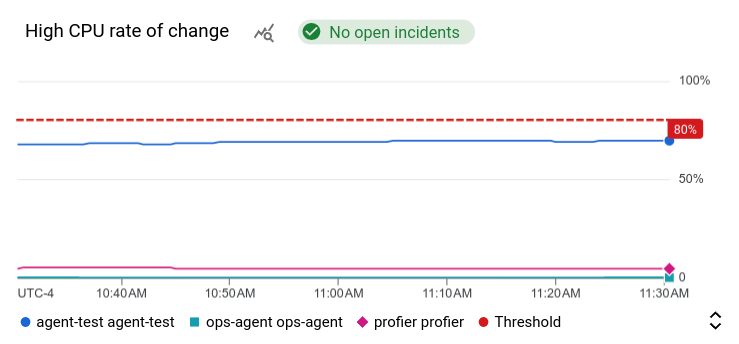
To view the data that an alerting policy monitors alongside log, metric, and trace data, add the alerting policy's chart to your dashboard. The chart displays the monitored time series, the associated threshold, the number of open incidents, and whether the policy is disabled. You can also use options on the chart to get more information about the alerting policy.
The following screenshot illustrates a chart for an alerting policy:
To display the chart for an alerting policy on a dashboard, do the following:
-
In the Google Cloud console, go to the Dashboards page:
If you use the search bar to find this page, then select the result whose subheading is Monitoring.
- In the toolbar of the Google Cloud console, select your Google Cloud project. For App Hub configurations, select the App Hub host project or management project.
- Select a dashboard or click Create dashboard.
- In the toolbar, click add Add widget.
- In the Add widget dialog, select
 Alerting Policy.
 - Click arrow_drop_down Alerting policy, and then select an alerting policy.
- To apply your changes to the dashboard, in the toolbar, click Apply. To discard your changes, click Cancel.
Inspect an alerting policy or explore chart metrics
When you are viewing a chart for an alerting policy, you might want more information about the alerting policy. For example, you might want to review the selected notification channels or what custom documentation is included with a notification. To get information about the alerting policy, try the following:
To access the alerting policy, click the incidents chip on the chart, and then select View alert policy.
To view details of the chart, place your pointer on the chart, click more_vert More chart options, and then select View in Metrics Explorer.
Metrics Explorer displays a copy of the chart that is on your dashboard.
Charts for deleted alerting policies
If you delete an alerting policy, any charts associated with that policy stop displaying data. For more information, see Alerting policy widget doesn't display any data.
Display incidents on a dashboard
To view a table of incidents in the same context as your metric data, add an Incidents widget, which lists information about incidents using a tabular format. For each incident, the widget displays the names of the alerting policy and condition, and when the incident opened. The widget includes options that let you view the associated alerting policy and the incident details.
The following screenshot illustrates an Incidents widget:
Incidents widget." class="screenshot">
The remaining information in this section is for the Google Cloud console. For information about using the Cloud Monitoring API, see Dashboard with an Incidents widget.
An Incidents widget can list at most 20 alerting policies or at most 20 resources. An Incidents widget can't list both alerting policies and resources.
To display incidents on a dashboard, do the following:
-
In the Google Cloud console, go to the Dashboards page:
If you use the search bar to find this page, then select the result whose subheading is Monitoring.
- In the toolbar of the Google Cloud console, select your Google Cloud project. For App Hub configurations, select the App Hub host project or management project.
- Select a dashboard or click Create dashboard.
- In the toolbar, click add Add widget.
- In the Add widget dialog, select
 Incidents.
 - Optional: Add a title.
Optional: Select the criteria that define which incidents are shown. By default, all incidents in the Google Cloud project are listed. However, you can restrict the widget to display incidents for specific alerting policies or resource types:
To display all incidents, use the default settings.
To display only incidents for specific alerting policies, select Alert policy and then make selections from the Alert policies menu.
There is a limit of 20 alerting policies per Incidents widget. If you exceed this limit, the Google Cloud console displays the error message
"You must choose no more than 20 policies".To display only incidents for specific resource types, select Resource type and then make selections from the Resource types menu.
There is a limit of 20 resources per Incidents widget. If you exceed this limit, then saving your dashboard fails.
You can't select specific alerting policies and specific resource types.
To apply your changes to the dashboard, in the toolbar, click Apply. To discard your changes, click Cancel.
By default, only open incidents are shown. To show all incidents,
including those that have closed within the time interval specified by
the time-range selector, place your pointer on the
Incidents widget to enable the toolbar, and then enable the
 Show closed incidents toggle.
You can sort the list of incidents by the date opened or closed. You can also search the list by using the filter_list Filter field.
Inspect an incident or explore alerting policy details
When you are viewing an Incidents widget, you might want information about the incident or the alerting policy:
To view the details of an incident, find that incident in the Incidents widget and click View.
To view the details of the alerting policy associated with the incident, find that incident in the Incidents widget and then select the policy name.
What's next
You can also add widgets to your custom dashboards that display the following:
- Metric data
- Log entries
- Trace data
- Descriptive text
- Service-level objectives (SLOs) for a set of services
For information about exploring charted data and filtering your dashboards, see the following documents: