
Looker Studio reports tell stories with data. These stories can persuade, provide insights, validate decisions, or argue for a change of course. Good reports help you find actionable information quickly. This page provides a quick overview of Looker Studio reports for viewers: the people who consume the report.
View a report
Looker Studio reports can come to you in the following ways:
- The report's creator can send you a direct email invitation to view or edit the report.
- The report can be sent to you via scheduled email distribution. To view the report, click the link in the email.
- The report can be downloaded as a PDF and stored on a web server. To view the report in Looker Studio, click the link in the PDF, if it's included.
- The report can be embedded in another website or social media post. To view the report in Looker Studio, click the link at the bottom of the report.
- Finally, you can view the all reports that have been shared with you in the Looker Studio home page:
Find and view reports in Looker Studio
To find and view reports in Looker Studio, follow these steps:
- Sign in to Looker Studio.
- To search for a report, use the following options:
- Use the search bar at the top of the page. You can search by the following criteria:
- Type: Search for reports, data sources, workspaces, or folders.
- Owner: Search for content that's owned by you, shared with you, or owned by a specific user.
- Location: Search for content that's located in the sandbox, the trash, or a specific location.
- Date Modified: Search for content that was most recently modified in a timeframe of your choice.
- Edit or delete applied search options in the Search Results section.
- Use the search bar at the top of the page. You can search by the following criteria:
- After running a search, click Sort to sort the search results. You can sort by the following criteria:
- The name of the report
- The last time that the report was modified by any user
- The last time that you modified the report
- The last time that you opened the report You can also choose whether folders should be included in the sorting or listed before all files.
- Click the report name in the list to open it.
Once you're viewing a Looker Studio report, here are some of the things you can do with it.
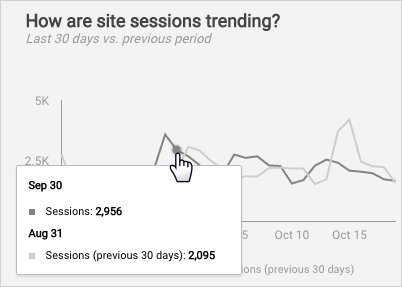
Dive into your data
Mouse over the visual elements of a chart (lines, bars, segments, maps, etc.) to display the detailed data under that section of the graph.
Change the date range
Charts have a different default date ranges, depending on the data source they are based on. For example, charts from Google Analytics show the previous 28 days' worth of data by default. The report's author might include a Date Range control, giving you the option of displaying a different date range.
To change the date range, follow these steps:
- View the report.
- Click the Date Range dropdown.
- Use one of the preset date options, such as Last week, Yesterday, or This quarter, or use the calendar to select your beginning and ending dates.
- Click Apply.
Learn more about creating charts with date and time data.
Refine your view
Reports can include controls. Controls make your report interactive by letting viewers focus on the data that is important to them.
Learn more about using controls.
Turn the page
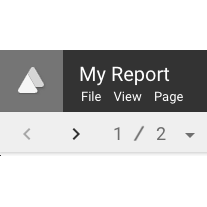
Looker Studio reports can have multiple pages. Use the Page menu or page controls in the toolbar to navigate through the report.
Learn how to add pages to your report.
Share the report
Sharing is caring! Use the File > Share menu option to invite other people to view or collaborate on your report.
Learn how to share a report.
Make it yours
Use the File > Make a copy menu option to save an editable version of a report.
Learn more about copying reports.