
Conversational Analytics is a chat with your data feature powered by Gemini for Google Cloud. Conversational Analytics empowers users with no expertise in business intelligence to ask data-related questions in regular, natural (conversational) language, and go beyond static dashboards. Conversational Analytics is available in Looker (Google Cloud core) and Looker (original) instances.
Learn how and when Gemini for Google Cloud uses your data.
Navigate to Conversational Analytics
You can access Conversational Analytics in Looker in the following ways:
- From the main navigation menu, select
 Conversations.
 - From the Create menu, select Conversation.
- From a Looker Explore, select Start a conversation.
Start a conversation with an Explore or a data agent
Sets of questions that you ask about a dataset are organized by conversation. Splitting work into multiple conversations can be useful for organizing lines of inquiry. To create a new conversation, follow these steps:
- Navigate to the Conversations page.
Choose one of the following options to start your conversation:
Explores: To start a conversation based on up to five Looker Explore, select the Explore panel. The project name is listed beside the Explore name.
Agents: Data agents are customized with context and instructions that are specific to your data. To start a conversation with an existing data agent, select the Agents tab, and then select a data agent. You can start a conversation with a data agent that you already created or that another user has shared with you. To create a new data agent, select New agent.
By default the conversation is called "Untitled." After you ask your first question in the conversation, Conversational Analytics automatically generates a conversation title that is based on your question and response. To change the generated name, click the title at the top of the conversation page and enter a new conversation name. To save your changes, click elsewhere on the page, or press return (Mac) or Enter (PC).
Once you have created a conversation, you can ask questions about the data in the Ask a question field within the conversation. You can return to the conversation from the Recent Conversations section.
Start a conversation from within a Looker Explore
You can also start a conversation directly with a Looker Explore. To start a conversation, navigate to the Explore and select Start a conversation.
Ask questions
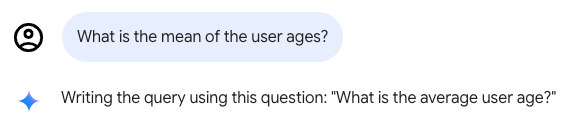
You can ask questions to get insights from your data. When you're beginning a new conversation, Conversational Analytics suggests some starting questions to ask. The questions don't need to be in a specific format or use a specific syntax. However, they do need to relate to the Explore that you've selected. Conversational Analytics may rephrase your question after you've written a query, and the rephrased question will be displayed in the conversation window following your original question. For example, Conversational Analytics might rephrase the question "What is the mean of user ages?" to "What is the average user age?"
Conversational Analytics will take previous questions and answers into account as you continue the conversation. You can take previous answers and build on them by further refining results or changing the visualization type.
For more guidance on creating questions, see Limitations on questions.
Conversation metadata
When you converse with an Explore or a data agent, the collapsible Data panel shows the name of the Looker Explore that is being used by the conversation. The Data panel also provides the following options:
- View fields: When chatting with an Explore, you can view the Explore in a new browser window by clicking View fields.
- Edit agent: When chatting with a data agent, you can edit the details about the data agent by clicking Edit agent.
- New conversation: Start a new conversation with the Looker Explore that the current conversation is using.
Manage queries within a conversation
When you converse with data, you can manage the conversation by stopping an active query response while it is running or by deleting the most recent question and its response.
Stop a query response
To stop running a query after you've sent a message, click
Stop response. Conversational Analytics stops running the query and displays the following message: The query was cancelled.
Delete the most recent question
To delete the most recent question and its response, follow these steps:
- Hold your cursor over the most recent question, and then click Delete message.
- In the Permanently delete message? dialog, click Delete to permanently delete the question and its response.
Understand query results and calculations
When you ask questions about your data in Conversational Analytics, the response might include a visualization, a data table, or other details, depending on your specific query and the connected data. To open the query results as an Explore, click Open in Explore within the query results.
In addition to this query response, Conversational Analytics provides the following options for understanding query results and calculations:
- Details about how the answer was calculated
- If available, the option to view additional insights about the response
Determine how an answer was calculated
To see how Conversational Analytics arrived at an answer or created a visualization, click How was this calculated? within the query results.
When you click How was this calculated?, Conversational Analytics displays a Text section. The Text section provides a plain text explanation of the steps that were taken by Conversational Analytics to arrive at the given answer. This explanation includes the raw field names that were used, the calculations that were done, the filters that were applied, the sort order, and other details.
If your Looker admin has enabled the Code Interpreter, by turning on the Advanced analytics option for Conversational Analytics, the Code tab displays the additional generated Python code for any advanced queries.
Get additional insights
When Conversational Analytics is able to provide additional data insights about a response, an Insights keyboard_arrow_down button will appear. Click Insights keyboard_arrow_down to see additional information about your query. Insights only analyzes the data that was returned by your prompt and won't run additional queries to fetch additional data. Insights can be a useful source for ideas for follow-up questions to continue the conversation.
The following is an example of some insights that might be returned by the prompt "How many users are in each state?":
- A general summary of high and low data volume areas. For example:
- "California, Texas, and Ohio are key states for business operations based on the data provided."
- "England and specific regions in China, namely Anhui and Guangdong, show significant business activity."
- "Some states, including Mie, Akita, and Iwate, have minimal presence based on the data."
- An assessment of the variability of the dataset. For example, "The data indicates varying operational scales across different locations."
Manage conversations
Conversations are listed by title in the Recent section. You can change the names of conversations, delete conversations, or restore them from the trash folder.
Delete a conversation
To move a conversation to the trash, open the conversation and click Move to trash.
Restore or permanently delete a conversation
To restore or permanently delete a conversation from the trash, follow these steps:
- Within Conversational Analytics, select Trash in the left navigation panel to view the list of conversations that have been moved to the trash.
- In the Trash section, click the name of the conversation that you want to restore or permanently delete.
In the Are you sure? dialog, select one of the following options:
- Cancel: Cancels the action.
- Restore: Restores the conversation. The conversation can be accessed from the Recent section of the left navigation menu within Conversational Analytics.
- Delete forever: Permanently deletes the conversation.
Known limitations
Conversational Analytics has the following known limitations.
Limitations on visualizations
Conversational Analytics leverages Vega-lite for conversation chart generation. The following Vega chart types are fully supported:
- Line chart (one or more series)
- Area chart
- Bar chart (horizontal, vertical, stacked)
- Scatter plot (one or more groups)
- Pie chart
The following Vega chart types are supported, but you may encounter unexpected behavior when rendering them:
- Maps
- Heatmaps
- Charts with tooltips
Chart types that exist outside the Vega catalog are not supported. Any charts that are not specified in this section are considered unsupported.
Limitations on data sources
Conversational Analytics has the following data source limitations:
- For Looker data, Conversational Analytics can return a maximum of 5,000 rows per query.
- Conversational Analytics doesn't support BigQuery's Flexible Column Names feature.
- Conversational Analytics cannot set the value of a filter-only that is defined using the LookML
parameterparameter. - While Conversational Analytics generally supports connections to Looker (Google Cloud core) instances with private connections configurations, Conversational Analytics doesn't support Looker (Google Cloud core) instances that are configured to use CMEK or VPC Service Controls.
Limitations on questions
Conversational Analytics supports questions that can be answered by a single visualization, for example:
- Metric trends over time
- Breakdown or distribution of a metric by dimension
- Unique values for one or more dimensions
- Single metric values
- The top dimension values by metric
Conversational Analytics doesn't yet support questions that can only be answered with the following types of complicated visualizations:
- Prediction and forecasting
- Advanced statistical analysis, including correlation and anomaly detection
More advanced questions, such as forecasting, can be answered when the Code Interpreter is enabled.
Sample conversation
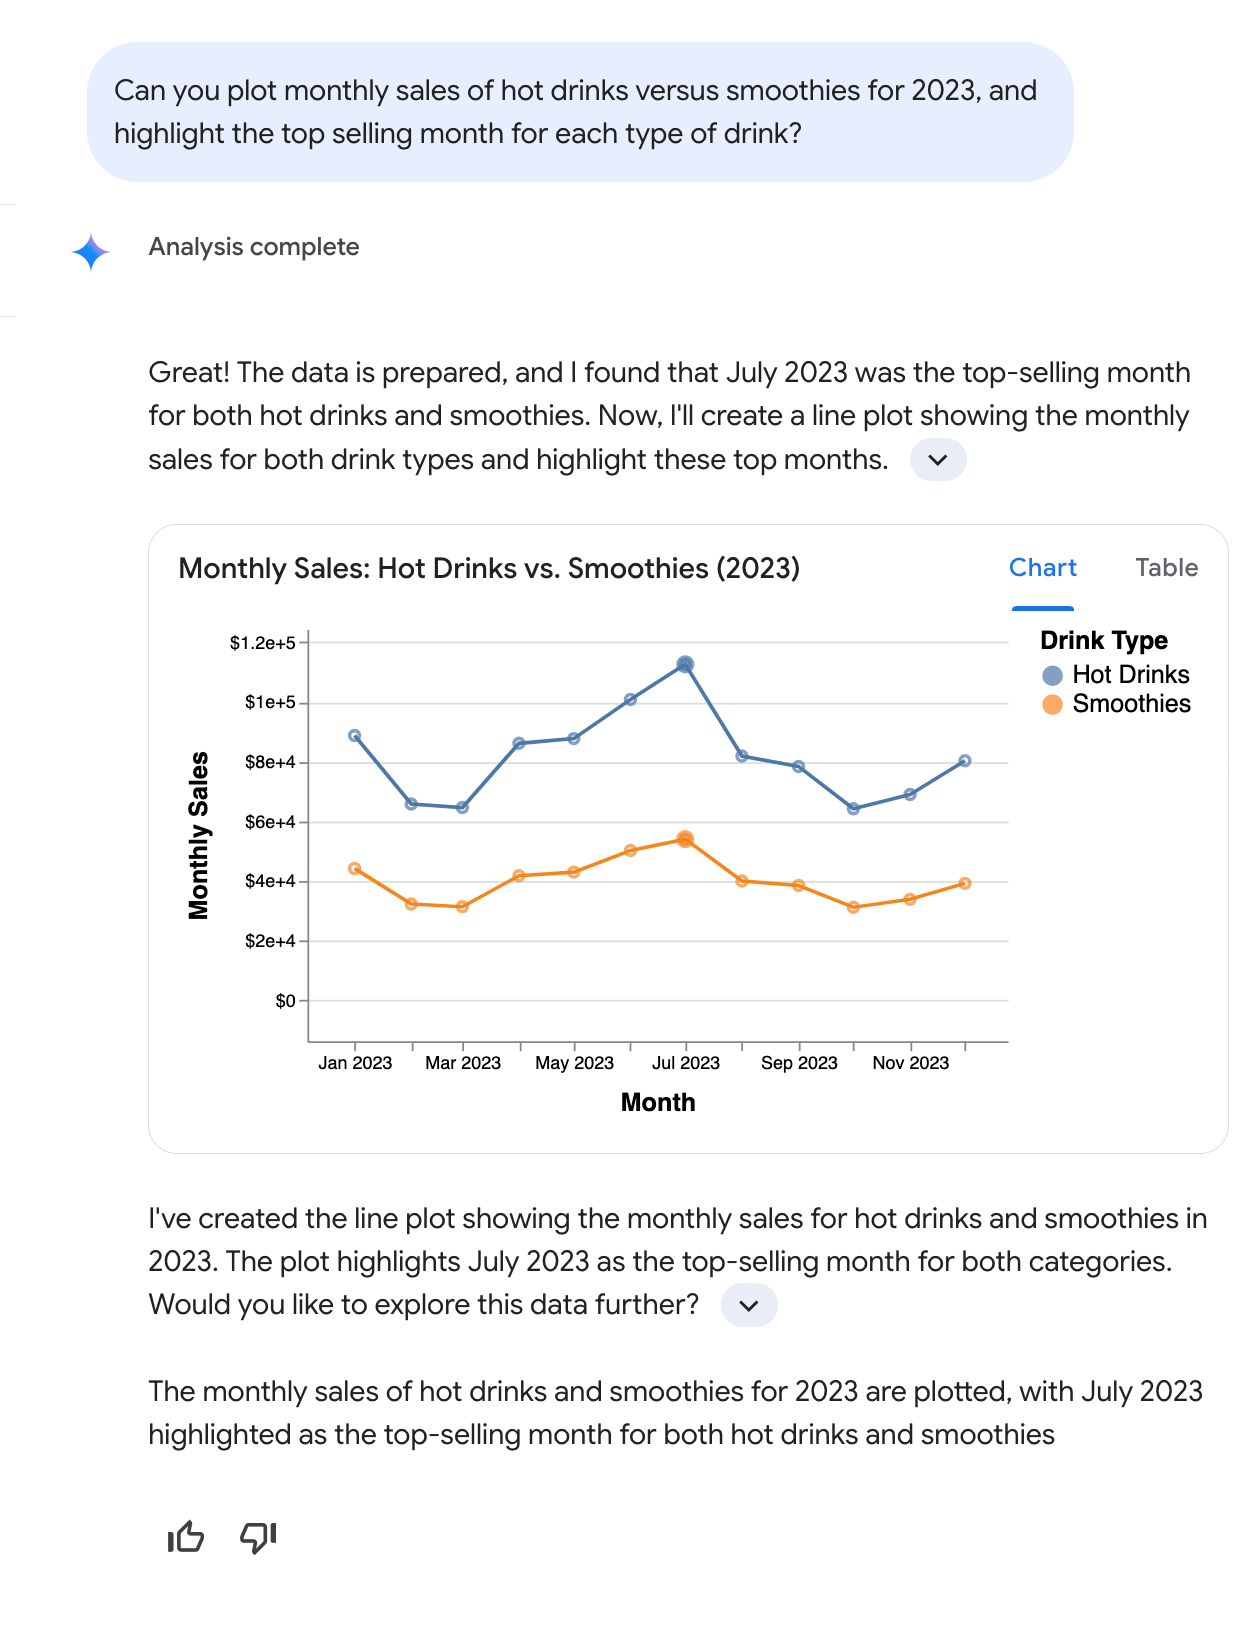
The following sample conversation shows how a user can interact with Conversational Analytics in a natural, back-and-forth way. In this example, the user asks the following question: "Can you plot monthly sales of hot drinks versus smoothies for 2023, and highlight the top selling month for each type of drink?" Conversational Analytics responds by generating a line graph that displays the monthly sales of hot drinks and smoothies for 2023, highlighting July as the month with the highest sales for both categories.
 s
s
As this sample conversation illustrates, Conversational Analytics interprets natural language requests, including multi-part questions that use common terms like "sales" and "hot drinks," without requiring users to specify exact database field names (like Total monthly drink sales) or define filter conditions (like type of beverage = hot). Conversational Analytics describes its key findings, explains its reasoning, and provides an answer that includes text and, where appropriate, a chart. To encourage deeper analysis, Conversational Analytics may also suggest follow-up questions.
Related resources
Conversational Analytics in Looker overview: The landing page for Conversational Analytics with a list of key features links to all Conversational Analytics documentation.
Create and manage data agents: With data agents, you can customize the AI-powered data querying agent by providing context and instructions that are specific to your data, which helps Conversational Analytics generate more accurate and contextually relevant responses.
Best practices for configuring Conversational Analytics in Looker: Strategies and best practices to help Looker administrators and LookML developers successfully configure, deploy, and optimize Conversational Analytics.
Enable advanced analytics with the Code Interpreter: The Code Interpreter within Conversational Analytics translates your natural language questions into Python code and executes that code. Compared to standard SQL-based queries, the Code Interpreter's use of Python enables more complex analysis and visualizations.