
To compare a metric filtered by several timeframes in the same Look or dashboard, you can use filtered measures. Filtered measures let you apply a hardcoded filter directly to a measure, rather than applying a filter to an entire query.
If you had a limited number of timeframes that you were interested in comparing, you could define a few measures with hardcoded timeframe filters (for example, "this year" and "last year") and display them in an Explore, a Look, or a dashboard. You can also take this approach a step further to make timeframe comparisons dynamic — or measures that change with timeframes specified by users in Explores, Looks, or dashboards — by using templated filters in filtered measures.
Pattern overview
On a high level, this approach involves three components:
-
Define a templated filter of
type: datefor each timeframe that will appear as a filter-only field on your Explore, Look, or dashboard. -
Create a
yesnotype dimension to tie to the templated filter so that when a user selects a value for the filter-only field, theyesnodimension returns "yes" for records that meet the filter's conditions. -
Create a filtered measure that references the
yesnodimension with the conditionvalue = "yes". This ensures that the measure only aggregates records that meet the timeframe condition that is specified in the filter that is defined in step 1.
This logic lets users create analyses and visualizations that compare values from different timeframes, like the following Explore:
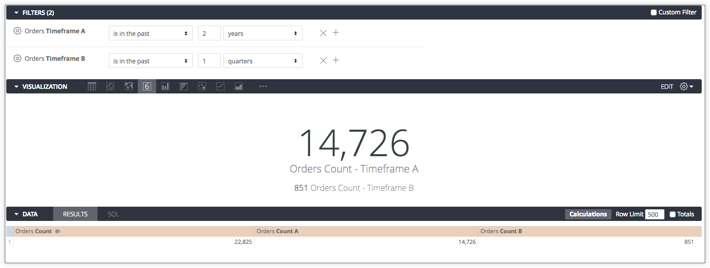
Users can change the values in the Timeframe A and Timeframe B filters and only impact the values for Orders Count A and Orders Count B. Orders Count A and Orders Count B are measures with filters that reference the timeframe conditions in the timeframe filters. Timeframe A impacts the values for Orders Count A, and Timeframe B impacts the values for Orders Count B.
The following section provides the LookML for this example.
The LookML
The following LookML assumes that you have a dimension group with a raw timeframe named created_raw:
  dimension_group: created {
    type: time
    timeframes: [
      raw,
      time,
      date,
    ]
    sql: ${TABLE}.created_at ;;
  }
The LookML for comparing count measures — Orders Count A and Orders Count B — filtered by two dynamic timeframes — Timeframe A and Timeframe B — based on created_raw looks like this:
  ## filter determining time range for all "A" measures
  filter: timeframe_a {
    type: date_time
  }
  ## flag for "A" measures to only include appropriate time range
  dimension: group_a_yesno {
    hidden: yes
    type: yesno
    sql: {% condition timeframe_a %} ${created_raw} {% endcondition %} ;;
  }
  ## filtered measure A
   measure: count_a {
    type: count
    filters: [group_a_yesno: "yes"]
   }
  ## filter determining time range for all "B" measures
   filter: timeframe_b {
    type: date_time
   }
  ## flag for "B" measures to only include appropriate time range
  dimension: group_b_yesno {
    hidden: yes
    type: yesno
    sql: {% condition timeframe_b %} ${created_raw} {% endcondition %} ;;
   }
   measure: count_b {
    type: count
    filters: [group_b_yesno: "yes"]
   }
You can use this logic to create as many timeframe comparisons as you need.
Filtering an entire query with dynamic timeframes
Filtered measures do not apply a filter condition to overall query results. If you want to limit the overall query results within the specified timeframes, you can:
-
Create the following
yesnodimension - Filter the dimension values by "yes" in Explores, Looks, or dashboards:
  dimension: is_in_time_a_or_b {
    group_label: "Time Comparison Filters"
    type: yesno
    sql:
      {% condition timeframe_a %} ${created_raw} {% endcondition %} OR
      {% condition timeframe_b %} ${created_raw} {% endcondition %} ;;
  }
This prevents the database from scanning more data than needed for the query — and may help with performance and query cost.