
本頁說明如何自訂 GKE Inference Gateway 部署作業。
本頁面適用於負責管理 GKE 基礎架構的網路專家,以及管理 AI 工作負載的平台管理員。
如要管理及最佳化推論工作負載,請設定 GKE 推論閘道的進階功能。
瞭解及設定下列進階功能:
- 如要使用 Model Armor 整合功能,請設定 AI 安全檢查。
- 如要使用 API 安全防護、速率限制和分析等功能強化 GKE Inference Gateway,請設定 Apigee 進行驗證和 API 管理。
- 如要根據要求主體中的模型名稱轉送要求,請設定以主體為準的轉送規則。
- 如要查看 GKE Inference Gateway 和模型伺服器的指標和資訊主頁,並啟用 HTTP 存取記錄,請設定可觀測性。
- 如要自動調整 GKE Inference Gateway 部署作業的資源配置,請設定自動調度資源。
設定 AI 安全檢查
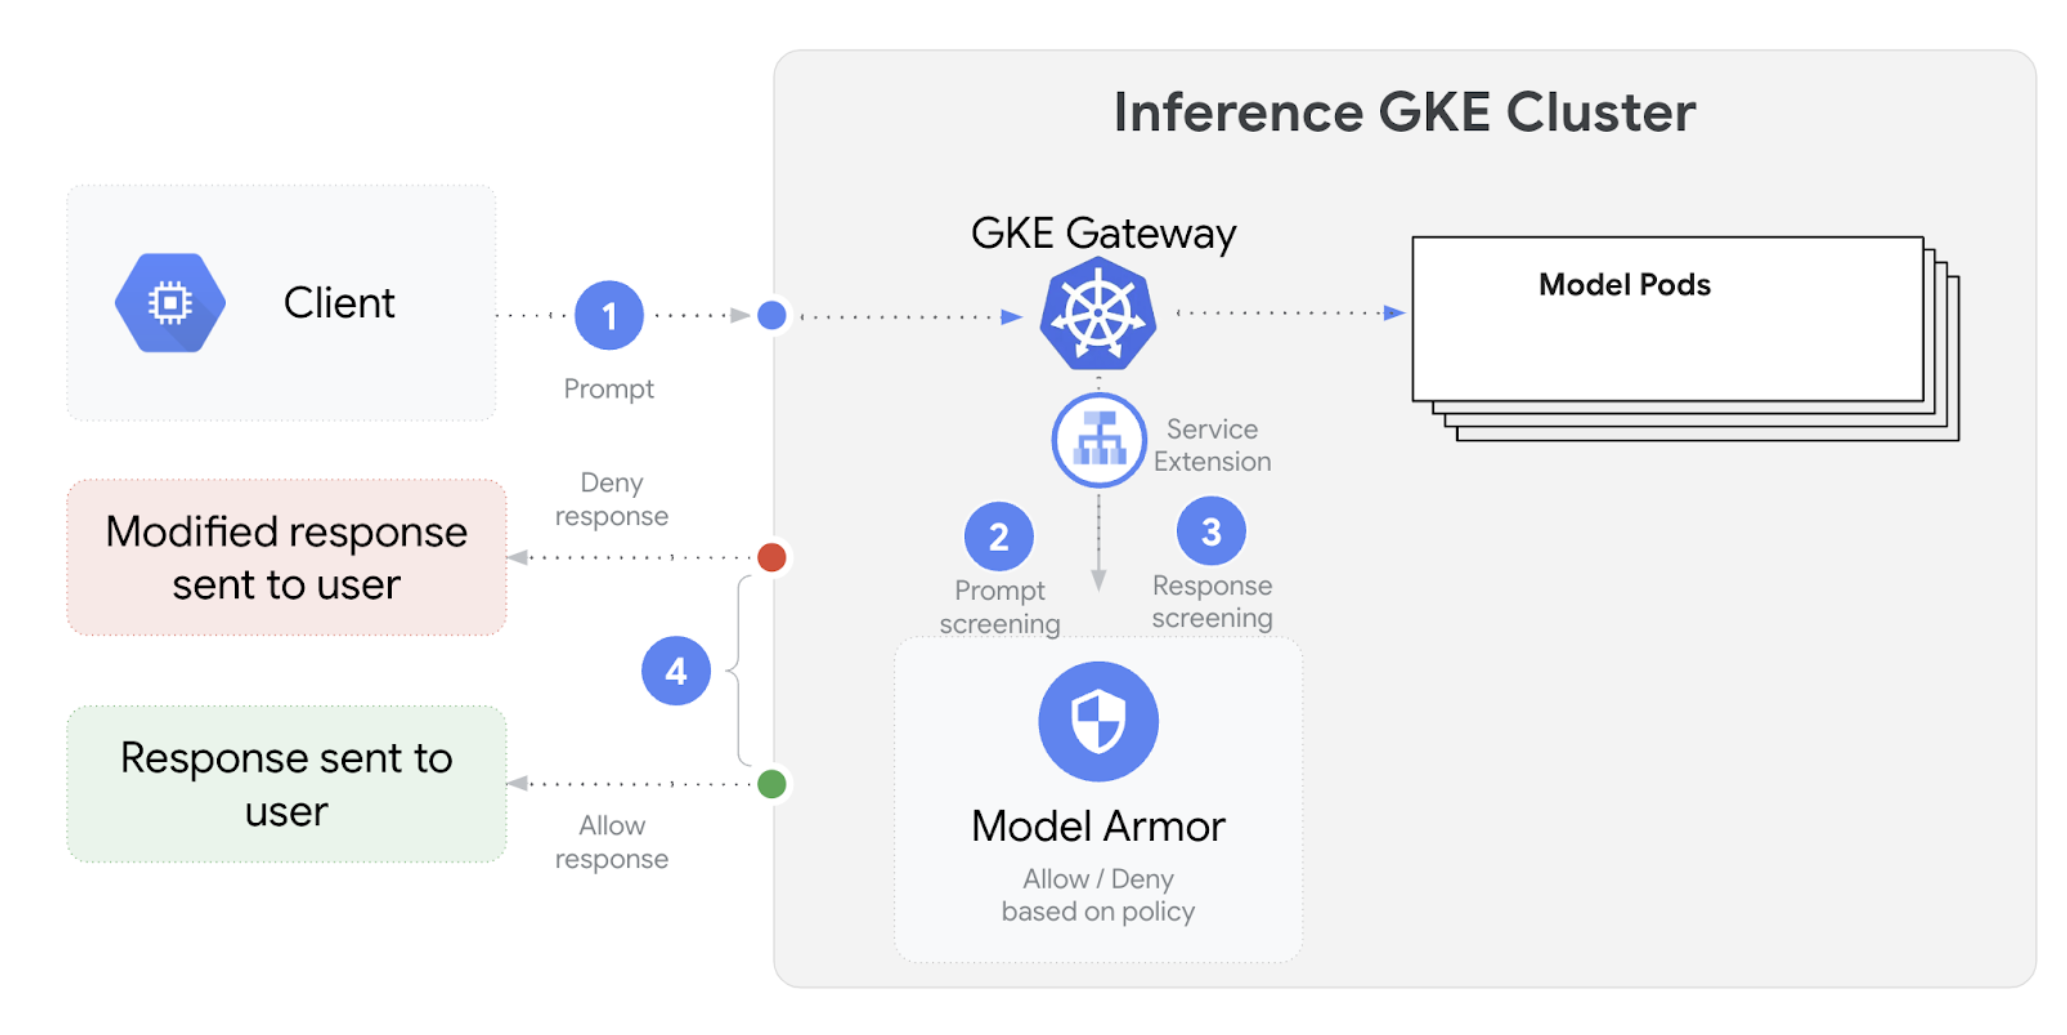
GKE Inference Gateway 會與 Model Armor 整合,針對使用大型語言模型 (LLM) 的應用程式,對提示和回覆執行安全檢查。這項整合功能可在基礎架構層級提供額外的安全措施,與應用程式層級的安全措施相輔相成。這項功能可讓您集中管理所有 LLM 流量的政策。您也可以使用 NVIDIA NeMo Guardrails 進行安全檢查。
下圖說明如何將 Model Armor 與 GKE 叢集上的 GKE Inference Gateway 整合:
如要設定 AI 安全性檢查,請按照下列步驟操作:
必要條件
- 在 Google Cloud 專案中啟用 Model Armor 服務。
使用 Model Armor 控制台、Google Cloud CLI 或 API,建立 Model Armor 範本。下列指令會建立名為
llm的範本,用於記錄作業及篩除有害內容。# Set environment variables PROJECT_ID=$(gcloud config get-value project) # Replace <var>CLUSTER_LOCATION<var> with the location of your GKE cluster. For example, `us-central1`. LOCATION="CLUSTER_LOCATION" MODEL_ARMOR_TEMPLATE_NAME=llm # Set the regional API endpoint gcloud config set api_endpoint_overrides/modelarmor \ "https://modelarmor.$LOCATION.rep.googleapis.com/" # Create the template gcloud model-armor templates create $MODEL_ARMOR_TEMPLATE_NAME \ --location $LOCATION \ --pi-and-jailbreak-filter-settings-enforcement=enabled \ --pi-and-jailbreak-filter-settings-confidence-level=MEDIUM_AND_ABOVE \ --rai-settings-filters='[{ "filterType": "HATE_SPEECH", "confidenceLevel": "MEDIUM_AND_ABOVE" },{ "filterType": "DANGEROUS", "confidenceLevel": "MEDIUM_AND_ABOVE" },{ "filterType": "HARASSMENT", "confidenceLevel": "MEDIUM_AND_ABOVE" },{ "filterType": "SEXUALLY_EXPLICIT", "confidenceLevel": "MEDIUM_AND_ABOVE" }]' \ --template-metadata-log-sanitize-operations \ --template-metadata-log-operations
授予 IAM 權限
Service Extensions 服務帳戶需要權限才能存取必要資源。執行下列指令,授予必要角色:
PROJECT_NUMBER=$(gcloud projects describe $PROJECT_ID --format 'get(projectNumber)')

gcloud projects add-iam-policy-binding $PROJECT_ID \
    --member=serviceAccount:service-$PROJECT_NUMBER@gcp-sa-dep.iam.gserviceaccount.com \
    --role=roles/container.admin

gcloud projects add-iam-policy-binding $PROJECT_ID \
    --member=serviceAccount:service-$PROJECT_NUMBER@gcp-sa-dep.iam.gserviceaccount.com \
    --role=roles/modelarmor.calloutUser

gcloud projects add-iam-policy-binding $PROJECT_ID \
    --member=serviceAccount:service-$PROJECT_NUMBER@gcp-sa-dep.iam.gserviceaccount.com \
    --role=roles/serviceusage.serviceUsageConsumer

gcloud projects add-iam-policy-binding $PROJECT_ID \
    --member=serviceAccount:service-$PROJECT_NUMBER@gcp-sa-dep.iam.gserviceaccount.com \
    --role=roles/modelarmor.user
設定
GCPTrafficExtension如要將 Model Armor 政策套用至 Gateway,請建立具有正確中繼資料格式的
GCPTrafficExtension資源。將下列範例資訊清單儲存為
gcp-traffic-extension.yaml:kind: GCPTrafficExtension apiVersion: networking.gke.io/v1 metadata: name: my-model-armor-extension spec: targetRefs: - group: "gateway.networking.k8s.io" kind: Gateway name: GATEWAY_NAME extensionChains: - name: my-model-armor-chain1 matchCondition: celExpressions: - celMatcher: request.path.startsWith("/") extensions: - name: my-model-armor-service supportedEvents: - RequestHeaders - RequestBody - RequestTrailers - ResponseHeaders - ResponseBody - ResponseTrailers timeout: 1s failOpen: false googleAPIServiceName: "modelarmor.${LOCATION}.rep.googleapis.com" metadata: model_armor_settings: '[{"model": "${MODEL}","model_response_template_id": "projects/${PROJECT_ID}/locations/${LOCATION}/templates/${MODEL_ARMOR_TEMPLATE_NAME}","user_prompt_template_id": "projects/${PROJECT_ID}/locations/${LOCATION}/templates/${MODEL_ARMOR_TEMPLATE_NAME}"}]'更改下列內容:
GATEWAY_NAME:閘道的名稱。MODEL_ARMOR_TEMPLATE_NAME:Model Armor 範本的名稱。
gcp-traffic-extension.yaml檔案包含下列設定:targetRefs:指定這項擴充功能適用的閘道。extensionChains:定義要套用至流量的擴充功能鏈結。matchCondition:定義套用擴充功能的條件。extensions:定義要套用的擴充功能。supportedEvents:指定擴充功能叫用的事件。timeout:指定擴充功能的逾時時間。googleAPIServiceName:指定擴充功能的服務名稱。metadata:指定擴充功能的中繼資料,包括extensionPolicy和提示或回應清除設定。
將範例資訊清單套用至叢集:
export GATEWAY_NAME="your-gateway-name"
export MODEL="google/gemma-3-1b-it" # Or your specific model
envsubst < gcp-traffic-extension.yaml | kubectl apply -f -
設定 AI 安全檢查並與 Gateway 整合後,Model Armor 會根據定義的規則自動篩選提示和回覆。
設定 Apigee 進行驗證和 API 管理
GKE 推論閘道與 Apigee 整合,可為推論工作負載提供驗證、授權和 API 管理功能。如要進一步瞭解使用 Apigee 的好處,請參閱「使用 Apigee 的主要優點」。
您可以將 GKE 推論閘道與 Apigee 整合,透過 API 安全性、速率限制、配額、分析和營利等功能,提升 GKE 推論閘道效能。
必要條件
開始之前,請確認您具備以下項目:
- 執行 1.34.* 以上版本的 GKE 叢集。
- 已部署 GKE Inference Gateway 的 GKE 叢集。
- 在與 GKE 叢集相同的地區中建立 Apigee 執行個體。
- 安裝在 GKE 叢集中的 Apigee APIM 運算子及其 CRD。如需操作說明,請參閱「安裝 Apigee APIM 運算子」。
kubectl已設定為連線至 GKE 叢集。Google Cloud CLI已安裝並通過驗證。
建立 ApigeeBackendService
首先,請建立 ApigeeBackendService 資源。GKE Inference Gateway 會使用這個項目建立 Apigee 擴充功能處理器。
將下列資訊清單儲存為
my-apigee-backend-service.yaml:apiVersion: apim.googleapis.com/v1 kind: ApigeeBackendService metadata: name: my-apigee-backend-service spec: apigeeEnv: "APIGEE_ENVIRONMENT_NAME" # optional field defaultSecurityEnabled: true # optional field locations: name: "LOCATION" network: "CLUSTER_NETWORK" subnetwork: "CLUSTER_SUBNETWORK"更改下列內容:
APIGEE_ENVIRONMENT_NAME:Apigee 環境的名稱。注意:如果apigee-apim-operator是使用generateEnv=TRUE旗標安裝,則不需要設定這個欄位。如果沒有,請按照「建立環境」一文的操作說明建立 Apigee 環境。LOCATION:Apigee 執行個體的位置。CLUSTER_NETWORK:GKE 叢集的網路。CLUSTER_SUBNETWORK:GKE 叢集的子網路。
將資訊清單套用至叢集:
kubectl apply -f my-apigee-backend-service.yaml確認狀態是否已變為
CREATED:kubectl wait --for=jsonpath='{.status.currentState}'="CREATED" -f my-apigee-backend-service.yaml --timeout=5m
設定 GKE Inference Gateway
設定 GKE Inference Gateway,啟用 Apigee Extension Processor 做為負載平衡器流量擴充功能。
將下列資訊清單儲存為
my-apigee-traffic-extension.yaml:kind: GCPTrafficExtension apiVersion: networking.gke.io/v1 metadata: name: my-apigee-traffic-extension spec: targetRefs: - group: "gateway.networking.k8s.io" kind: Gateway name: GATEWAY_NAME extensionChains: - name: my-traffic-extension-chain matchCondition: celExpressions: - celMatcher: request.path.startsWith("/") extensions: - name: my-apigee-extension metadata: # The value for `apigee-extension-processor` must match the name of the `ApigeeBackendService` resource that was applied earlier. apigee-extension-processor: my-apigee-backend-service failOpen: false timeout: 1s supportedEvents: - RequestHeaders - ResponseHeaders - ResponseBody backendRef: group: apim.googleapis.com kind: ApigeeBackendService name: my-apigee-backend-service port: 443將
GATEWAY_NAME替換為閘道名稱。將資訊清單套用至叢集:
kubectl apply -f my-apigee-traffic-extension.yaml等待
GCPTrafficExtension狀態變成Programmed:kubectl wait --for=jsonpath='{.status.ancestors[0].conditions[?(@.type=="Programmed")].status}'=True -f my-apigee-traffic-extension.yaml --timeout=5m
使用 API 金鑰傳送通過驗證的要求
如要找出 GKE Inference Gateway 的 IP 位址,請檢查 Gateway 狀態:
GW_IP=$(kubectl get gateway/GATEWAY_NAME -o jsonpath='{.status.addresses[0].value}')將
GATEWAY_NAME替換為閘道名稱。測試未經驗證的要求。應拒絕這項要求:
curl -i ${GW_IP}/v1/completions -H 'Content-Type: application/json' -d '{
"model": "food-review",
"prompt": "Write as if you were a critic: San Francisco",
"max_tokens": 100,
"temperature": 0
}'
畫面會顯示類似以下的回應,表示 Apigee 擴充功能運作正常:
{"fault":{"faultstring":"Raising fault. Fault name : RF-insufficient-request-raise-fault","detail":{"errorcode":"steps.raisefault.RaiseFault"}}}存取 Apigee UI 並建立 API 金鑰。如需相關操作說明,請參閱「建立 API 金鑰」一節。
在 HTTP 要求標頭中傳送 API 金鑰:
curl -i ${GW_IP}/v1/completions -H 'Content-Type: application/json' -H 'x-api-key: API_KEY' -d '{
"model": "food-review",
"prompt": "Write as if you were a critic: San Francisco",
"max_tokens": 100,
"temperature": 0
}'
然後將
API_KEY替換成您的 API 金鑰。
如要進一步瞭解如何設定 Apigee 政策,請參閱「Use API management policies with the Apigee APIM Operator for Kubernetes」。
設定可觀測性
GKE 推論閘道可深入分析推論工作負載的健康狀態、效能和行為。這有助於您找出及解決問題、盡可能提高資源使用率,並確保應用程式的可靠性。
Google Cloud 提供下列 Cloud Monitoring 資訊主頁,可為 GKE Inference Gateway 提供推論觀測功能:
- GKE Inference Gateway 資訊主頁:提供 LLM 服務的黃金指標,例如要求和權杖處理量、延遲時間、錯誤,以及
InferencePool的快取用量。如要查看可用的 GKE Inference Gateway 指標完整清單,請參閱「公開指標」。 - AI/機器學習可觀測性資訊主頁:提供基礎架構用量、DCGM 指標和 vLLM 模型效能指標的資訊主頁。
- 模型伺服器資訊主頁:提供模型伺服器關鍵信號的資訊主頁。您可以藉此監控模型伺服器的負載和效能,例如
KVCache Utilization和Queue length。 - 負載平衡器資訊主頁:回報負載平衡器的指標,例如每秒要求數、端對端要求服務延遲時間,以及要求-回應狀態碼。這些指標有助於瞭解端對端要求服務的效能,並找出錯誤。
- Data Center GPU Manager (DCGM) 指標:提供 DCGM 指標,例如 NVIDIA GPU 的效能和使用率。您可以在 Cloud Monitoring 中設定 DCGM 指標。詳情請參閱「收集及查看 DCGM 指標」。
查看 GKE Inference Gateway 資訊主頁
如要查看 GKE Inference Gateway 資訊主頁,請按照下列步驟操作:
前往 Google Cloud 控制台的「Monitoring」頁面。
在導覽窗格中,選取「Dashboards」(資訊主頁)。
在「整合」部分中,選取「GMP」。
在「Cloud Monitoring Dashboard Templates」(Cloud Monitoring 資訊主頁範本) 頁面中,搜尋「Gateway」。
查看 GKE Inference Gateway 資訊主頁。
或者,您也可以按照「監控資訊主頁」中的操作說明進行。
查看 AI/機器學習模型觀測能力資訊主頁
如要查看已部署的模型和資訊主頁,瞭解模型的觀測指標,請按照下列步驟操作:
前往 Google Cloud 控制台的「Deployed Models」(已部署模型) 頁面。
如要查看特定部署作業的詳細資料,包括指標、記錄和資訊主頁,請按一下清單中的模型名稱。
在模型詳細資料頁面中,按一下「可觀測性」分頁標籤,即可查看下列資訊主控台。如果系統提示,請點選「啟用」來啟用資訊主頁。
- 「基礎架構用量」資訊主頁會顯示使用率指標。
- 「DCGM」DCGM資訊主頁會顯示 DCGM 指標。
- 如果您使用 vLLM,系統會提供「模型效能」資訊主頁,並顯示 vLLM 模型效能的指標。
設定模型伺服器觀測資訊主頁
如要從每個模型伺服器收集黃金信號,並瞭解哪些因素會影響 GKE Inference Gateway 效能,您可以為模型伺服器設定自動監控功能。包括下列模型伺服器:
如要查看整合資訊主頁,請先確認您正在從模型伺服器收集指標。然後執行下列步驟:
前往 Google Cloud 控制台的「Monitoring」頁面。
在導覽窗格中,選取「Dashboards」(資訊主頁)。
選取「整合」下方的「GMP」。 系統會顯示相應的整合資訊主頁。
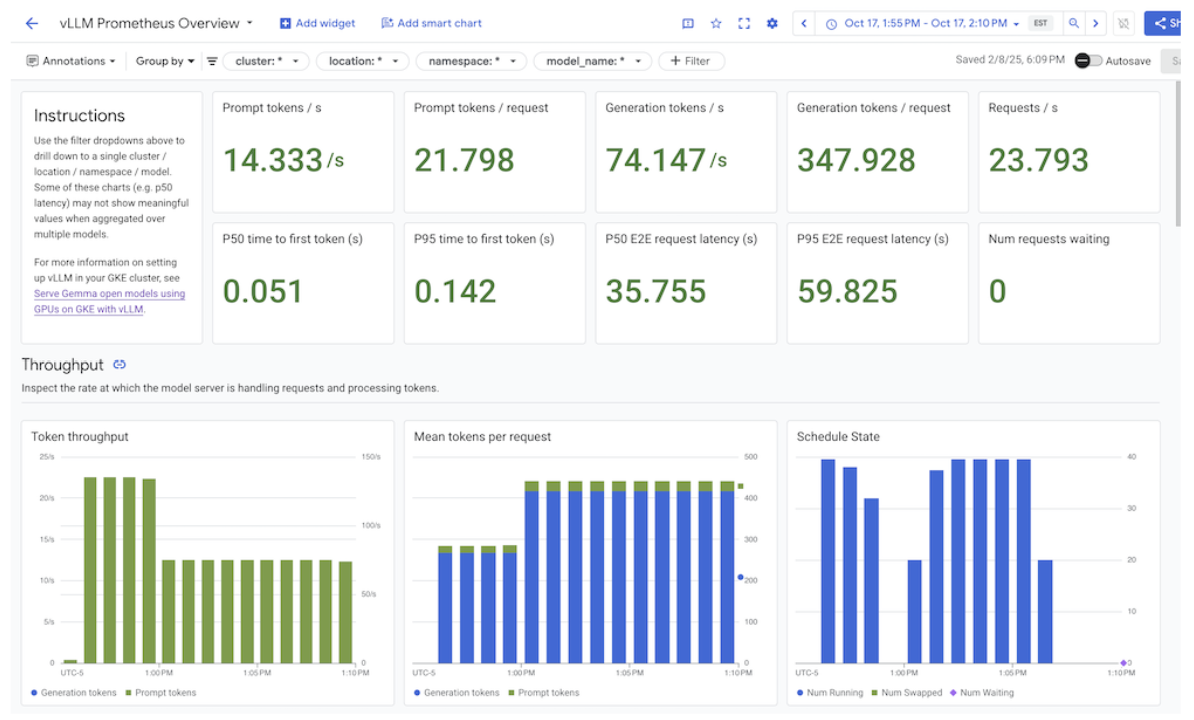
圖: 整合資訊主頁
詳情請參閱「自訂應用程式監控功能」。
設定 Cloud Monitoring 快訊
如要為 GKE Inference Gateway 設定 Cloud Monitoring 快訊,請完成下列步驟:
將下列範例資訊清單儲存為
alerts.yaml,並視需要修改門檻:groups: - name: gateway-api-inference-extension rules: - alert: HighInferenceRequestLatencyP99 annotations: title: 'High latency (P99) for model {{ $labels.model_name }}' description: 'The 99th percentile request duration for model {{ $labels.model_name }} and target model {{ $labels.target_model_name }} has been consistently above 10.0 seconds for 5 minutes.' expr: histogram_quantile(0.99, rate(inference_model_request_duration_seconds_bucket[5m])) > 10.0 for: 5m labels: severity: 'warning' - alert: HighInferenceErrorRate annotations: title: 'High error rate for model {{ $labels.model_name }}' description: 'The error rate for model {{ $labels.model_name }} and target model {{ $labels.target_model_name }} has been consistently above 5% for 5 minutes.' expr: sum by (model_name) (rate(inference_model_request_error_total[5m])) / sum by (model_name) (rate(inference_model_request_total[5m])) > 0.05 for: 5m labels: severity: 'critical' impact: 'availability' - alert: HighInferencePoolAvgQueueSize annotations: title: 'High average queue size for inference pool {{ $labels.name }}' description: 'The average number of requests pending in the queue for inference pool {{ $labels.name }} has been consistently above 50 for 5 minutes.' expr: inference_pool_average_queue_size > 50 for: 5m labels: severity: 'critical' impact: 'performance' - alert: HighInferencePoolAvgKVCacheUtilization annotations: title: 'High KV cache utilization for inference pool {{ $labels.name }}' description: 'The average KV cache utilization for inference pool {{ $labels.name }} has been consistently above 90% for 5 minutes, indicating potential resource exhaustion.' expr: inference_pool_average_kv_cache_utilization > 0.9 for: 5m labels: severity: 'critical' impact: 'resource_exhaustion'如要建立快訊政策,請執行下列指令:
gcloud monitoring policies migrate --policies-from-prometheus-alert-rules-yaml=alerts.yaml
修改快訊
如要查看最新可用指標的完整清單,請前往 kubernetes-sigs/gateway-api-inference-extension GitHub 存放區,您也可以使用其他指標,將新快訊附加至資訊清單。
如要修改範例快訊,請參考下列範例:
  - alert: HighInferenceRequestLatencyP99
    annotations:
      title: 'High latency (P99) for model {{ $labels.model_name }}'
      description: 'The 99th percentile request duration for model {{ $labels.model_name }} and target model {{ $labels.target_model_name }} has been consistently above 10.0 seconds for 5 minutes.'
    expr: histogram_quantile(0.99, rate(inference_model_request_duration_seconds_bucket[5m])) > 10.0
    for: 5m
    labels:
      severity: 'warning'
如果要求時間的第 99 個百分位數超過 10 秒,這項快訊就會觸發。您可以修改快訊的 expr 部分,根據需求調整門檻。
設定 GKE Inference Gateway 的記錄功能
設定 GKE Inference Gateway 的記錄功能,可提供要求和回應的詳細資訊,有助於進行疑難排解、稽核和效能分析。HTTP 存取記錄會記錄每個要求和回應,包括標頭、狀態碼和時間戳記。這類詳細資料有助於找出問題、發現錯誤,以及瞭解推論工作負載的行為。
如要為 GKE Inference Gateway 設定記錄功能,請為每個 InferencePool 物件啟用 HTTP 存取記錄。
將下列範例資訊清單儲存為
logging-backend-policy.yaml:apiVersion: networking.gke.io/v1 kind: GCPBackendPolicy metadata: name: logging-backend-policy namespace: NAMESPACE_NAME spec: default: logging: enabled: true sampleRate: 500000 targetRef: group: inference.networking.x-k8s.io kind: InferencePool name: INFERENCE_POOL_NAME更改下列內容:
NAMESPACE_NAME:部署InferencePool的命名空間名稱。INFERENCE_POOL_NAME:InferencePool的名稱。
將範例資訊清單套用至叢集:
kubectl apply -f logging-backend-policy.yaml
套用這份資訊清單後,GKE Inference Gateway 會為指定的 InferencePool 啟用 HTTP 存取記錄。您可以在 Cloud Logging 中查看這些記錄。記錄檔包含每項要求和回應的詳細資訊,例如要求網址、標頭、回應狀態碼和延遲時間。
建立記錄指標,查看錯誤詳細資料
您可以使用記錄指標分析負載平衡記錄,並擷取錯誤詳細資料。每個 GKE Gateway 類別 (例如 gke-l7-global-external-managed 和 gke-l7-regional-internal-managed Gateway 類別) 都由不同的負載平衡器支援。詳情請參閱 GatewayClass 功能。
每個負載平衡器都有不同的受監控資源,您建立以記錄為準的指標時必須使用這些資源。如要進一步瞭解各負載平衡器的受監控資源,請參閱下列文章:
- 區域性外部負載平衡器:外部 HTTP(S) 負載平衡器的記錄檔指標
- 內部負載平衡器:內部 HTTP(S) 負載平衡器的記錄指標
如要建立記錄指標來查看錯誤詳細資料,請按照下列步驟操作:
建立名為
error_detail_metric.json的 JSON 檔案,並加入下列LogMetric定義。這項設定會建立指標,從負載平衡器記錄中擷取proxyStatus欄位。{ "description": "Metric to extract error details from load balancer logs.", "filter": "resource.type=\"MONITORED_RESOURCE\"", "metricDescriptor": { "metricKind": "DELTA", "valueType": "INT64", "labels": [ { "key": "error_detail", "valueType": "STRING", "description": "The detailed error string from the load balancer." } ] }, "labelExtractors": { "error_detail": "EXTRACT(jsonPayload.proxyStatus)" } }將
MONITORED_RESOURCE替換為負載平衡器的受監控資源。開啟 Cloud Shell 或已安裝 gcloud CLI 的本機終端機。
如要建立指標,請執行
gcloud logging metrics create指令並加上--config-from-file旗標:gcloud logging metrics create error_detail_metric \ --config-from-file=error_detail_metric.json
建立指標後,您可以在 Cloud Monitoring 中使用該指標,查看負載平衡器回報的錯誤分布情形。詳情請參閱「建立記錄指標」。
如要進一步瞭解如何根據記錄指標建立快訊,請參閱在計數器指標上建立快訊政策。
設定自動調度資源功能
自動調度資源功能會根據負載變化調整資源分配,並依據需求動態新增或移除 Pod,維持效能和資源效率。如果是 GKE Inference Gateway,這項作業會涉及每個 InferencePool 中 Pod 的水平自動調度資源。GKE 水平 Pod 自動配置器 (HPA) 會根據模型伺服器指標 (例如 KVCache Utilization) 自動調度 Pod。這可確保推論服務處理不同工作負載和查詢量時,能有效管理資源用量。
如要設定 InferencePool 執行個體,使其根據 GKE Inference Gateway 產生的指標自動調度資源,請執行下列步驟:
在叢集中部署
PodMonitoring物件,收集 GKE Inference Gateway 產生的指標。詳情請參閱「設定可觀測性」。部署自訂指標 Stackdriver 轉接器,授予 HPA 指標存取權:
將下列範例資訊清單儲存為
adapter_new_resource_model.yaml:apiVersion: v1 kind: Namespace metadata: name: custom-metrics --- apiVersion: v1 kind: ServiceAccount metadata: name: custom-metrics-stackdriver-adapter namespace: custom-metrics --- apiVersion: rbac.authorization.k8s.io/v1 kind: ClusterRoleBinding metadata: name: custom-metrics:system:auth-delegator roleRef: apiGroup: rbac.authorization.k8s.io kind: ClusterRole name: system:auth-delegator subjects: - kind: ServiceAccount name: custom-metrics-stackdriver-adapter namespace: custom-metrics --- apiVersion: rbac.authorization.k8s.io/v1 kind: RoleBinding metadata: name: custom-metrics-auth-reader namespace: kube-system roleRef: apiGroup: rbac.authorization.k8s.io kind: Role name: extension-apiserver-authentication-reader subjects: - kind: ServiceAccount name: custom-metrics-stackdriver-adapter namespace: custom-metrics --- apiVersion: rbac.authorization.k8s.io/v1 kind: ClusterRole metadata: name: custom-metrics-resource-reader rules: - apiGroups: - "" resources: - pods - nodes - nodes/stats verbs: - get - list - watch --- apiVersion: rbac.authorization.k8s.io/v1 kind: ClusterRoleBinding metadata: name: custom-metrics-resource-reader roleRef: apiGroup: rbac.authorization.k8s.io kind: ClusterRole name: custom-metrics-resource-reader subjects: - kind: ServiceAccount name: custom-metrics-stackdriver-adapter namespace: custom-metrics --- apiVersion: apps/v1 kind: Deployment metadata: name: custom-metrics-stackdriver-adapter labels: run: custom-metrics-stackdriver-adapter k8s-app: custom-metrics-stackdriver-adapter spec: replicas: 1 selector: matchLabels: run: custom-metrics-stackdriver-adapter k8s-app: custom-metrics-stackdriver-adapter template: metadata: labels: run: custom-metrics-stackdriver-adapter k8s-app: custom-metrics-stackdriver-adapter kubernetes.io/cluster-service: "true" spec: serviceAccountName: custom-metrics-stackdriver-adapter containers: - image: gcr.io/gke-release/custom-metrics-stackdriver-adapter:v0.15.2-gke.1 imagePullPolicy: Always name: pod-custom-metrics-stackdriver-adapter command: - /adapter - --use-new-resource-model=true - --fallback-for-container-metrics=true resources: limits: cpu: 250m memory: 200Mi requests: cpu: 250m memory: 200Mi --- apiVersion: v1 kind: Service metadata: labels: run: custom-metrics-stackdriver-adapter k8s-app: custom-metrics-stackdriver-adapter kubernetes.io/cluster-service: 'true' kubernetes.io/name: Adapter name: custom-metrics-stackdriver-adapter namespace: custom-metrics spec: ports: - port: 443 protocol: TCP targetPort: 443 selector: run: custom-metrics-stackdriver-adapter k8s-app: custom-metrics-stackdriver-adapter type: ClusterIP --- apiVersion: apiregistration.k8s.io/v1 kind: APIService metadata: name: v1beta1.custom.metrics.k8s.io spec: insecureSkipTLSVerify: true group: custom.metrics.k8s.io groupPriorityMinimum: 100 versionPriority: 100 service: name: custom-metrics-stackdriver-adapter namespace: custom-metrics version: v1beta1 --- apiVersion: apiregistration.k8s.io/v1 kind: APIService metadata: name: v1beta2.custom.metrics.k8s.io spec: insecureSkipTLSVerify: true group: custom.metrics.k8s.io groupPriorityMinimum: 100 versionPriority: 200 service: name: custom-metrics-stackdriver-adapter namespace: custom-metrics version: v1beta2 --- apiVersion: apiregistration.k8s.io/v1 kind: APIService metadata: name: v1beta1.external.metrics.k8s.io spec: insecureSkipTLSVerify: true group: external.metrics.k8s.io groupPriorityMinimum: 100 versionPriority: 100 service: name: custom-metrics-stackdriver-adapter namespace: custom-metrics version: v1beta1 --- apiVersion: rbac.authorization.k8s.io/v1 kind: ClusterRole metadata: name: external-metrics-reader rules: - apiGroups: - "external.metrics.k8s.io" resources: - "*" verbs: - list - get - watch --- apiVersion: rbac.authorization.k8s.io/v1 kind: ClusterRoleBinding metadata: name: external-metrics-reader roleRef: apiGroup: rbac.authorization.k8s.io kind: ClusterRole name: external-metrics-reader subjects: - kind: ServiceAccount name: horizontal-pod-autoscaler namespace: kube-system將範例資訊清單套用至叢集:
kubectl apply -f adapter_new_resource_model.yaml
如要授予介面卡權限,從專案讀取指標,請執行下列指令:
$ PROJECT_ID=PROJECT_ID
$ PROJECT_NUMBER=$(gcloud projects describe PROJECT_ID --format="value(projectNumber)")
$ gcloud projects add-iam-policy-binding projects/PROJECT_ID \
  --role roles/monitoring.viewer \
  --member=principal://iam.googleapis.com/projects/PROJECT_NUMBER/locations/global/workloadIdentityPools/$PROJECT_ID.svc.id.goog/subject/ns/custom-metrics/sa/custom-metrics-stackdriver-adapter
將
PROJECT_ID替換為專案 ID。 Google Cloud針對每個
InferencePool,部署類似下列的 HPA:apiVersion: autoscaling/v2 kind: HorizontalPodAutoscaler metadata: name: INFERENCE_POOL_NAME namespace: INFERENCE_POOL_NAMESPACE spec: scaleTargetRef: apiVersion: apps/v1 kind: Deployment name: INFERENCE_POOL_NAME minReplicas: MIN_REPLICAS maxReplicas: MAX_REPLICAS metrics: - type: External external: metric: name: prometheus.googleapis.com|inference_pool_average_kv_cache_utilization|gauge selector: matchLabels: metric.labels.name: INFERENCE_POOL_NAME resource.labels.cluster: CLUSTER_NAME resource.labels.namespace: INFERENCE_POOL_NAMESPACE target: type: AverageValue averageValue: TARGET_VALUE更改下列內容:
INFERENCE_POOL_NAME:InferencePool的名稱。INFERENCE_POOL_NAMESPACE:InferencePool的命名空間。CLUSTER_NAME:叢集名稱。MIN_REPLICAS:最低可用性 (基準容量)。InferencePool當用量低於 HPA 目標門檻時,HPA 會維持這個備用資源數量。高可用性工作負載必須將此值設為高於1的值,確保 Pod 中斷期間的持續可用性。MAX_REPLICAS:這個值會限制必須指派給InferencePool中託管工作負載的加速器數量。HPA 不會將備用資源數量增加到超過這個值。在流量高峰期間,請監控副本數量,確保MAX_REPLICAS欄位的值提供足夠的空間,讓工作負載能夠擴充,維持所選工作負載的效能特徵。TARGET_VALUE:代表每個模型伺服器所選目標的值。KV-Cache Utilization這是介於 0 到 100 之間的數字,且高度取決於模型伺服器、模型、加速器和傳入流量特徵。您可以透過負載測試和繪製輸送量與延遲時間的圖表,實驗性地判斷這個目標值。從圖表中選取所選的輸送量和延遲時間組合,並使用對應的KV-Cache Utilization值做為 HPA 目標。您必須調整並密切監控這個值,才能達到所選的價格與成效結果。您可以使用 GKE Inference Quickstart 自動判斷這個值。
後續步驟
- 瞭解 GKE Inference Gateway。
- 部署 GKE Inference Gateway。
- 管理 GKE Inference Gateway 推出作業。
- 使用 GKE Inference Gateway 進行服務。