
Analyze usage insights
This page describes how to use the usage insights to analyze your billable usage for specific databases. You can break down this data by dimensions such as collections, collection groups, or namespaces (specific to Datastore mode) over a custom time period. The usage insights metrics displayed vary based on the edition or mode:
| Edition | Metrics |
| Standard |
|
| Enterprise |
|
Usage insights overview
Use the usage insights dashboard to monitor usage for specific databases. This dashboard helps you with:
- Monitor granular usage: Track your billable operations broken down by
dimensions like
collection,collectionGroup, ornamespace. - Optimize costs: Identify high-billed usage to determine where you can optimize data structures or queries and lower your overall bill.
- Track historical trends: Monitor how your billable usage statistics change over specific timeframes.
Required roles
To get the permission that you need to view the usage insights dashboard, ask your administrator to grant you the Datastore Viewer
(roles/datastore.viewer) IAM role on your project.
This predefined role contains the datastore.insights.get permission, which is
required to view the usage insights dashboard.
You might also be able to get this permission with custom roles or other predefined roles.
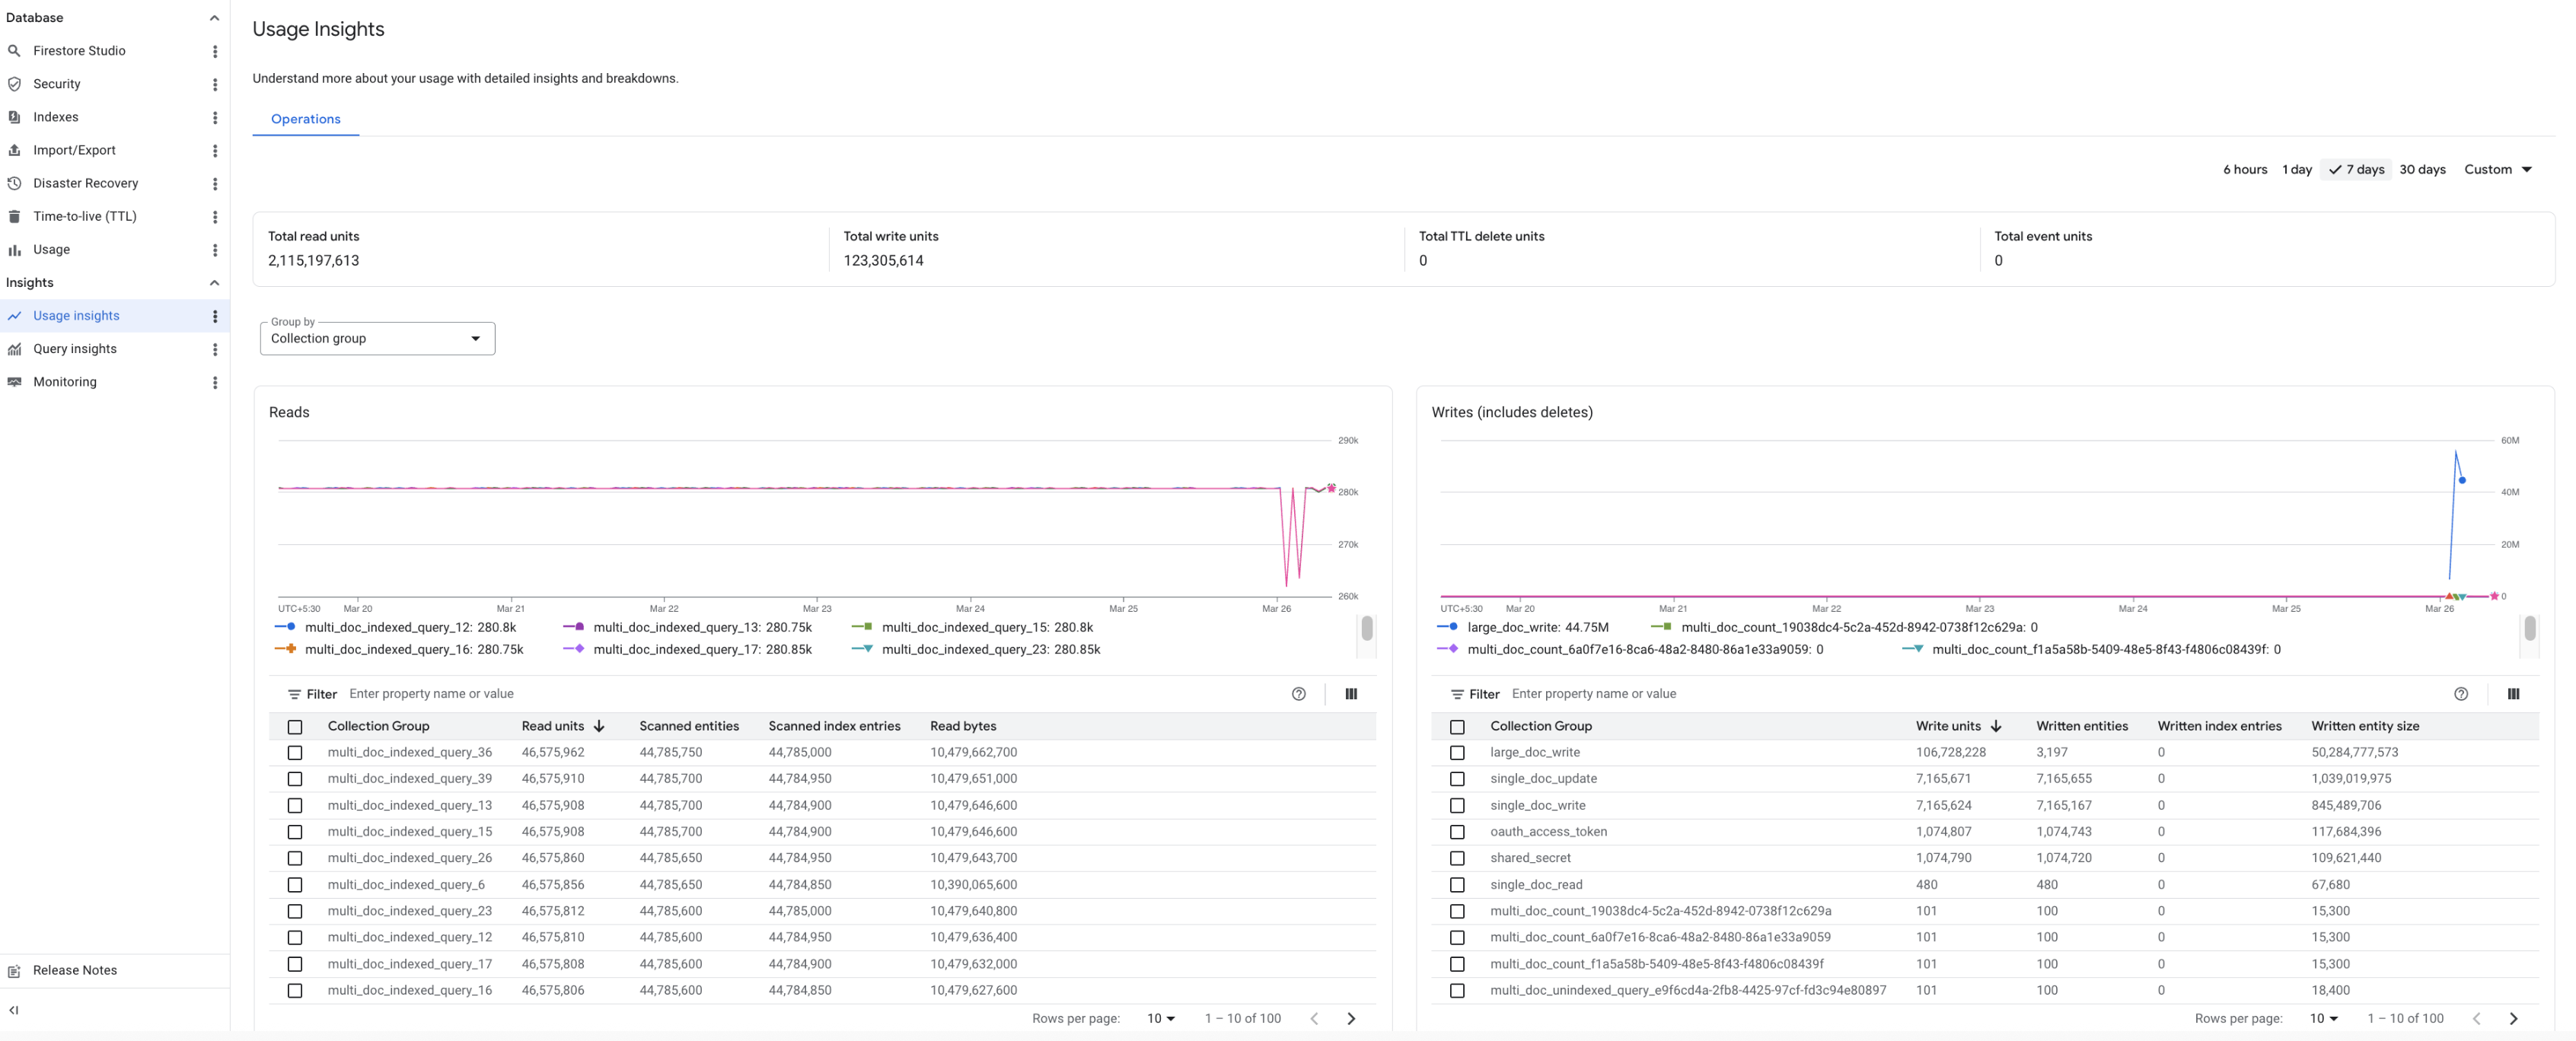
Usage insights dashboard
The Usage insights dashboard is organized into two primary sections:
- Total Usage: Displays aggregated metrics (Reads, Writes, TTL Deletes) for the entire database.
- GroupBy Usage: Shows metrics broken down by the top 100 dimensions and is grouped by collection, collection group, or namespaces.
Total Usage and GroupBy metrics
It is important to note that the sum of metrics in the GroupBy section might not match the metric displayed in the Total Usage section. This variance is expected due to the following factors:
- GroupBy Limits (Top 100): The GroupBy section is restricted to itemizing usage for only the top 100 collections, collection groups, or namespaces. Usage generated by less active dimensions contributes to the Total Usage figure but is not individually listed in the GroupBy usage metrics.
- Sampling for Wide Operations: For requests impacting a large number of
collections (for example, joins across multiple collections,
ListCollectionIds,ListDocuments, kindless queries), usage insights may sample collections, prioritizing those with the highest usage. As a result, not all affected collections are included in the GroupBy usage metrics. Reserved Names: Firestore with MongoDB compatibility reserves names prefixed with double underscores (__*__) for internal metadata. Usage related to these reserved names contributes to total usage but is not included in the GroupBy usage metrics.
GroupBy dimensions
The GroupBy section organizes usage metrics based on dimensions determined by the enabled APIs:
- Collection: Available when the Firestore with MongoDB compatibility API is enabled.
For example, a database primarily using the Firestore MongoDB compatibility operations will default to Collection for its usage breakdown.
Usage insights data
Usage insights on the Google Cloud console displays data sourced from the following API methods:
queryTopAggregatedInsightsDataqueryTopTimeseriesInsightsData
Field name Details Collection Name
CollectionGroup NameThe value corresponding to the usage dimension for which the usage data is aggregated. This could be a collection name or collection group name Total Read Operations Total number of read operations. Applicable only to Standard edition. Total Write Operations Total number of write operations. Includes Delete operations as well. Applicable only to Standard edition. Total TTL Delete Operations Total number of TTL Delete operations. Applicable only to Standard edition. Total Read Units Total number of tranched read units (4KiB tranches). Applicable only to Enterprise edition. Total Write Units Total number of tranched write units (1KiB tranches). Includes Delete units as well. Applicable only to Enterprise edition. Total TTL Delete or Managed Delete units Total number of TTL Delete or Managed Delete units. Applicable only to Enterprise edition. Total Eventarc units Total number of Eventarc units. Applicable only to Enterprise edition. Total Read Bytes Total number of bytes scanned. Total Scanned Documents Count Total number of documents scanned. Total Scanned Index Entries Count Total number of index entries scanned. Total Written Documents Count Total number of documents written. Total Written Index Entries Count Total number of index entries written. Total Sum of Document Size written Total document write size in bytes. Limitations
- Streaming queries that contribute to billable reads and writes are not tracked as part of the API response.
- Usage insights for Admin operations (that contribute to billable reads and writes) like import/export, bulk delete, restore, clone, and index builds in Enterprise edition are not supported.
- Network egress and storage billing are not supported.
Pricing
There's no additional cost for usage insights.
View usage insights
To view usage insights for a Firestore with MongoDB compatibility database, open the database's Usage Insights pane in the Google Cloud console.
In the Google Cloud console, go to the Databases page.
From the list of databases, select a database.
In the navigation menu, click Usage Insights.
Use the Group By drop-down to view usage insights for a collection, collectionGroup, or namespace. You can view usage insights data up to the last 45 days.