

Analyze query execution with Query Explain
This page describes how to retrieve query execution information when you execute a query.
Use Query Explain
You can use Query Explain to understand how your queries are being executed. This provides details that you can use to optimize your queries.
You can use Query Explain through the Google Cloud console or the explain command.
Console
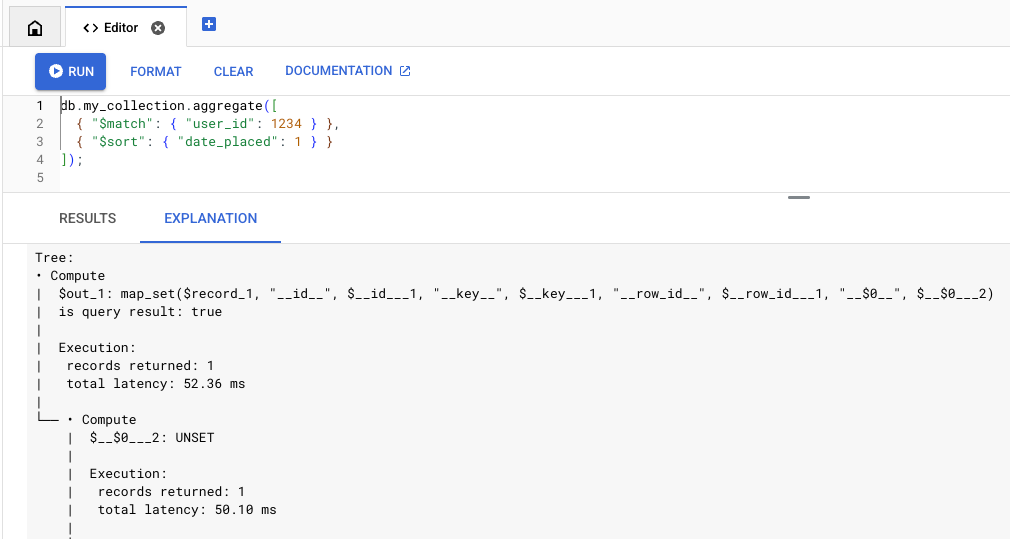
Execute a query in the Query Editor and open the Explanation tab:
-
In the Google Cloud console, go to the Databases page.
- From the list of databases, select a Firestore with MongoDB compatibility database. The Google Cloud console opens the Firestore Explorer for that database.
- Enter a query in the query editor and click Run.
-
Click the Explanation tab to view the query analysis output.
MongoDB API
Query Explain in the MongoDB API is supported through the
explain
command which you can use in tools such as Mongo Shell and Compass.
The explain command is supported with the aggregate,
find, distinct, and count
commands, for example:
db.collection.explain('executionStats').find(...)
You can also use the explain() method, for example:
db.collection.find({QUERY}).explain('executionStats')Limitations
Note the following limitations and differences:-
Query Explain does not support commands which return a cursor. For example, invoking explain by calling the following command directly is not supported:
db.collection.aggregate(..., explain: true)
Query Explain is only supported on the
find,aggregate,count,distinct,update,delete, andfindAndModifycommands.-
Query Explain supports the
executionStats,allPlansExecutionandqueryPlannerverbosity modes.queryPlanner: Returns the execution plan only, without executing the query,executionStatsandallPlansExecution: Returns the execution plan along with billing, memory, and execution statistics.
If no verbosity mode is specified, the shell defaults to
queryPlanner. To see the full execution statistics, you must specify theexecutionStatsorallPlansExecutionverbosity mode.
Analysis
The output of Query Explain contains two main components-the Summary Statistics and Execution Tree. Consider this query as an example:
db.orders.aggregate(
 [
   { "$match": { "user_id": 1234 } },
   { "$sort": { "date_placed": 1 } }
 ]
)
Summary Statistics
The top of the explained output contains a summary of the execution statistics. Use these statistics to determine if a query has high latency or cost. It also contains memory statistics which let you know how close your query is to memory limits.
Execution:
 results returned: 35
 query id: 7e7b37ea1a259d79
 request peak memory usage: 45.56 KiB (46,656 B)
 data bytes read: 24.58 KiB (25,175 B)
 entity row scanned: 265

Billing:
 read units: 7
Execution Tree
The execution tree describes the query execution as a series of nodes. The bottom nodes (leaf nodes) retrieve data from the storage layer which traverses up the tree to generate a query response.
For details about each execution node, refer to the Execution reference.
For details on how to use this information to optimize your queries, see Optimize query execution.
The following is an example of an execution tree:
Execution:
 results returned: 35
 query id: 7e7b37ea1a259d79
 request peak memory usage: 45.56 KiB (46,656 B)
 data bytes read: 24.58 KiB (25,175 B)
 entity row scanned: 265

Billing:
 read units: 7

Tree:
• Compute
|  $out_1: map_set($record_1, "__id__", $__id___1, "__key__", unset)
|  is query result: true
|
|  Execution:
|   records returned: 35
|   latency: 204.87 ms (local 7.64 ms)
|
└── • Compute
    |  $__id___1: _id($__key___2)
    |
    |  Execution:
    |   records returned: 35
    |   latency: 197.23 ms (local 2.04 ms)
    |
    └── • MajorSort
        |  fields: [$v_5 ASC]
        |  output: [$__key___2, $record_1]
        |
        |  Execution:
        |   records returned: 35
        |   latency: 195.20 ms (local 28.42 ms)
        |   peak memory usage: 45.56 KiB (46,656 B)
        |
        └── • Compute
            |  $v_5: offset($v_4, 0L)
            |
            |  Execution:
            |   records returned: 35
            |   latency: 166.78 ms (local 14.84 ms)
            |
            └── • Compute
                |  $v_4: sortPaths(array($date_placed_1), [date_placed ASC])
                |
                |  Execution:
                |   records returned: 35
                |   latency: 151.94 ms (local 5.43 ms)
                |
                └── • TableScan
                       source: **/orders
                       order: STABLE
                       filter: $eq($user_id_1, 1,234)
                       output bindings: {$__key___2=row().__key__, $date_placed_1=row().date_placed, $record_1=row[* - { __create_time__, __update_time__ }](), $user_id_1=row().user_id}
                       output: [$__key___2, $date_placed_1, $record_1]

                       Execution:
                        records returned: 35
                        latency: 146.50 ms
                        data bytes returned: 3.25 KiB (3,325 B)
                        post-filtered rows: 230
                        records scanned: 265
                        data bytes read: 24.58 KiB (25,175 B)
What's next
- To learn about the execution tree nodes, see the Query execution reference.
- To learn how to optimize your queries, see Optimize query execution.