


Query Explain을 사용하여 쿼리 실행 분석
이 페이지에서는 쿼리를 실행할 때 쿼리 실행 정보를 가져오는 방법을 설명합니다.
Query Explain 사용
Query Explain을 사용하여 쿼리가 실행되는 방식을 파악할 수 있습니다. 이를 통해 쿼리를 최적화하는 데 사용할 수 있는 세부정보가 제공됩니다.
Google Cloud 콘솔 또는 explain 명령어를 통해 Query Explain을 사용할 수 있습니다.
콘솔
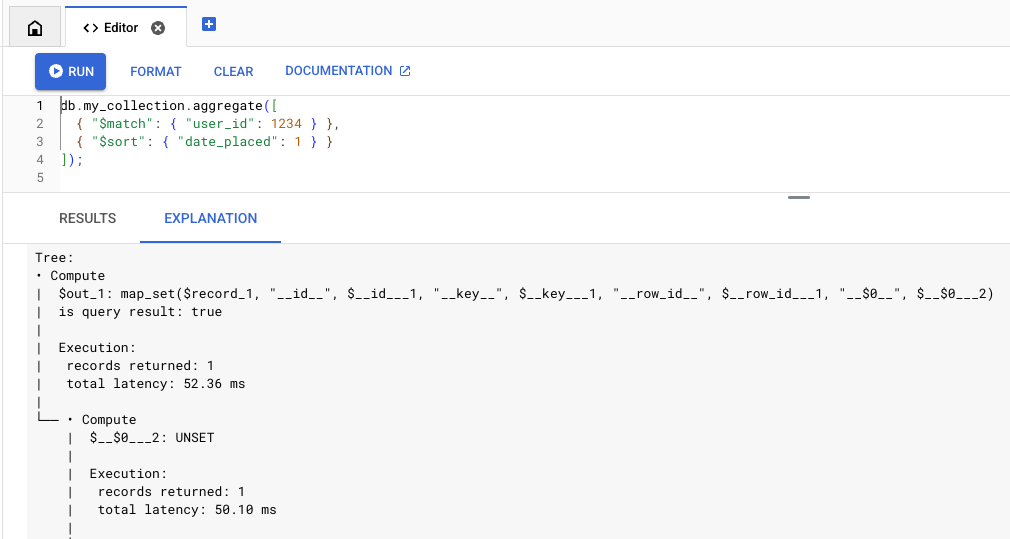
쿼리 편집기에서 쿼리를 실행하고 설명 탭을 엽니다.
-
Google Cloud 콘솔에서 데이터베이스 페이지로 이동합니다.
- 데이터베이스 목록에서 MongoDB 호환성을 갖춘 Firestore 데이터베이스를 선택합니다. Google Cloud 콘솔에서 해당 데이터베이스의 Firestore 탐색기가 열립니다.
- 쿼리 편집기에 쿼리를 입력하고 실행을 클릭합니다.
-
설명 탭을 클릭하여 쿼리 분석 출력을 확인합니다.
MongoDB API
MongoDB API의 Query Explain은 Mongo Shell 및 Compass와 같은 도구에서 사용할 수 있는 explain 명령어를 통해 지원됩니다.
explain 명령어는 aggregate, find, distinct, count 명령어와 함께 지원됩니다. 예를 들면 다음과 같습니다.
db.collection.explain('executionStats').find(...)
explain() 메서드를 사용할 수도 있습니다. 예를 들면 다음과 같습니다.
db.collection.find({QUERY}).explain('executionStats')제한사항
다음 제한사항과 차이점에 유의하세요.-
Query Explain은 커서를 반환하는 명령어를 지원하지 않습니다. 예를 들어 다음 명령어를 직접 호출하여 explain을 호출하는 것은 지원되지 않습니다.
db.collection.aggregate(..., explain: true)
Query Explain은
find,aggregate,count,distinct,update,delete,findAndModify명령어에서만 지원됩니다.-
Query Explain은
executionStats,allPlansExecution,queryPlanner상세 모드를 지원합니다.queryPlanner: 쿼리를 실행하지 않고 실행 계획만 반환합니다.executionStats및allPlansExecution: 청구, 메모리, 실행 통계와 함께 실행 계획을 반환합니다.
상세 모드가 지정되지 않으면 셸은 기본적으로
queryPlanner로 설정됩니다. 전체 실행 통계를 보려면executionStats또는allPlansExecution상세 모드를 지정해야 합니다.
분석
Query Explain의 출력에는 요약 통계와 실행 트리라는 두 가지 주요 구성요소가 포함됩니다. 다음 쿼리를 예로 들어보겠습니다.
db.orders.aggregate(
 [
   { "$match": { "user_id": 1234 } },
   { "$sort": { "date_placed": 1 } }
 ]
)
요약 통계
설명된 출력의 상단에는 실행 통계 요약이 포함되어 있습니다. 이러한 통계를 사용하여 쿼리의 지연 시간 또는 비용이 높은지 확인할 수 있습니다. 또한 쿼리가 메모리 한도에 얼마나 근접했는지 알 수 있는 메모리 통계도 포함되어 있습니다.
Execution:
 results returned: 35
 query id: 7e7b37ea1a259d79
 request peak memory usage: 45.56 KiB (46,656 B)
 data bytes read: 24.58 KiB (25,175 B)
 entity row scanned: 265

Billing:
 read units: 7
실행 트리
실행 트리는 쿼리 실행을 일련의 노드로 설명합니다. 하단 노드(리프 노드)는 스토리지 레이어에서 데이터를 가져오고, 이 데이터는 트리를 따라 올라가 쿼리 응답을 생성합니다.
각 실행 노드에 대한 자세한 내용은 실행 참조를 참조하세요.
이 정보를 사용하여 쿼리를 최적화하는 방법에 대한 자세한 내용은 쿼리 실행 최적화를 참조하세요.
다음은 실행 트리의 예입니다.
Execution:
 results returned: 35
 query id: 7e7b37ea1a259d79
 request peak memory usage: 45.56 KiB (46,656 B)
 data bytes read: 24.58 KiB (25,175 B)
 entity row scanned: 265

Billing:
 read units: 7

Tree:
• Compute
|  $out_1: map_set($record_1, "__id__", $__id___1, "__key__", unset)
|  is query result: true
|
|  Execution:
|   records returned: 35
|   latency: 204.87 ms (local 7.64 ms)
|
└── • Compute
    |  $__id___1: _id($__key___2)
    |
    |  Execution:
    |   records returned: 35
    |   latency: 197.23 ms (local 2.04 ms)
    |
    └── • MajorSort
        |  fields: [$v_5 ASC]
        |  output: [$__key___2, $record_1]
        |
        |  Execution:
        |   records returned: 35
        |   latency: 195.20 ms (local 28.42 ms)
        |   peak memory usage: 45.56 KiB (46,656 B)
        |
        └── • Compute
            |  $v_5: offset($v_4, 0L)
            |
            |  Execution:
            |   records returned: 35
            |   latency: 166.78 ms (local 14.84 ms)
            |
            └── • Compute
                |  $v_4: sortPaths(array($date_placed_1), [date_placed ASC])
                |
                |  Execution:
                |   records returned: 35
                |   latency: 151.94 ms (local 5.43 ms)
                |
                └── • TableScan
                       source: **/orders
                       order: STABLE
                       filter: $eq($user_id_1, 1,234)
                       output bindings: {$__key___2=row().__key__, $date_placed_1=row().date_placed, $record_1=row[* - { __create_time__, __update_time__ }](), $user_id_1=row().user_id}
                       output: [$__key___2, $date_placed_1, $record_1]

                       Execution:
                        records returned: 35
                        latency: 146.50 ms
                        data bytes returned: 3.25 KiB (3,325 B)
                        post-filtered rows: 230
                        records scanned: 265
                        data bytes read: 24.58 KiB (25,175 B)