
在 Bigtable 中使用地理空间数据
本页面介绍了如何使用 GoogleSQL 地理函数在 Bigtable 中存储和查询地理空间数据。地理空间数据包括地球表面的几何表示形式,以点、线和多边形的形式呈现。您可以将这些实体分组到集合中,以跟踪位置、路线或其他感兴趣的区域。
基本操作
借助专用的 GoogleSQL 地理函数,Bigtable 可以针对地理空间计算和查询时间优化数据库性能。在基本使用示例中,我们使用了一个名为
tourist_points_of_interest 的表,其中包含一个名为 poi_data 的列族。
| poi_data | |||
|---|---|---|---|
| 行键 | name | location | |
| p1 | 埃菲尔铁塔 | POINT(2.2945 48.8584) |
写入地理位置数据
如需将地理空间数据写入 Bigtable 列,您需要以 GeoJSON 或 Well-Known Text (WKT) 格式提供地理位置实体的字符串表示形式。Bigtable 会将底层数据存储为原始字节,因此您可以提供
任何实体组合(例如 Points,
LineStrings, Polygons, MultiPoints, MultiLineStrings, 或 MultiPolygons)。
您提供的地理空间实体的类型在查询时非常重要,因为您需要
使用适当的地理函数来解读数据。
例如,如需向 tourist_points_of_interest 表中添加一些景点,
您可以使用 cbt CLI 工具,如下所示:
- 使用 WKT:
cbt set tourist_points_of_interest p2 poi_data:name='Louvre Museum'
cbt set tourist_points_of_interest p2 poi_data:location='POINT(2.3376 48.8611)'

cbt set tourist_points_of_interest p3 poi_data:name='Place Charles de Gaulle'
cbt set tourist_points_of_interest p3 poi_data:location='POLYGON(2.2941 48.8733, 2.2941 48.8742, 2.2957 48.8742, 2.2958 48.8732, 2.2941 48.8733)'
- 使用 GeoJSON:
cbt set tourist_points_of_interest p2 poi_data:name='Louvre Museum'
cbt set tourist_points_of_interest p2 poi_data:location='{"type": "Point", "coordinates": [2.3376, 48.8611]}'

cbt set tourist_points_of_interest p3 poi_data:name='Place Charles de Gaulle'
cbt set tourist_points_of_interest p3 poi_data:location='{"type": "Polygon", "coordinates": [[ [2.2941, 48.8733], [2.2941, 48.8742], [2.2957, 48.8742], [2.2958, 48.8732], [2.2941, 48.8733] ]] }'
查询地理位置数据
您可以在 Bigtable Studio 中使用 GoogleSQL 查询 tourist_points_of_interest 表,并使用地理函数过滤结果。例如,如需查找距离特罗卡德罗广场 1500 米内的所有旅游景点,
您可以使用
ST_DWITHIN
函数:
SELECT _key, poi_data['name'], poi_data['location']
FROM points_of_interest
WHERE ST_DWITHIN(CAST(poi_data['location'] AS STRING), ST_GEOGPOINT(2.2874, 48.86322), 1500);
结果将类似于以下内容:
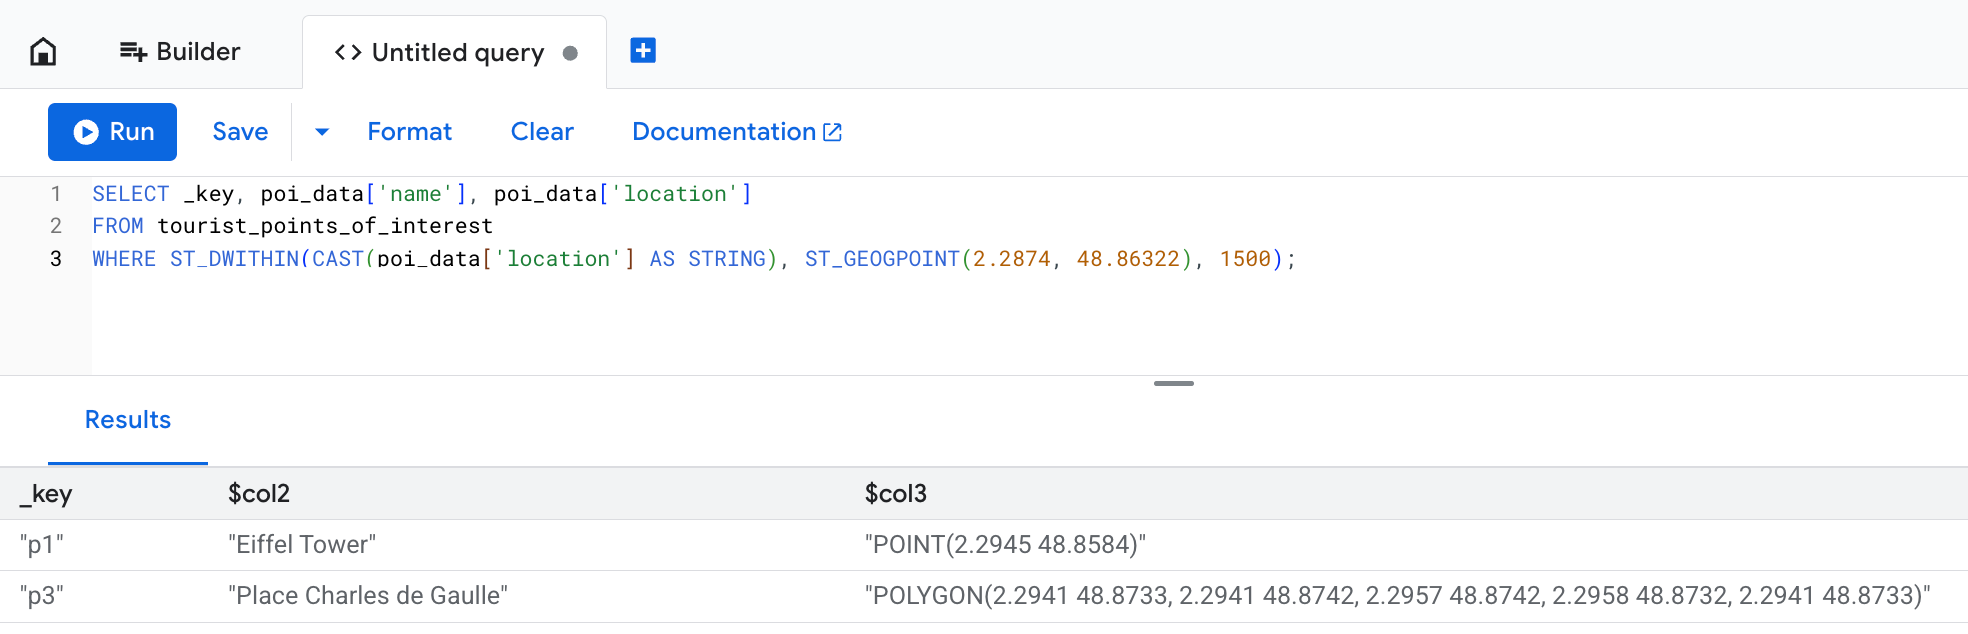
location 列显示了写入操作中提供的原始文本数据表示形式,但 Bigtable 会将其存储为字节。在此示例中,即使
Place Charles de Gaulle 被定义为超出 1500 米限制的多边形,它也会包含在查询结果中。 这是因为,如果地理空间实体中包含的任何点位于预期距离内,ST_DWITHIN
函数都会返回 true。
高级用法
以下部分介绍了如何在地理围栏分析等复杂场景中使用地理函数。查询优化 部分介绍了如何使用连续的物化视图来提高性能。
为了说明 Bigtable 中地理函数的高级用法, 我们假设您是一位研究员,正在监测 居住在 雪山岛南侧的帝企鹅的行为。
您的设备为每只企鹅提供了数百个位置 ping,因此您创建了 penguin_movements 表来存储这些 ping:
| penguin_details | |||
|---|---|---|---|
| 行键 | penguin_id | 时间戳 | location |
| ping#123 | pen_01 | 2025-12-06 08:15:22+00 | POINT(-57.51 -64.42) |
| ping#124 | pen_01 | 2025-12-06 10:22:05+00 | POINT(-57.55 -64.43) |
| ping#125 | pen_01 | 2025-12-07 12:35:45+00 | POINT(-57.58 -64.41) |
| ping#126 | pen_02 | 2025-12-12 06:05:11+00 | POINT(-57.49 -64.39) |
示例:查找越过地理围栏的人
在研究过程中,您观察到企鹅在特定觅食地周围的行为。使用虚拟边界定义的区域通常称为地理围栏。 觅食地可以被视为地理围栏区域。
您想了解是否有企鹅在 2025 年 12 月 3 日访问过觅食地。如需回答此问题,您可以使用
ST_CONTAINS
函数,如下所示:
SELECT
  penguin_details['penguin_id'],
  penguin_details['location'],
  penguin_details['timestamp']
FROM
  penguin_movements
WHERE
  penguin_details['timestamp'] >= '2025-12-03 00:00:00 UTC'
  AND penguin_details['timestamp'] < '2025-12-04 00:00:00 UTC'
  -- The feeding ground boundary is defined with a WKT POLYGON entity
  -- Polygon's last point must be equal to its first point to close the loop
  AND ST_CONTAINS(
        ST_GEOGFROMTEXT('POLYGON((-57.21 -64.51, -57.23 -64.55, -57.08 -64.56, -57.06 -64.51, -57.21 -64.51))'),
        ST_GEOGFROMTEXT(CAST(penguin_details['location'] AS STRING))
      )
您会获得类似于以下内容的结果:
+------------+----------------------+------------------------+
| penguin_id |       location       |       timestamp        |
+------------+----------------------+------------------------+
| pen_01     | POINT(-57.15 -64.53) | 2025-12-03 08:15:22+00 |
| pen_02     | POINT(-57.18 -64.54) | 2025-12-03 14:30:05+00 |
| pen_10     | POINT(-57.10 -64.52) | 2025-12-03 11:45:10+00 |
+------------+----------------------+------------------------+
示例:将点转换为路线
为了更好地直观呈现企鹅的行进方式,您决定使用各个位置 ping 整理为 LineStrings,如下所示:ST_MAKELINE
SELECT
  penguin_id,
  DATE(timestamp, 'UTC') AS route_date,
  ST_MAKELINE(ARRAY_AGG(location_cast_to_geog)) AS route
FROM (
  -- Sub-expression to sort all location pings by timestamp
  -- This way you make sure individual points can form a realistic route
  SELECT
    penguin_details['penguin_id'] AS penguin_id,
    -- Extract and cast timestamp once
    CAST(CAST(penguin_details['timestamp'] AS STRING) AS TIMESTAMP) AS timestamp,
    -- Extract and cast location once
    ST_GEOGFROMTEXT(CAST(penguin_details['location'] AS STRING)) AS location_cast_to_geog
  FROM
    penguin_movements
  ORDER BY
    -- Pre-sorts location pings for the ARRAY_AGG function
    penguin_id, timestamp ASC
)
GROUP BY
  penguin_id,
  route_date
借助此查询,您可以获得更高级的研究分析洞见。展开即可下部分,查看示例查询和结果。
每只企鹅的每日行进距离是多少?
如需计算每只企鹅每天行进的距离,您可以使用
ST_LENGTH 函数。
SELECT
  penguin_id,
  route_date,
  ST_LENGTH(route) AS daily_distance_meters
FROM (
  -- Subquery to aggregate points into daily routes
  SELECT
    penguin_id,
    DATE(timestamp, 'UTC') AS route_date,
    ST_MAKELINE(ARRAY_AGG(location_cast_to_geog)) AS route
  FROM (
    -- Sub-expression to sort all location pings by timestamp
    -- This way you make sure individual points can form a realistic route
    SELECT
      penguin_details['penguin_id'] AS penguin_id,
      -- Extract and cast timestamp once
      CAST(CAST(penguin_details['timestamp'] AS STRING) AS TIMESTAMP) AS timestamp,
      -- Extract and cast location once
      ST_GEOGFROMTEXT(CAST(penguin_details['location'] AS STRING)) AS location_cast_to_geog
    FROM
      penguin_movements
    ORDER BY
      -- Pre-sorts location pings for the ARRAY_AGG function
      penguin_id, timestamp ASC
  )
  GROUP BY
    penguin_id,
    route_date
) AS DailyRoutes;
此查询会返回类似于以下内容的结果:
+------------+------------+-----------------------+
| penguin_id | route_date | daily_distance_meters |
+------------+------------+-----------------------+
| pen_01     | 2025-12-02 | 15420.7               |
| pen_03     | 2025-12-03 | 22105.1               |
| pen_32     | 2025-12-03 | 9850.3                |
+------------+------------+-----------------------+
每日路线中有多少位于地理围栏区域内?
如需回答此问题,您可以使用 ST_INTERSECTION
函数过滤结果,以检查企鹅路线的哪些部分与地理围栏区域相交。
然后,ST_LENGTH函数可以帮助计算觅食地内的移动距离与当天行进的总距离的比率。
SELECT
  penguin_id,
  route_date,
  ST_LENGTH(ST_INTERSECTION(route, ST_GEOGFROMTEXT('POLYGON((-57.21 -64.51, -57.23 -64.55, -57.08 -64.56, -57.06 -64.51, -57.21 -64.51))'))) / ST_LENGTH(route) AS proportion_in_ground
FROM (
  -- Subquery to aggregate points into daily routes
  SELECT
    penguin_id,
    DATE(timestamp, 'UTC') AS route_date,
    ST_MAKELINE(ARRAY_AGG(location_cast_to_geog)) AS route
  FROM (
    -- Sub-expression to sort all location pings by timestamp
    -- This way you make sure individual points can form a realistic route
    SELECT
      penguin_details['penguin_id'] AS penguin_id,
      -- Extract and cast timestamp once
      CAST(CAST(penguin_details['timestamp'] AS STRING) AS TIMESTAMP) AS timestamp,
      -- Extract and cast location once
      ST_GEOGFROMTEXT(CAST(penguin_details['location'] AS STRING)) AS location_cast_to_geog
    FROM
      penguin_movements
    ORDER BY
      -- Pre-sorts location pings for the ARRAY_AGG function
      penguin_id, timestamp ASC
  )
  GROUP BY
    penguin_id,
    route_date
) AS DailyRoutes
WHERE
  ST_INTERSECTS(route, ST_GEOGFROMTEXT('POLYGON((-57.21 -64.51, -57.23 -64.55, -57.08 -64.56, -57.06 -64.51, -57.21 -64.51))'))
此查询会返回类似于以下内容的结果:
+------------+------------+----------------------+
| penguin_id | route_date | proportion_in_ground |
+------------+------------+----------------------+
| pen_01     | 2025-12-03 | 0.652                |
| pen_03     | 2025-12-03 | 0.918                |
| pen_32     | 2025-12-04 | 0.231                |
+------------+------------+----------------------+
使用连续的物化视图优化查询
对大型数据集执行地理空间查询可能会很慢,因为它们可能需要扫描许多行。Bigtable 不支持专用的地理空间 索引,但您可以使用 连续的物化视图来提高查询性能。
如需为此类视图创建唯一的行键,您可以将 GEOGRAPHY
类型转换为一个 S2 单元格。
S2
是一个库,可让您对球体几何图形执行复杂的三角函数运算。
根据地理坐标计算距离的计算成本可能很高。S2
单元格可以将地球表面上的特定区域表示为 64 位整数,因此非常适合使用连续的物化视图进行地理空间索引。
如需定义 S2 单元格,您可以调用
S2_CELLIDFROMPOINT(location, level)
函数并提供粒度 level 实参。此实参是介于 0 和 30 之间的
数字,用于定义每个单元格的大小:
数字越大,单元格越小。
在企鹅研究示例中,您可以 创建一个连续的物化视图 ,该视图按每只企鹅的位置和时间戳编制索引:
-- Query used to create the continuous materialized view
SELECT
  -- Create S2 cells for each penguin's location.
  -- Note that the `level` value is the same for each location so that
  -- every cell is the same size. This ensures consistency for your data.
  S2_CELLIDFROMPOINT(ST_GEOGFROMTEXT(CAST(penguin_details['location'] AS STRING)), level => 16) AS s2_cell_id,
  penguin_details['timestamp'] AS observation_time,
  penguin_details['penguin_id'] AS penguin_id,
  penguin_details['location'] AS location
FROM
  penguin_movements
使用两阶段方法查询此视图以回答
“谁越过地理围栏?”这个问题
会更加高效。
您首先使用连续的具体化视图中的 cell_id
索引快速查找大致范围内的候选行,然后在缩减的数据集上应用准确的 ST_CONTAINS 函数:
SELECT
  idx.penguin_id,
  idx.location,
  idx.observation_time
FROM
  penguin_s2_time_index AS idx
WHERE
  -- Part one: use an approximate spatial filter and timestamp filter
  -- for fast scans on continuous materialized view keys.
  -- Use the S2_COVERINGCELLIDS function to create an array of S2 cells
  -- that cover the feeding ground polygon. The `level` argument must be the
  -- same value as the one you used to create the continuous materialized view.
  idx.s2_cell_id IN UNNEST(S2_COVERINGCELLIDS(
    ST_GEOGFROMTEXT('POLYGON((-57.21 -64.51, -57.23 -64.55, -57.08 -64.56, -57.06 -64.51, -57.21 -64.51))'),
    min_level => 16,
    max_level => 16,
    max_cells => 500
  ))
  AND idx.observation_time >= '2025-12-03 00:00:00 UTC'
  AND idx.observation_time < '2025-12-04 00:00:00 UTC'
  -- Part two: use ST_CONTAINS() on the returned set to ensure precision.
  -- S2 cells are squares, so they don't equal arbitrary geofence polygons.
  -- You still need to check if a specific point is contained within the area,
  -- but the filter applies to a smaller data set and is much faster.
  AND ST_CONTAINS(ST_GEOGFROMTEXT('POLYGON((-57.21 -64.51, -57.23 -64.55, -57.08 -64.56, -57.06 -64.51, -57.21 -64.51))'), idx.location);
限制
在使用地理位置数据时,Bigtable 不支持以下功能:
- 三维几何图形。这包括 WKT 格式中的“Z”后缀,以及 GeoJSON 格式中的海拔坐标。
- 线性参考系统。这包括 WKT 格式中的“M”后缀。
- 除几何图形基元或多部分几何图形以外的 WKT 几何图形对象。 具体而言,Bigtable 仅支持 Point、MultiPoint、LineString、MultiLineString、Polygon、MultiPolygon 和 GeometryCollection。
- 不支持
ST_CLUSTERDBSCAN函数。
如需了解特定于 GeoJson 和 WKT 输入格式的限制条件,请参阅
ST_GEOGFROMGEOJSON
和
ST_GEOGFROMTEXT。
接下来怎么做?
- 详细了解可用的地理函数。请参阅 GoogleSQL 地理函数概览。