

In the Logs Explorer, you can correlate log entries associated with the
same trace to group and view them together, which simplifies troubleshooting
operations across a request. When you correlate log entries by
setting the trace field in the LogEntry object,
the Logs Explorer displays child log entries nested under their
parent request log entry.
When log entries can be correlated
For log entries to correlate, each entry must include the trace field. When
you instrument an application with OpenTelemetry, the trace and span IDs are
extracted from the trace context and included in the OTLP log data
sent to your project. If you use Google Cloud exporters, then they also extract
these fields. Alternatively, you can set the trace field manually.
The following Google Cloud services capture trace data and write log entries that include trace information:
- App Engine standard environment
- Cloud Run functions
- Cloud Run
In addition, Compute Engine and Google Kubernetes Engine environments capture and include trace data when they use the Ops Agent or the OpenTelemetry Collector.
For information about instrumenting your application to collect trace data, see Instrument for Cloud Trace.
Correlation requirements
For the Logs Explorer to correlate a collection of log entries, the log entries must meet the following requirements:
The
tracefield in theLogEntryobject is set to a string with one of the following formats:TRACE_IDor
projects/PROJECT_ID/traces/TRACE_IDIn the preceding expressions, PROJECT_ID is the ID of your project and TRACE_ID is the ID of the trace.
The value of the
tracefield is the same across all log entries.Each log entry has a different
logNamevalue.The timestamp of the parent log entry is no later than the timestamp of any child log entry.
Before you begin
To get the permissions that you need to use the Logs Explorer to view log entries, ask your administrator to grant you the following IAM roles:
-
To view log entries in the
_Requiredbucket and those in the_Defaultview on the_Defaultbucket, or to select a log scope: Logs Viewer (roles/logging.viewer) on your project, folder, or organization. -
To view all log entries in the
_Requiredand_Defaultbuckets: Private Logs Viewer (roles/logging.privateLogViewer) on your project, folder, or organization.
For more information about granting roles, see Manage access to projects, folders, and organizations.
You might also be able to get the required permissions through custom roles or other predefined roles.
View and search correlated log entries in the Logs Explorer
To view and search log entries using a parent-child structure, do the following:
-
In the Google Cloud console, go to the Logs Explorer page:
If you use the search bar to find this page, then select the result whose subheading is Logging.
In the Correlate by menu, select the parent log name. For example, select
request_logfor App Engine applications.The Query results pane displays one row for each log entry that matches the parent log name.
To view correlated log entries, click chevron_right Expand this log entry:
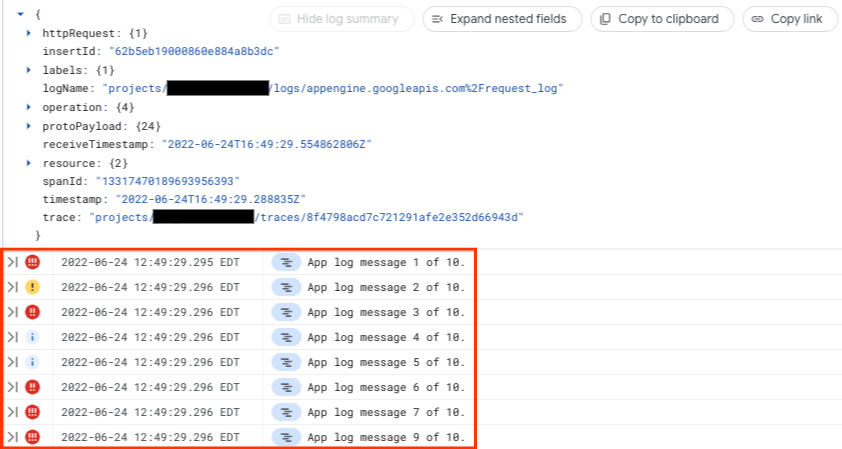
The preceding screenshot shows a parent log entry that has two child log entries.
If you expand a parent log entry and no child log entries appear, then no other log entries within the query's time range share that trace ID.
Optional: Enter a search term or update the query expression to filter or search the correlated log entries.
For example, if you enter
"app log message"in the search bar and click Run query, then the Query results pane shows only log entries that contain the text"app log message".
What's next
For instrumentation information, see Instrument for Cloud Trace.
For information about App Engine request logs and application logs, see Reading and writing application logs.