
Conversational Analytics API 可根據使用者問題產生互動式視覺化內容。API 會以 Vega-Lite JSON 設定或 SVG 圖片的形式傳回圖表 (適用於 Looker 資料來源,且僅限 v1alpha 和 v1beta API 版本)。您也可以指示代理程式根據特定需求生成圖表。系統會根據使用者問題的資料結果建立圖表。
支援的視覺化呈現方式
這個 API 會使用 Vega-Lite 建立視覺化效果,並支援所有標準 Vega-Lite 功能。支援的圖表類型如下:
- 區
- 長條圖
- Geoshape
- 熱視圖
- 折線 (時間序列)
- 圓餅圖
- 散布圖
圖表的生成方式
代理程式會找出相關資料結果,並傳送給子代理程式。這個子代理程式會執行 Python 程式碼,為圖表生成 Vega-Lite JSON 設定。API 會使用對話內容,在生成圖表時更瞭解使用者的意圖。API 運用 Python,可建立更複雜的圖表。
為讓圖表更貼切且易於解讀,代理程式可能會執行次要的資料轉換,例如匯總或套用篩選器。
輸出格式
圖表會以 chart 結果訊息的形式傳回,並可採用下列格式:
- Vega-Lite JSON
- SVG 圖片
您可以使用內容中的 ChartOptions 欄位要求圖片。要求圖片時,API 會提供圖片和 Vega-Lite JSON 輸出內容。
將代理程式回覆內容以視覺化方式呈現
本節說明如何使用 Python SDK,根據 Conversational Analytics API 回應中提供的圖表規格,算繪視覺化內容。程式碼範例會從回應的 chart 欄位中擷取圖表規格 (採用 Vega-Lite 格式),並使用 Altair 程式庫 (以 Vega-Lite 為基礎建構) 算繪圖表、將圖表儲存為圖片,然後顯示該圖片。
如要進一步瞭解如何使用 Vega-Lite 和 Vega-Lite 生態系統算繪圖表,請參閱「Tools for Authoring Vega-Lite Visualizations」。
範例:從 Vega-Lite 輸出內容算繪圖表
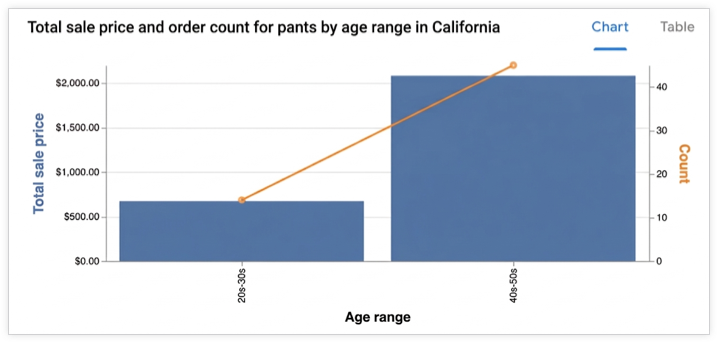
這個範例說明如何根據 Conversational Analytics API 代理程式的回覆,算繪長條圖。這個範例會傳送含有下列提示的要求:
"Create a bar graph that shows the top five states by the total number of airports."
程式碼範例會定義下列輔助函式:
render_chart_response:從chart訊息中擷取 Vega-Lite 設定,轉換為 Altair 程式庫可用的格式,然後算繪圖表、儲存至chart.png並顯示。chat:使用inline_context變數和目前的messages清單,向 Conversational Analytics API 傳送要求、處理串流回應,並在傳回圖表時呼叫render_chart_response來顯示圖表。
如要使用下列程式碼範例,請替換下列項目:
- sqlgen-testing:已啟用必要 API 的帳單專案 ID。
- Create a bar graph that shows the top five states by the total number of airports:要傳送至 Conversational Analytics API 的提示。
from google.cloud import geminidataanalytics
from google.protobuf.json_format import MessageToDict
import altair as alt
import proto

# Helper function for rendering chart response
def render_chart_response(resp):
  def _convert(v):
    if isinstance(v, proto.marshal.collections.maps.MapComposite):
      return {k: _convert(val) for k, val in v.items()}
    elif isinstance(v, proto.marshal.collections.RepeatedComposite):
      return [_convert(el) for el in v]
    elif isinstance(v, (int, float, str, bool, type(None))):
      return v
    else:
      return MessageToDict(v)

  try:
    vega_config = _convert(resp.result.vega_config)
    chart = alt.Chart.from_dict(vega_config)
    chart.save('chart.png')
    chart.display()
    print("Chart rendered and saved as chart.png")
  except Exception as e:
    print(f"Error rendering chart: {e}")

# Helper function for calling the API
def chat(q: str, inline_context, messages):
  billing_project = "sqlgen-testing"

  input_message = geminidataanalytics.Message(
      user_message=geminidataanalytics.UserMessage(text=q)
  )
  messages.append(input_message)

  client = geminidataanalytics.DataChatServiceClient()
  request = geminidataanalytics.ChatRequest(
      inline_context=inline_context,
      parent=f"projects/{billing_project}/locations/global",
      messages=messages,
  )

  # Make the request
  try:
    stream = client.chat(request=request)

    for reply in stream:
      if reply.system_message and hasattr(reply.system_message, 'chart'):
        # ChartMessage includes `query` for generating a chart and `result` with the generated chart.
        if hasattr(reply.system_message.chart, 'result'):
          print("Chart result found in response.")
          render_chart_response(reply.system_message.chart)
        else:
          print("Chart message found, but no result yet.")
      # Append system messages to maintain context for follow-up turns
      if reply.system_message:
          messages.append(geminidataanalytics.Message(system_message=reply.system_message))

  except Exception as e:
    print(f"Error calling API: {e}")

# Example Usage:
# Assuming 'inline_context' and 'messages' are initialized as per "Build a data agent using the Python SDK"
# Example initialization (replace with your actual context and message history):
# inline_context = geminidataanalytics.InlineContext(...)
# messages = []

# Send the prompt to make a bar graph
chat("Create a bar graph that shows the top five states by the total number of airports")