
Heatmap patterns for document keys
This page shows examples of patterns that you might see in a Key Visualizer heatmap. These patterns can help you troubleshoot specific performance issues.
Edition and mode requirements
This document applies to Firestore Standard edition in Firestore in Native mode.
Evenly distributed usage

If a heatmap shows a fine-grained mix of dark and bright colors, then reads and writes are evenly distributed throughout the database. This heatmap likely represents an effective usage pattern for Firestore.
Sequential keys
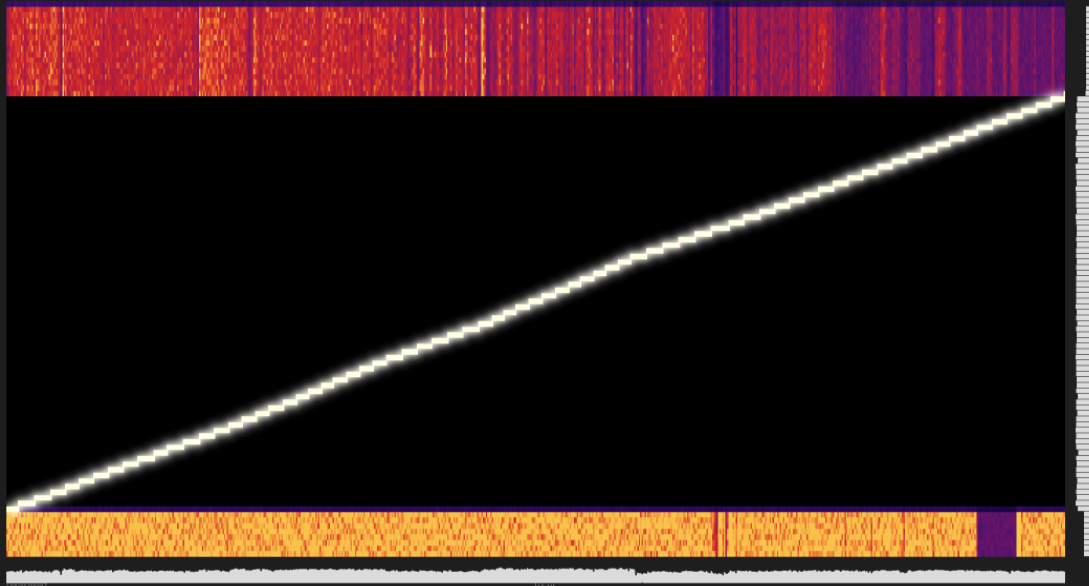
A heatmap with a single bright diagonal line can indicate a database that uses strictly increasing or decreasing keys. Sequential keys are an anti-pattern that can create hotspots. To learn more about hotspots, see the best practices page.
When hotspotting, you might observe corresponding elevated latencies
when you compare a Ops/s metric with a latency metric.
Sudden traffic increase

A heatmap with a key range that suddenly changes from dark to bright indicates
a sudden spike in load. If Ops traffic increases faster than
Firestore can auto-scale resources, you might see
corresponding elevated latency metrics.
What's next
- Learn how to get started with Key Visualizer.
- Find out how to explore a heatmap in detail.
- Read about the metrics you can view in a heatmap.
- Learn about index key patterns