

DNS Armor generates threat logs when suspicious or malicious activity is detected. You can use Cloud Logging to view and analyze the threat logs and gain actionable insight. Additionally, when you have a DNS threat detector monitoring your VPC network, the detector exports metrics that can be examined with Cloud Monitoring metrics.
Two metrics are available:
networksecurity.googleapis.com/dnsthreatdetector/sent_dns_log_count: Count of logs that are sent to your provider for inspection.networksecurity.googleapis.com/dnsthreatdetector/received_dns_threat_count: The number of threat logs detected. This metric includes severity and the type of threat.
These metrics contain filters that let you analyze information more effectively such as filtering for logs generated by a specific DNS Armor instance through its threat detector ID or location.
Before you begin
Verify that the following have been completed before you view DNS threat logs:
- Enable the Network Security API in your project.
- Verify that you have the
DNS Threat Detector Viewerrole.
Threat logs are written to Cloud Logging and can result in additional storage costs. See Use logging and monitoring: Pricing or Pricing for Google Cloud Observability: Cloud Logging.
View threat logs
You can view logs in the Google Cloud console.
Each log entry includes details to identify the corresponding DNS query and threat.
Console
In the Google Cloud console, go to the Logs Explorer page.
Filter the logs for
networksecurity.googleapis.com/DnsThreatDetector.
Threat log record fields
Every threat log has the following fields.
| Name | Type | Description |
|---|---|---|
detectionTime |
string | Time when the threat is detected in UTC. The timestamp is in ISO 8601 format. |
dnsQuery |
DnsLog | Cloud DNS Log format. |
partnerId |
string | Unique partner identifier. |
threatInfo |
threatInfo | The details of threat detected. |
Threat info field
The following table describes the format of the threatInfo field.
| Name | Type | Description |
|---|---|---|
threatID |
string | Unique threat identifier. |
threat |
string | The name of the threat detected. |
threatDescription |
string | A detailed description of the threat detected. |
category |
string | The subtype of the threat detected. |
type |
string | The type of the threat detected. For example, DNS_Tunnel, DGA (Domain Generation Algorithms), or C2 (Command and Control). |
severity |
string | The severity, (High, Medium, Low, or Info), associated with the threat detected. For more information, see Infoblox's Severity Level Definition. |
confidence |
string | Confidence of the threat prediction (high, medium, low). For more information, see Infoblox's Confidence Level Definition. |
threatFeed |
string | Threat feed that triggered this threat alert. |
indicatorType |
string | The type of indicator that triggered this threat alert. For example, URL, IP, Hash, or Host. |
threatIndicator |
string | The threat indicator that triggered this alert. |
DNS Query field
The following table describes the format of the DnsQuery field.
| Name | Type | Description |
|---|---|---|
projectNumber |
string | Source project number. |
location |
string | Google Cloud region, for example us-east1, from
which the response was served. |
queryName |
string | DNS query name, RFC 1035 4.1.2. |
queryType |
string | DNS query type, IANA DNS Parameters: Resource Record (RR) TYPEs. |
responseCode |
string | Response code, IANA DNS Parameters: DNS RCODEs. |
rdata |
string | DNS answer in presentation format, IANA DNS Parameters: Resource Record (RR) TYPEs, truncated to 260 bytes. |
authAnswer |
string | Authoritative answer, IANA DNS Parameters: DNS Header Flags. |
sourceIp |
string | IP originating the query. |
destinationIp |
string | Target IP address, only applicable for forwarding cases. |
protocol |
string | TCP or UDP. |
queryTime |
string | Timestamp for when the DNS query was sent. |
vmInstanceId |
string | Compute Engine VM instance name, only applicable to queries initiated by Compute Engine VMs. |
vmProjectNumber |
string | Google Cloud project ID of the network from which the query was sent, only applicable to queries initiated by Compute Engine VM instances. |
serverlessInstanceId |
string | Serverless instance ID from which the query was sent, only applicable to queries initiated by Serverless. |
Monitor threat logs
You can visualize your log data by creating log-based metrics and a custom dashboard in Cloud Monitoring.
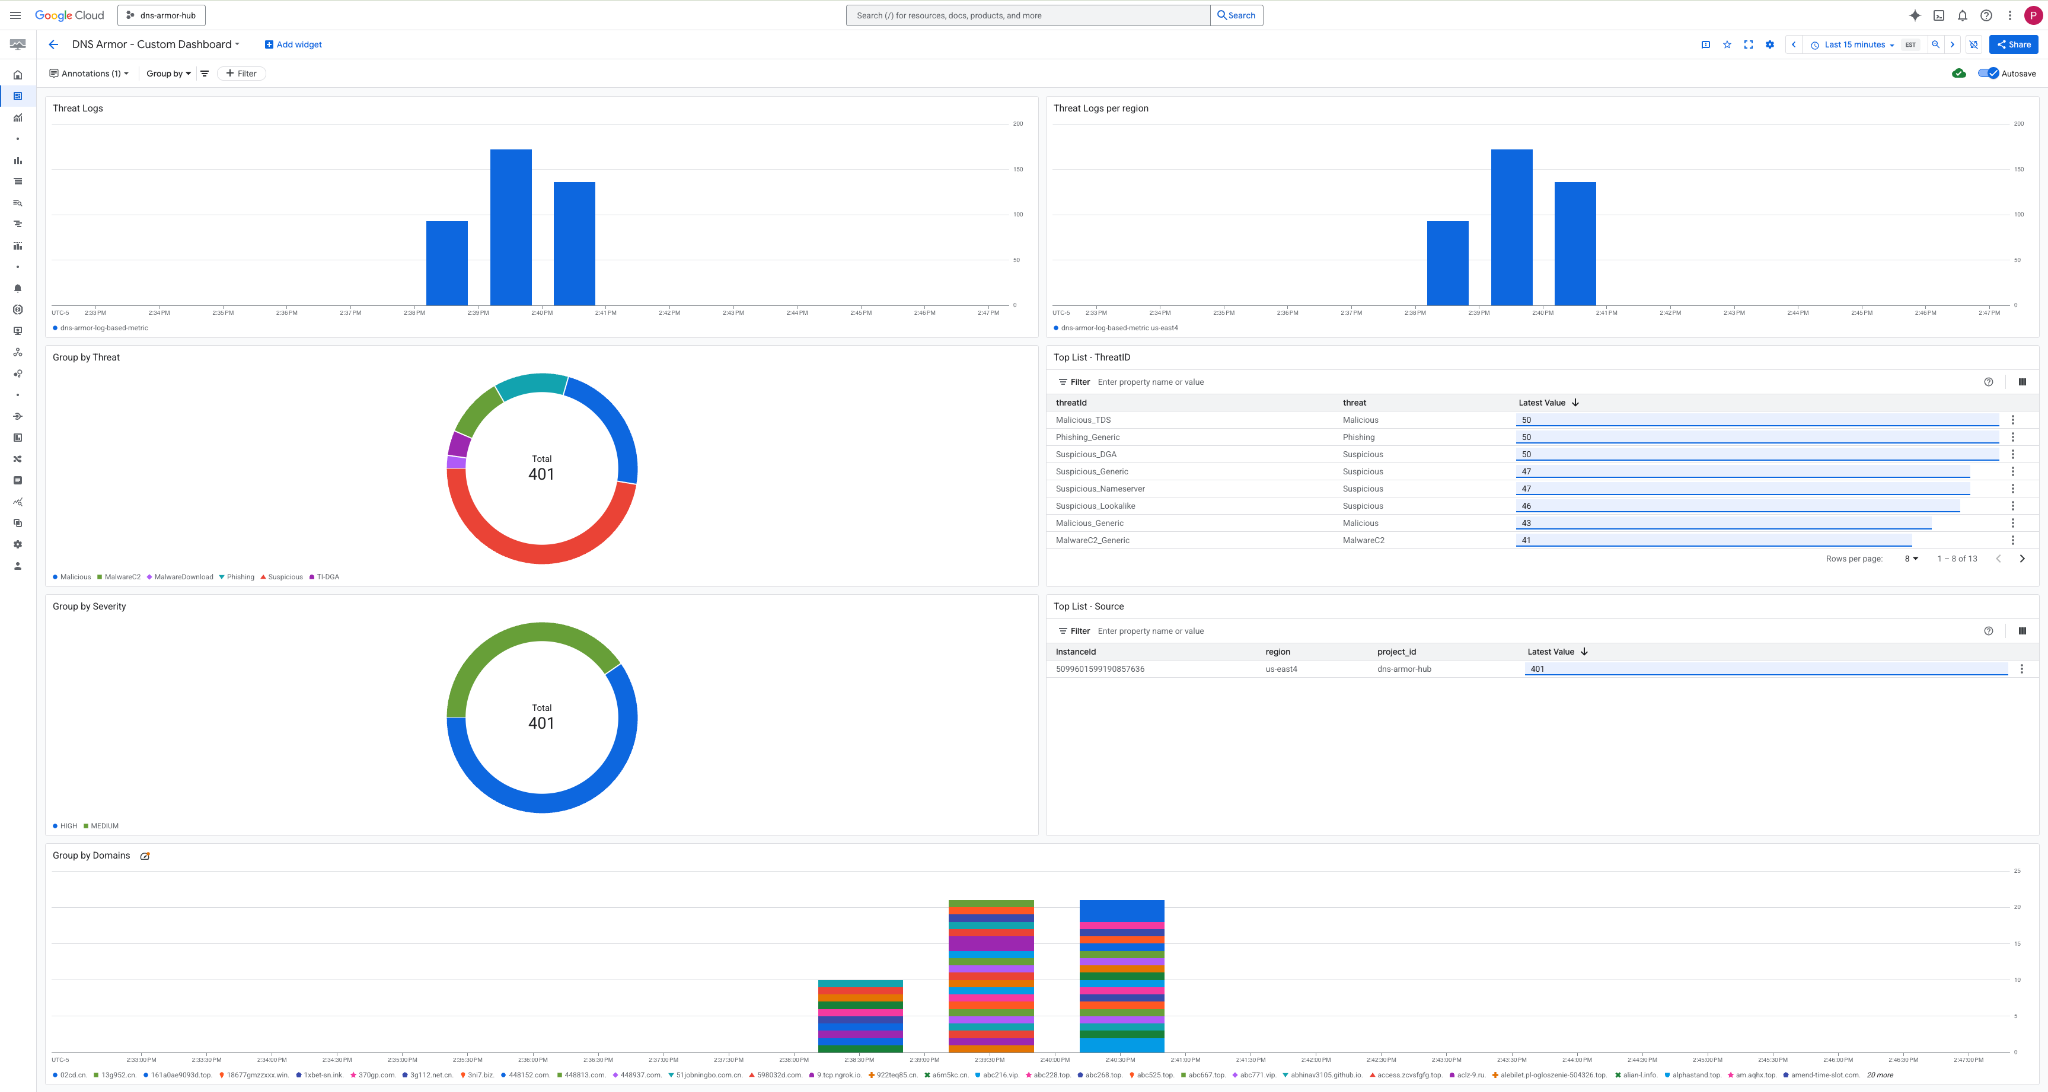
For a step-by-step guide on how to create a custom dashboard for DNS Armor, see the Visualizing DNS Armor's Advanced Threat Detection Logs using Log-Based Metrics and Custom Dashboard tutorial. The example custom dashboard in this tutorial includes the following widgets:
- Threat Logs: the generated threat logs for all included networks within a project.
- Threat Logs per region: the threat logs grouped by region.
- Group by Threat: categorizes threat logs based on the threat type.
- Top List - ThreatID: the top 30 threat IDs.
- Group by Severity: grouping threat logs by severity level.
- Top List - Source: the top 30 instance IDs (source VMs).
- Group by Domains: groups threat logs by the domain names found in the queries.
Considerations:
Log-based metrics have higher ingestion delays and are unsuitable for real-time monitoring or sensitive alerts. There might also be delays in showing the correct log count due to a potential delay for log ingestion.
When configuring alerting for log-based metrics, we recommend setting the alignment period to at least five minutes. The alignment period helps prevent minor fluctuations from triggering alerts.
During periods of heavy load, there could be delays in sending logs to Cloud Logging or in receiving and displaying the logs. For more information see Troubleshoot Logs Explorer.
For more information about Cloud Monitoring dashboards, see Dashboards overview.
What's next
Learn more about how to Use logging and monitoring, including how to enable logging for your VPC networks.
Learn more about Advanced threat detection.
To find solutions for common issues that you might encounter when using threat monitoring, see Troubleshooting.
To learn how to be alerted when a threat is detected, see Alerting overview.