
Google Distributed Cloud (GDC) 에어갭 어플라이언스 프로젝트에서 알림 규칙을 만든 후 프로젝트의 시스템 모니터링 인스턴스또는 GDC Observability HTTP API에서 알림을 쿼리할 수 있습니다.
대시보드에서 알림 쿼리 및 보기
platform-obs 프로젝트의
platform-obs 프로젝트의 시스템 모니터링 인스턴스
시스템 모니터링 인스턴스에는 네트워크 모니터링, 서버 모니터링과 같은 모니터링 프로세스를 실행하기 위한 프로젝트 수준 측정항목, 로그, 알림이 포함됩니다.
시작하기 전에
대시보드에서 알림을 쿼리하고 보려면 시스템 모니터링 인스턴스에 대한 액세스 권한을 획득해야 합니다. 자세한 내용은 대시보드 액세스 권한 얻기를 참고하세요.
로그인하고 알림을 시각화하려면 프로젝트 IAM 관리자에게 프로젝트 Grafana 뷰어 (project-grafana-viewer) 역할을 부여해 달라고 요청하세요. 이 역할 기반 액세스 제어 프로세스를 사용하면 데이터 시각화에 안전하게 액세스할 수 있습니다.
시스템 모니터링 인스턴스 엔드포인트
애플리케이션 운영자 (AO):
다음 URL을 열어 프로젝트의 엔드포인트에 액세스합니다.
https://GDC_URL/PROJECT_NAMESPACE/grafana
다음을 바꿉니다.
- GDC_URL: GDC의 조직 URL입니다.
- PROJECT_NAMESPACE: 프로젝트의 네임스페이스입니다.
프로젝트의 UI에는 알림에 관한 정보가 포함된 알림 - 개요 대시보드와 같은 기본 대시보드가 포함되어 있습니다. UI에서 알림을 쿼리하면 프로젝트에서 알림 정보를 시각적으로 가져오고 리소스의 통합 뷰를 확인하여 문제를 파악하고 신속하게 해결할 수 있습니다.
플랫폼 관리자 (PA):
다음 URL을 열어 platform-obs 프로젝트의 엔드포인트에 액세스합니다.
https://GDC_URL/platform-obs/grafana
GDC_URL를 GDC의 조직 URL로 바꿉니다.
시스템 모니터링 인스턴스의 사용자 인터페이스 (UI)에는 데이터 관측 가능성에 대한 알림 정보가 포함된 알림 - 개요 대시보드와 같은 기본 대시보드가 포함되어 있습니다. UI에서 알림을 쿼리하면 프로젝트에서 알림 정보를 시각적으로 가져오고 리소스의 통합 뷰를 확인하여 문제를 파악하고 신속하게 해결할 수 있습니다.

그림 1. Grafana UI의 알림 - 개요 대시보드
Alertmanager
Alertmanager를 사용하면 클라이언트 애플리케이션의 경고 알림을 모니터링할 수 있습니다. Alertmanager를 사용하여 알림을 검사하고 무음으로 설정할 수 있으며, 알림을 필터링하거나 그룹화할 수 있습니다.
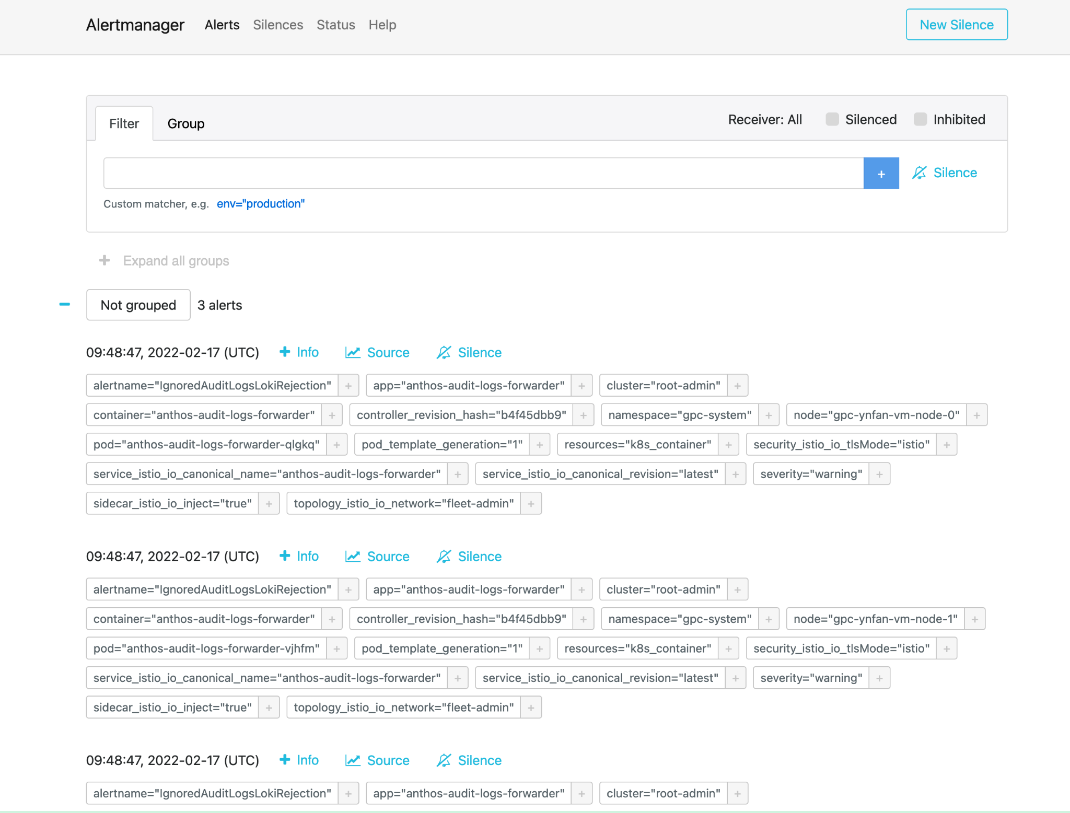
그림 2. Alertmanager에서 감사 로그를 쿼리하는 메뉴 옵션
사전 정의된 알림 정책
다음 표에는 Prometheus에 사전 설치된 알림 규칙이 나와 있습니다.
| 이름 | 설명 |
|---|---|
| KubeAPIDown(심각) | KubeAPI가 Prometheus 대상 검색에서 15분 동안 사라졌습니다. |
| KubeClientErrors(경고) | Kubernetes API 서버 클라이언트 오류율이 15분 동안 0.01을 초과합니다. |
| KubeClientErrors(심각) | Kubernetes API 서버 클라이언트 오류율이 15분 동안 0.1을 초과합니다. |
| KubePodCrashLooping(경고) | 포드가 15분 이상 비정상 종료되는 루프 상태입니다. |
| KubePodNotReady(경고) | 포드가 15분 이상 준비되지 않은 상태입니다. |
| KubePersistentVolumeFillingUp (심각) | 클레임된 PersistentVolume의 무료 바이트가 0.03 미만입니다. |
| KubePersistentVolumeFillingUp (경고) | 클레임된 PersistentVolume의 무료 바이트가 0.15 미만입니다. |
| KubePersistentVolumeErrors (심각) | 영구 볼륨이 5분 동안 실패 또는 대기 단계에 있습니다. |
| KubeNodeNotReady(경고) | 노드가 15분 이상 응답하지 않습니다. |
| KubeNodeCPUUsageHigh(심각) | 노드 CPU 사용량이 80%를 초과합니다. |
| KubeNodeMemoryUsageHigh(심각) | 노드 메모리 사용량이 80%를 초과합니다. |
| NodeFilesystemSpaceFillingUp (경고) | 노드 파일 시스템 사용량이 60%를 초과합니다. |
| NodeFilesystemSpaceFillingUp (심각) | 노드 파일 시스템 사용량이 85%를 초과합니다. |
| CertManagerCertExpirySoon(경고) | 인증서가 21일 후 만료됩니다. |
| CertManagerCertNotReady(심각) | 10분 후 트래픽을 처리하는 데 사용할 인증서가 준비되지 않았습니다. |
| CertManagerHittingRateLimits (심각) | 5분 동안 인증서 생성 및 갱신 비율 제한에 도달했습니다. |
| DeploymentNotReady(심각) | 조직 관리자 클러스터의 배포가 15분 이상 준비되지 않은 상태입니다. |
alertmanagerConfigurationConfigmaps 샘플
alertmanagerConfigurationConfigmaps에 나열된 ConfigMap의 구성 구문은 https://prometheus.io/docs/alerting/latest/configuration/을 따라야 합니다.
apiVersion: observability.gdc.goog/v1alpha1
kind: ObservabilityPipeline
metadata:
  # Choose namespace that matches the project's namespace
  namespace: kube-system
  name: observability-config
# Configure Alertmanager
 alerting:
  # Storage size for alerting data within organization
  # Permission: PA
  localStorageSize: 1Gi

  # Permission: PA & AO
  # alertmanager config must be under the key "alertmanager.yml" in the configMap
  alertmanagerConfig: <configmap-for-alertmanager-config>

  # Permission: PA
  volumes:
    - <volume referenced in volumeMounts>

  # Permission: PA
  volumeMounts:
    - <volumeMount referenced in alertmanagerConfig>
샘플 규칙 구성
# Configures either an alert or a target record for precomputation
apiVersion: monitoring.gdc.goog/v1alpha1
kind: MonitoringRule
metadata:
  # Choose namespace that contains the metrics that rules are based on
  # Note: alert/record will be produced in the same namespace
  namespace: g-fleetns-a
  name: alerting-config
spec:
  # Rule evaluation interval
  interval: <duration>

  # Configure limit for number of alerts (0: no limit)
  # Optional, Default: 0 (no limit)
  limit: <int>

  # Configure record rules
  recordRules:
    # Define which timeseries to write to (must be a valid metric name)
  - record: <string>

    # Define PromQL expression to evaluate for this rule
    expr: <string>

    # Define labels to add or overwrite
    # Optional, Map of {key, value} pairs
    labels:
      <labelname>: <labelvalue>

  # Configure alert rules
  alertRules:
    # Define alert name
  - alert: <string>

    # Define PromQL expression to evaluate for this rule
    # https://prometheus.io/docs/prometheus/latest/configuration/alerting_rules/
    expr: <string>

    # Define when an active alert moves from pending to firing
    # Optional, Default: 0s
    for: <duration>

    # Define labels to add or overwrite
    # Required, Map of {key, value} pairs
    # Required labels:
    #     severity: [error, critical, warning, info]
    #     code:
    #     resource: component/service/hardware related to alert
    #     additional labels are optional
    labels:
      severity: <enum: [error, critical, warning, info]>
      code:
      resource: <Short name of the related operable component>
      <labelname>: <tmpl_string>

    # Define annotations to add
    # Optional, Map of {key, value} pairs
    # Recommended annotations:
    #     message: value of Message field in UI
    #     expression: value of Rule field in UI
    #     runbookurl: URL for link in Actions to take field in UI
    annotations:
      <labelname>: <tmpl_string>
# Configures either an alert or a target record for precomputation
apiVersion: logging.gdc.goog/v1alpha1
kind: LoggingRule
metadata:
  # Choose namespace that contains the logs that rules are based on
  # Note: alert/record will be produced in the same namespace
  namespace: g-fleetns-a
  name: alerting-config
spec:
  # Choose which log source to base alerts on (Operational/Audit/Security Logs)
  # Optional, Default: Operational
  source: <string>

  # Rule evaluation interval
  interval: <duration>

  # Configure limit for number of alerts (0: no limit)
  # Optional, Default: 0 (no limit)
  limit: <int>

  # Configure record rules
  recordRules:
    # Define which timeseries to write to (must be a valid metric name)
  - record: <string>

    # Define LogQL expression to evaluate for this rule
    # https://grafana.com/docs/loki/latest/rules/
    expr: <string>

    # Define labels to add or overwrite
    # Optional, Map of {key, value} pairs
    labels:
      <labelname>: <labelvalue>

  # Configure alert rules
  alertRules:
    # Define alert name
  - alert: <string>

    # Define LogQL expression to evaluate for this rule
    expr: <string>

    # Define when an active alert moves from pending to firing
    # Optional, Default: 0s
    for: <duration>

    # Define labels to add or overwrite
    # Required, Map of {key, value} pairs
    # Required labels:
    #     severity: [error, critical, warning, info]
    #     code:
    #     resource: component/service/hardware related to alert
    #     additional labels are optional
    labels:
      severity: <enum: [error, critical, warning, info]>
      code:
      resource: <Short name of the related operable component>
      <labelname>: <tmpl_string>

    # Define annotations to add
    # Optional, Map of {key, value} pairs
    # Recommended annotations:
    #     message: value of Message field in UI
    #     expression: value of Rule field in UI
    #     runbookurl: URL for link in Actions to take field in UI
    annotations:
      <labelname>: <tmpl_string>
HTTP API에서 알림 쿼리
관측 가능성 플랫폼은 시스템 모니터링을 위해 프로젝트에서 측정항목, 알림, 기타 시계열 데이터를 쿼리하고 읽기 위한 HTTP API 엔드포인트를 노출합니다.관측 가능성 HTTP API에서 직접 쿼리 알림을 통해 자동화된 작업을 설정하고, 사용 사례에 따라 응답을 조정하고, 통합을 빌드하세요. 예를 들어 출력을 다른 명령어에 삽입하거나, 세부정보를 텍스트 파일 형식으로 내보내거나, Linux cron 작업을 구성할 수 있습니다. 명령줄 인터페이스 (CLI) 또는 웹브라우저에서 Observability HTTP API를 호출하고 결과를 JSON 형식으로 가져올 수 있습니다.
이 섹션에서는API 사양을 사용하여 CLI에서 Observability HTTP API 엔드포인트를 호출하여 알림을 쿼리하는 방법을 설명합니다.
관측 가능성 HTTP API에서 직접 쿼리 알림을 통해 자동화된 작업을 설정하고, 사용 사례에 따라 응답을 조정하고, 통합을 빌드하세요. 예를 들어 출력을 다른 명령어에 삽입하거나, 세부정보를 텍스트 파일 형식으로 내보내거나, Linux cron 작업을 구성할 수 있습니다. 명령줄 인터페이스 (CLI) 또는 웹브라우저에서 Observability HTTP API를 호출하고 결과를 JSON 형식으로 가져올 수 있습니다.
이 섹션에서는 Alertmanager API 사양을 사용하여 측정항목을 쿼리하기 위해 CLI에서 관측 가능성 HTTP API 엔드포인트를 호출하는 방법을 설명합니다.
시작하기 전에
관측 가능성 HTTP API 엔드포인트에 액세스하는 데 필요한 권한을 얻으려면 프로젝트 IAM 관리자에게 프로젝트 네임스페이스에서 Project Cortex Alertmanager 뷰어 (project-cortex-alertmanager-viewer) 역할을 부여해 달라고 요청하세요.
프로젝트 IAM 관리자는 역할 바인딩을 만들어 액세스 권한을 부여할 수 있습니다.
a. 인프라 운영자 (IO) 루트 관리자 - Project Cortex Alertmanager Viewer:
kubectl --kubeconfig $HOME/root-admin-kubeconfig create rolebinding
io-cortex-alertmanager-viewer-binding -n infra-obs
--user=fop-infrastructure-operator@example.com
--role=project-cortex-alertmanager-viewer
b. 플랫폼 관리자 (PA) 루트 관리자 - Project Cortex Alertmanager Viewer:
kubectl --kubeconfig $HOME/root-admin-kubeconfig create rolebinding
pa-cortex-alertmanager-viewer-binding -n platform-obs
--user=fop-platform-admin@example.com
--role=project-cortex-alertmanager-viewer
c. 애플리케이션 운영자 (AO) 루트 관리자 - Project Cortex Alertmanager 뷰어: 프로젝트: $AO_PROJECT AO 사용자 이름: $AO_USER
kubectl --kubeconfig $HOME/root-admin-kubeconfig create rolebinding
project-cortex-alertmanager-viewer-binding -n $AO_PROJECT
--user=$AO_USER
--role=project-cortex-alertmanager-viewer
역할 바인딩이 생성되면 로그인 사용자 이름으로 해당 Alertmanager에 액세스할 수 있습니다.
역할 바인딩 확인
kubectl --kubeconfig $HOME/org-1-admin-kubeconfig get rolebinding -n platform-obs
GDC 콘솔에서 역할 바인딩을 설정하는 방법에 대한 자세한 내용은 리소스에 대한 액세스 권한 부여를 참고하세요.
Cortex 엔드포인트
다음 URL은 알림에 액세스하기 위한 Cortex 엔드포인트입니다.
https://GDC_URL/PROJECT_NAME/cortex/alertmanager/
다음을 바꿉니다.
- GDC_URL: GDC의 조직 URL입니다.
- PROJECT_NAME: 프로젝트의 이름입니다.
API 엔드포인트 호출
CLI에서 Cortex API 엔드포인트에 연결하고 알림을 쿼리하려면 다음 단계를 따르세요.
- 기본 요건을 충족하는지 확인합니다.
- CLI를 엽니다.
curl도구를 사용하여 Cortex 엔드포인트 URL을 호출하고 표준 https://prometheus.io/docs/prometheus/latest/querying/api/#alertmanagers를 사용하여 URL을 확장하여 알림을 쿼리합니다. 예를 들면 다음과 같습니다.curl https://console.org-1.zone1.google.gdch.test/alice/cortex/alertmanager/api/v1/alertmanagers
명령어 다음에 CLI에서 출력을 가져옵니다. API 응답 형식은 JSON입니다.