
View data lineage to understand the relationships between your project's resources and the processes that created them. These relationships show how data assets, such as tables and datasets, are transformed by processes like queries and pipelines. This guide describes how to view data lineage details in the Google Cloud console or retrieve them by using the Data Lineage API.
Roles and permissions
Data lineage tracks lineage information automatically when you enable the Data Lineage API. You don't need any administrator or editor roles to capture lineage for your data assets.
To view data lineage, you need specific Identity and Access Management (IAM) permissions. Lineage information is captured across projects, so you need permissions in multiple projects.
When viewing lineage in Knowledge Catalog, BigQuery, or Vertex AI: you need permissions to view lineage information in the project where you are viewing it.
When viewing lineage that was recorded in other projects: you need permissions to view lineage information in those projects where it was recorded.
To get the permissions that you need to view data lineage, ask your administrator to grant you the following IAM roles:
- Data Lineage Viewer (
roles/datalineage.viewer) on the project where lineage is recorded, and the project where lineage is viewed -
View BigQuery table details:
BigQuery Data Viewer (
roles/bigquery.dataViewer) on the table's storage project -
View BigQuery job details:
BigQuery Resource Viewer (
roles/bigquery.resourceViewer) on the job's compute project -
View details for other cataloged assets:
Dataplex Catalog Viewer (
roles/dataplex.catalogViewer) on the project where catalog entries are stored
For more information about granting roles, see Manage access to projects, folders, and organizations.
These predefined roles contain the permissions required to view data lineage. To see the exact permissions that are required, expand the Required permissions section:
Required permissions
The following permissions are required to view data lineage:
-
View BigQuery table details:
bigquery.tables.get- the table's storage project -
View BigQuery job details:
bigquery.jobs.get- the job's compute project
You might also be able to get these permissions with custom roles or other predefined roles.
Types of data lineage views
You can view lineage information as a graph or a list. By default, the lineage graph displays table-level lineage. For BigQuery and Managed Service for Apache Spark jobs, you can view column-level lineage in both graph and list views.
The following view types are available:
Graph view: displays lineage as an interactive graph, letting you explore relationships between data assets and columns by expanding nodes.
List view: displays lineage in a tabular format, providing simplified and detailed representations of table-level and column-level lineage. You can customize columns and export lineage data from this view.
The key elements in the graph are described as follows:
Nodes: represent the data entities. In the table-level view, a node shows the table name and its columns. In the column-level view, each node represents a specific table and its columns that have lineage.
Edges: the lines that connect nodes and represent the processes that occur between them. Edges can feature icons or labels to provide more information about the transformation:
- Icons: In table-level view, icons appear on edges to represent the transformation process. When you manually explore the graph, icons on edges represent the source system of the process (for example, BigQuery or Vertex AI). If multiple processes are involved, a 'multiple processes' icon is displayed. If the process source system is unknown, a gear icon is used. When you apply filters, a gear icon is used for all processes.
- Labels: In column-level view, edges are labeled to describe the
type of dependency between columns, such as
Exact copyorOther.
Enable data lineage
Enable data lineage to begin automatically tracking lineage information for supported systems. By default, enabling the API activates lineage tracking for most supported services. To control Managed Service for Apache Spark lineage ingestion, see Control lineage ingestion for a service.
You must enable the Data Lineage API in both the project where you view lineage and the projects where lineage is recorded. For more information, see Project types.
- To capture lineage information, complete the following steps:
-
In the Google Cloud console, on the Project selector page, select the project where you want to record lineage.
Enable the Data Lineage API.
- Repeat the previous steps for each project where you want to record lineage.
-
In the project where you view lineage, enable the Data Lineage API and the Dataplex API.
Control lineage ingestion for a service
After you enable the Data Lineage API, the service starts automatic lineage tracking for most supported services. You can then selectively enable or disable lineage ingestion for specific integrations at the project, folder, or organization level. During preview, this feature supports configuring ingestion for Managed Service for Apache Spark, BigQuery, and Managed Service for Apache Airflow.
The configuration is hierarchical. The most specific configuration takes precedence. For example, a project-level configuration overrides a folder-level configuration. If no configuration is set, the service's default behavior is used. For Managed Service for Apache Spark, BigQuery, and Managed Airflow, the default is Enabled.
Any changes to the configuration might take up to 24 hours to propagate, but usually become effective within two hours.
For more information about controlling lineage ingestion including how the configuration is applied hierarchically, see Control lineage ingestion.
Prerequisites
To control lineage ingestion, you must use the Data Lineage API. Ensure you have a client project configured for billing and quota, as the Data Lineage API is a client-based API.
Enable the
datalineage.googleapis.comAPI in your client project. For more information, see Enable data lineage.Set the client project. For the following examples, use the
X-Goog-User-Projectheader. For more information, see System parameters.
Get current configuration
To check whether lineage ingestion is enabled for a resource or to obtain
the etag value before you modify the configuration, retrieve the current
configuration.
C#
Before trying this sample, follow the C# setup instructions in the
Knowledge Catalog quickstart using
client libraries.
For more information, see the
Knowledge Catalog C# API
reference documentation.
To authenticate to Knowledge Catalog, set up Application Default Credentials.
For more information, see
Set up authentication for a local development environment.
C#
Go
Before trying this sample, follow the Go setup instructions in the
Knowledge Catalog quickstart using
client libraries.
For more information, see the
Knowledge Catalog Go API
reference documentation.
To authenticate to Knowledge Catalog, set up Application Default Credentials.
For more information, see
Set up authentication for a local development environment.
Go
Java
Before trying this sample, follow the Java setup instructions in the
Knowledge Catalog quickstart using
client libraries.
For more information, see the
Knowledge Catalog Java API
reference documentation.
To authenticate to Knowledge Catalog, set up Application Default Credentials.
For more information, see
Set up authentication for a local development environment.
Java
Python
Before trying this sample, follow the Python setup instructions in the
Knowledge Catalog quickstart using
client libraries.
For more information, see the
Knowledge Catalog Python API
reference documentation.
To authenticate to Knowledge Catalog, set up Application Default Credentials.
For more information, see
Set up authentication for a local development environment.
Python
gcloud
To view the current lineage configuration, use the
gcloud datalineage config describe command. You can retrieve the configuration for a project, folder, or organization.
The following example shows how to get the configuration for the current project:
gcloud datalineage config describe
For example, to get the configuration for a specific project use the --project flag:
gcloud datalineage config describe --project=PROJECT_ID
Replace the following:
PROJECT_ID: The ID of the project the configuration of which you want to view.
To view the current lineage ingestion configuration of a service for a folder or organization, replace --project= with:PROJECT_ID
--folder=if you want to view the data ingestion settings for a folder.FOLDER_ID--organization=if you want to view the data ingestion settings for an organization.ORGANIZATION_ID
REST
To view the current lineage configuration, use the
projects.locations.config.get method. You can retrieve the configuration for
a project, folder, or organization.
The following example shows how to get the configuration for a project:
Before using any of the request data, make the following replacements:
CLIENT_PROJECT_ID: The ID of your client project used for billing or quotas.PROJECT_ID: The ID of the project whose configuration you want to view.
HTTP method and URL:
GET https://datalineage.googleapis.com/v1/projects/PROJECT_ID/locations/global/config
To send your request, expand one of these options:
The command returns one of the following outputs:
- If you don't provide any lineage ingestion settings, you get an output with an empty
ingestionobject:{ "name": "projects/123456789012/locations/global/config", "ingestion": {} }
This means that the service uses the default lineage ingestion setting. In this example, the lineage ingestion setting for Managed Service for Apache Spark is
enabled. - If you enable lineage ingestion explicitly, you get
the following output:
{
  "name": "projects/123456789012/locations/global/config",
  "ingestion": {
    "rules": [
      {
        "integrationSelector": {
          "integration": "DATAPROC"
        },
        "lineageEnablement": {
          "enabled": true
        }
      }
    ]
  },
  "etag": "1a2b3c4d5e"
}
- If the lineage ingestion is disabled, you get the
following output:
{
  "name": "projects/123456789012/locations/global/config",
  "ingestion": {
    "rules": [
      {
        "integrationSelector": {
          "integration": "DATAPROC"
        },
        "lineageEnablement": {
          "enabled": false
        }
      }
    ]
  },
  "etag": "1a2b3c4d5e"
}
To get the configuration for a folder or organization, replace
projects/ with "PROJECT_IDfolders/ or FOLDER_IDorganizations/.ORGANIZATION_ID
The etag field in the response is a checksum generated by the server based on
the current value of the configuration. When updating a configuration using
the patch method, you can include the etag value returned from a
recent get request in the request body. If you provide the etag,
Knowledge Catalog uses it to verify that the configuration hasn't changed
since your last read request. If there's a mismatch, the update request
fails. This prevents you from unintentionally overwriting configurations made by
other users in read-modify-write scenarios. If you don't provide an etag
in your patch request, Knowledge Catalog overwrites the configuration
unconditionally.
Disable lineage ingestion for a service
To manage costs, enforce data governance policies, or exclude development projects and other workloads that don't benefit from lineage tracking, disable lineage ingestion for a service.
Java
package com.google.cloud.datacatalog.lineage.configmanagement.v1.samples;

import com.google.api.gax.rpc.NotFoundException;
import com.google.cloud.datacatalog.lineage.configmanagement.v1.Config;
import com.google.cloud.datacatalog.lineage.configmanagement.v1.Config.Ingestion;
import com.google.cloud.datacatalog.lineage.configmanagement.v1.Config.Ingestion.IngestionRule;
import com.google.cloud.datacatalog.lineage.configmanagement.v1.Config.Ingestion.IngestionRule.IntegrationSelector;
import com.google.cloud.datacatalog.lineage.configmanagement.v1.Config.Ingestion.IngestionRule.IntegrationSelector.Integration;
import com.google.cloud.datacatalog.lineage.configmanagement.v1.Config.Ingestion.IngestionRule.LineageEnablement;
import com.google.cloud.datacatalog.lineage.configmanagement.v1.ConfigManagementServiceClient;
import com.google.cloud.datacatalog.lineage.configmanagement.v1.ConfigName;
import com.google.cloud.datacatalog.lineage.configmanagement.v1.GetConfigRequest;
import com.google.cloud.datacatalog.lineage.configmanagement.v1.UpdateConfigRequest;

public class DisableLineageIngestion {

  public static void main(String[] args) throws Exception {
    // TODO(developer): Replace these variables before running the sample.
    String projectId = "your-project-id";
    String location = "global";
    disableLineageIngestion(projectId, location);
  }

  // Disables lineage ingestion for a specific service
  // (Managed Service for Apache Spark).
  public static void disableLineageIngestion(String projectId, String location) throws Exception {
    // Initialize client that will be used to send requests. This client only needs to be created
    // once, and can be reused for multiple requests.
    try (ConfigManagementServiceClient client = ConfigManagementServiceClient.create()) {
      // Format the resource name.
      String name = ConfigName.ofProjectLocationName(projectId, location).toString();

      Config.Builder configBuilder = Config.newBuilder().setName(name);

      // It is a best practice to read the existing config to preserve other rules
      // and use the etag for optimistic concurrency control.
      try {
        GetConfigRequest getRequest = GetConfigRequest.newBuilder().setName(name).build();
        Config existingConfig = client.getConfig(getRequest);
        configBuilder.mergeFrom(existingConfig);
      } catch (NotFoundException e) {
        // If config doesn't exist, we will proceed by creating a new one.
      }

      // Create an integration selector for the service you want to disable.
      IntegrationSelector selector =
          IntegrationSelector.newBuilder().setIntegration(Integration.DATAPROC).build();

      // Set lineage enablement to false to disable tracking.
      LineageEnablement enablement = LineageEnablement.newBuilder().setEnabled(false).build();

      // Build the ingestion rule.
      IngestionRule disableRule =
          IngestionRule.newBuilder()
              .setIntegrationSelector(selector)
              .setLineageEnablement(enablement)
              .build();

      // Preserve existing rules except for the one we are modifying, then add the new rule.
      // We clear the ingestion block out of the configBuilder entirely to reconstruct it.
      Ingestion.Builder ingestionBuilder = Ingestion.newBuilder();
      if (configBuilder.hasIngestion()) {
        for (IngestionRule rule : configBuilder.getIngestion().getRulesList()) {
          // Keep all existing rules EXCEPT the one targeting DATAPROC
          if (rule.getIntegrationSelector().getIntegration() != Integration.DATAPROC) {
            ingestionBuilder.addRules(rule);
          }
        }
      }
      ingestionBuilder.addRules(disableRule);

      // Update the config builder with the reconstructed ingestion settings.
      configBuilder.setIngestion(ingestionBuilder.build());

      // Build the update request.
      UpdateConfigRequest request = UpdateConfigRequest.newBuilder()
          .setConfig(configBuilder.build())
          .build();

      // Update the config.
      Config response = client.updateConfig(request);
      System.out.printf("Successfully updated config: %s\n", response.getName());
    }
  }
}
Python
from google.api_core.exceptions import NotFound
from google.cloud.datacatalog.lineage import configmanagement_v1

def disable_lineage_ingestion(project_id: str, location: str = "global") -> configmanagement_v1.Config:
    """Disables lineage ingestion for a specific service.

    Args:
        project_id: The ID of your Google Cloud project.
        location: The region location, usually 'global'.

    Returns:
        The updated Configuration object.
    """
    # Initialize client that will be used to send requests.
    client = configmanagement_v1.ConfigManagementServiceClient()

    # The config name format
    name = f"projects/{project_id}/locations/{location}/config"

    try:
        # Retrieve the existing config to preserve other configurations and
        # obtain the latest etag for optimistic concurrency control.
        config = client.get_config(name=name)

        # Filter out existing rules for the integration we are updating
        new_rules = [
            rule for rule in config.ingestion.rules
            if rule.integration_selector.integration != configmanagement_v1.Config.Ingestion.IngestionRule.IntegrationSelector.Integration.DATAPROC
        ]
    except NotFound:
        # If the config does not exist, start fresh
        config = configmanagement_v1.Config(name=name)
        new_rules = []

    # Define the integration to disable tracking for (e.g., DATAPROC).
    integration_selector = configmanagement_v1.Config.Ingestion.IngestionRule.IntegrationSelector(
        integration=configmanagement_v1.Config.Ingestion.IngestionRule.IntegrationSelector.Integration.DATAPROC
    )

    # Set lineage enablement to False to disable tracking.
    lineage_enablement = configmanagement_v1.Config.Ingestion.IngestionRule.LineageEnablement(
        enabled=False
    )

    # Create the ingestion rule.
    disable_rule = configmanagement_v1.Config.Ingestion.IngestionRule(
        integration_selector=integration_selector,
        lineage_enablement=lineage_enablement,
    )
     # Append the new disabling rule and assign it back to the config ingestion rules
    new_rules.append(disable_rule)
    config.ingestion = configmanagement_v1.Config.Ingestion(rules=new_rules)

    # Create the update request using the config (which includes the etag if it existed).
    request = configmanagement_v1.UpdateConfigRequest(
        config=config,
    )

    # Make the request to update the config
    response = client.update_config(request=request)

    print(f"Successfully updated config: {response.name}")
    return response
gcloud
To disable lineage ingestion for a specific service,
use the gcloud datalineage config update command with an inline JSON string or a path to a JSON file that sets lineageEnablement.enabled to false for the specific integration.
The following example shows how to disable lineage ingestion of a service for a project using an inline JSON string:
gcloud datalineage config update --project=PROJECT_ID \
  --config='{
    "ingestion": {
      "rules": [
        {
          "integrationSelector": {
            "integration": "INTEGRATION"
          },
          "lineageEnablement": {
            "enabled": false
          }
        }
      ]
    },
    "etag": "ETAG"
  }'
Replace the following:
PROJECT_ID: The ID of the project the configuration of which you want to update.INTEGRATION: The integration you set the configuration for. For example,DATAPROCorBIGQUERY.ETAG: Theetagvalue returned from a recentgetrequest in the request body, used to verify that the configuration hasn't changed since your last read request.
To update the configuration using a JSON file, run:
gcloud datalineage config update --project=PROJECT_ID --config=CONFIG_FILE
Replace the following:
CONFIG_FILE: The path to the JSON file containing the configuration.
To disable lineage ingestion of a service for a folder or organization, replace --project= with:PROJECT_ID
--project=withPROJECT_ID--folder=if you want to update the data ingestion settings for a folder.FOLDER_ID--project=withPROJECT_ID--organization=if you want to update the data ingestion settings for an organization.ORGANIZATION_ID
REST
To disable lineage ingestion for a specific service,
use the projects.locations.config.patch method with an ingestion rule that
sets lineageEnablement.enabled to false for the specific integration.
To prevent unintentionally overwriting configurations made by other users in
read-modify-write scenarios, you can include the etag field in the request
body. For more information, see
Get current configuration.
Before using any of the request data, make the following replacements:
CLIENT_PROJECT_ID: The ID of your client project used for billing or quotas.PROJECT_ID: The ID of the project whose configuration you want to update.ETAG: Theetagvalue returned from a recentgetrequest.INTEGRATION: Theintegrationyou set the configuration for. For example,DATAPROC.
HTTP method and URL:
PATCH https://datalineage.googleapis.com/v1/projects/PROJECT_ID/locations/global/config
Request JSON body:
{
  "ingestion": {
    "rules": [
      {
        "integrationSelector": {
          "integration": "INTEGRATION"
        },
        "lineageEnablement": {
          "enabled": false
        }
      }
    ]
  },
  "etag": "ETAG"
}
To send your request, expand one of these options:
You should receive a JSON response similar to the following:
{
  "name": "projects/PROJECT_ID/locations/global/config",
  "ingestion": {
    "rules": [
      {
        "integrationSelector": {
          "integration": "INTEGRATION"
        },
        "lineageEnablement": {
          "enabled": false
        }
      }
    ]
  },
  "etag": "1a2b3c4d5e"
}
To disable the lineage ingestion for a folder or organization, replace
projects/ with "PROJECT_IDfolders/ or FOLDER_IDorganizations/.ORGANIZATION_ID
Enable lineage ingestion for a service
To resume tracking after disabling it, or to enable an integration disabled by default, enable lineage ingestion for a service.
Java
package com.google.cloud.datacatalog.lineage.configmanagement.v1.samples;

import com.google.api.gax.rpc.NotFoundException;
import com.google.cloud.datacatalog.lineage.configmanagement.v1.Config;
import com.google.cloud.datacatalog.lineage.configmanagement.v1.Config.Ingestion;
import com.google.cloud.datacatalog.lineage.configmanagement.v1.Config.Ingestion.IngestionRule;
import com.google.cloud.datacatalog.lineage.configmanagement.v1.Config.Ingestion.IngestionRule.IntegrationSelector;
import com.google.cloud.datacatalog.lineage.configmanagement.v1.Config.Ingestion.IngestionRule.IntegrationSelector.Integration;
import com.google.cloud.datacatalog.lineage.configmanagement.v1.Config.Ingestion.IngestionRule.LineageEnablement;
import com.google.cloud.datacatalog.lineage.configmanagement.v1.ConfigManagementServiceClient;
import com.google.cloud.datacatalog.lineage.configmanagement.v1.ConfigName;
import com.google.cloud.datacatalog.lineage.configmanagement.v1.GetConfigRequest;
import com.google.cloud.datacatalog.lineage.configmanagement.v1.UpdateConfigRequest;

public class EnableLineageIngestion {

  public static void main(String[] args) throws Exception {
    // TODO(developer): Replace these variables before running the sample.
    String projectId = "your-project-id";
    String location = "global";
    enableLineageIngestion(projectId, location);
  }

  // Enables lineage ingestion for a specific service
  // (Managed Service for Apache Spark).
  public static void enableLineageIngestion(String projectId, String location) throws Exception {
    // Initialize client that will be used to send requests. This client only needs to be created
    // once, and can be reused for multiple requests.
    try (ConfigManagementServiceClient client = ConfigManagementServiceClient.create()) {
      // Format the resource name.
      String name = ConfigName.ofProjectLocationName(projectId, location).toString();

      Config.Builder configBuilder = Config.newBuilder().setName(name);

      // It is a best practice to read the existing config to preserve other rules
      // and use the etag for optimistic concurrency control.
      try {
        GetConfigRequest getRequest = GetConfigRequest.newBuilder().setName(name).build();
        Config existingConfig = client.getConfig(getRequest);
        configBuilder.mergeFrom(existingConfig);
      } catch (NotFoundException e) {
        // If config doesn't exist, we will proceed by creating a new one.
      }

      // Create an integration selector for the service you want to enable (e.g., DATAPROC).
      IntegrationSelector selector =
          IntegrationSelector.newBuilder().setIntegration(Integration.DATAPROC).build();

      // Set lineage enablement to true to enable tracking.
      LineageEnablement enablement = LineageEnablement.newBuilder().setEnabled(true).build();

      // Build the ingestion rule.
      IngestionRule enableRule =
          IngestionRule.newBuilder()
              .setIntegrationSelector(selector)
              .setLineageEnablement(enablement)
              .build();

      // Preserve existing rules except for the one we are modifying, then add the new rule.
      // We clear the ingestion block out of the configBuilder entirely to reconstruct it.
      Ingestion.Builder ingestionBuilder = Ingestion.newBuilder();
      if (configBuilder.hasIngestion()) {
        for (IngestionRule rule : configBuilder.getIngestion().getRulesList()) {
          // Keep all existing rules EXCEPT the one targeting DATAPROC
          if (rule.getIntegrationSelector().getIntegration() != Integration.DATAPROC) {
            ingestionBuilder.addRules(rule);
          }
        }
      }
      ingestionBuilder.addRules(enableRule);

      // Update the config builder with the reconstructed ingestion settings.
      configBuilder.setIngestion(ingestionBuilder.build());

      // Build the update request.
      UpdateConfigRequest request = UpdateConfigRequest.newBuilder()
          .setConfig(configBuilder.build())
          .build();

      // Update the config.
      Config response = client.updateConfig(request);
      System.out.printf("Successfully updated config: %s\n", response.getName());
    }
  }
}
Python
from google.api_core.exceptions import NotFound
from google.cloud.datacatalog.lineage import configmanagement_v1

def enable_lineage_ingestion(project_id: str, location: str = "global") -> configmanagement_v1.Config:
    """Enables lineage ingestion for a specific service like Dataproc
    (Managed Service for Apache Spark).

    Args:
        project_id: The ID of your Google Cloud project.
        location: The region location, usually 'global'.

    Returns:
        The updated Configuration object.
    """
    # Initialize client that will be used to send requests.
    client = configmanagement_v1.ConfigManagementServiceClient()

    # The config name format
    name = f"projects/{project_id}/locations/{location}/config"

    try:
        # Retrieve the existing config to preserve other configurations and
        # obtain the latest etag for optimistic concurrency control.
        config = client.get_config(name=name)

        # Filter out existing rules for the integration we are updating
        new_rules = [
            rule for rule in config.ingestion.rules
            if rule.integration_selector.integration != configmanagement_v1.Config.Ingestion.IngestionRule.IntegrationSelector.Integration.DATAPROC
        ]
    except NotFound:
        # If the config does not exist, start fresh
        config = configmanagement_v1.Config(name=name)
        new_rules = []

    # Define the integration to enable tracking for (e.g., DATAPROC).
    integration_selector = configmanagement_v1.Config.Ingestion.IngestionRule.IntegrationSelector(
        integration=configmanagement_v1.Config.Ingestion.IngestionRule.IntegrationSelector.Integration.DATAPROC
    )

    # Set lineage enablement to True to enable tracking.
    lineage_enablement = configmanagement_v1.Config.Ingestion.IngestionRule.LineageEnablement(
        enabled=True
    )

    # Create the ingestion rule.
    enable_rule = configmanagement_v1.Config.Ingestion.IngestionRule(
        integration_selector=integration_selector,
        lineage_enablement=lineage_enablement,
    )

    # Append the new enabling rule and assign it back to the config ingestion rules
    new_rules.append(enable_rule)
    config.ingestion = configmanagement_v1.Config.Ingestion(rules=new_rules)

    # Create the update request using the config (which includes the etag if it existed).
    request = configmanagement_v1.UpdateConfigRequest(
        config=config,
    )

    # Make the request to update the config
    response = client.update_config(request=request)

    print(f"Successfully updated config: {response.name}")
    return response
gcloud
To enable lineage ingestion for a specific service,
use the gcloud datalineage config update command with an inline JSON string or a path to a JSON file that sets lineageEnablement.enabled to true for the specific integration. Current integrations include Managed Service for Apache Spark, BigQuery, and Managed Airflow.
The following example shows how to enable lineage ingestion of a service for a project using an inline JSON string:
gcloud datalineage config update --project=PROJECT_ID \
  --config='{
    "ingestion": {
      "rules": [
        {
          "integrationSelector": {
            "integration": "INTEGRATION"
          },
          "lineageEnablement": {
            "enabled": true
          }
        }
      ]
    },
    "etag": "ETAG"
  }'
Replace the following:
PROJECT_ID: The ID of the project whose configuration you want to update.INTEGRATION: The integration you set the configuration for (for example,DATAPROCorBIGQUERY).ETAG: Theetagvalue returned from a recentgetrequest in the request body, used to verify that the configuration hasn't changed since your last read request.
To update the configuration using a JSON file, run:
gcloud datalineage config update --project=PROJECT_ID --config=CONFIG_FILE
Replace the following:
CONFIG_FILE: The path to the JSON file containing the configuration.
To enable lineage ingestion of a service for a folder or organization, replace --project= with:PROJECT_ID
--folder=if you want to update the data ingestion settings for a folder.FOLDER_ID--organization=if you want to update the data ingestion settings for an organization.ORGANIZATION_ID
REST
To enable lineage ingestion for a specific service,
use the projects.locations.config.patch method with an ingestion rule that
sets lineageEnablement.enabled to true for the specific integration. Current integrations include Managed Service for Apache Spark, BigQuery, and Managed Airflow.
To prevent unintentionally overwriting configurations made by other users in
read-modify-write scenarios, you can include the etag field in the request
body. For more information, see
Get current configuration.
Before using any of the request data, make the following replacements:
CLIENT_PROJECT_ID: The ID of your client project used for billing or quotas.PROJECT_ID: The ID of the project whose configuration you want to update.ETAG: Theetagvalue returned from a recentgetrequest.INTEGRATION: Theintegrationyou set the configuration for. For example,DATAPROC.
HTTP method and URL:
PATCH https://datalineage.googleapis.com/v1/projects/PROJECT_ID/locations/global/config
Request JSON body:
{
  "ingestion": {
    "rules": [
      {
        "integrationSelector": {
          "integration": "INTEGRATION"
        },
        "lineageEnablement": {
          "enabled": true
        }
      }
    ]
  },
  "etag": "ETAG"
}
To send your request, expand one of these options:
You should receive a JSON response similar to the following:
{
  "name": "projects/PROJECT_ID/locations/global/config",
  "ingestion": {
    "rules": [
      {
        "integrationSelector": {
          "integration": "INTEGRATION"
        },
        "lineageEnablement": {
          "enabled": true
        }
      }
    ]
  },
  "etag": "1a2b3c4d5e"
}
To enable lineage ingestion of a service for a folder or organization, replace
projects/ with PROJECT_IDfolders/ or
FOLDER_IDorganizations/.ORGANIZATION_ID
View lineage
To track how data is transformed and moves across systems, you can view data lineage using the Google Cloud console or the API.
Console
You can access data lineage information in the Google Cloud console from various starting points:
- Knowledge Catalog: Go to the Knowledge Catalog Search page, select Knowledge Catalog as the search mode, search for the entry you want to view, and then click it. For more information, see Search for resources in Knowledge Catalog.
- BigQuery: Go to the BigQuery page and open the table for which you want to see the data lineage.
- Vertex AI: Go to the Datasets or Model Registry page, and click the dataset or model for which you want to see the data lineage.
To view the lineage graph, follow these steps:
Click the Lineage tab.
The default Graph view opens, showing table-level lineage across systems and regions. For more information, see Lineage graph view.
To manually explore the lineage graph, click Expand next to a node to load five more nodes at a time.
For more information, see Manually explore the lineage graph.
Click a node in the Graph view.
The Details panel opens with information about the asset, such as fully qualified name and type. For more information, see Node details.
Click an edge with a process icon in the Graph view.
The Query panel opens. For more information, see Inspect transformation logic and Audit and history of runs.
- To inspect transformation logic, click the Details tab.
- To see audit and history of runs, click the Runs tab.
In the Lineage explorer panel, select filter criteria—for example, Direction, Dependency type, or Time range—and then click Apply.
This opens a focused view within a specific region (Preview). This view automatically expands the graph up to three levels of nodes. For more information, see Apply filters for a focused lineage view.
In the focused Graph view, select a node, and then in the node's details panel, click Visualize Path to visualize the lineage path from the selected node back to the root entry (only in focused view).
For more information, see Lineage path visualization.
To view column-level lineage (only for BigQuery and Managed Service for Apache Spark jobs), do one of the following:
- In a focused Graph view, click the column icon on a table.
Column icon - In the Lineage explorer panel, filter by column name, and click Apply.
For more information, see Column-level lineage.
- In a focused Graph view, click the column icon on a table.
Click Reset.
This action removes all applied filters and takes you to the beginning of the graph view.
Click List to switch to the list view.
The List view offers simplified and detailed tabular representations of lineage for both table-level and column-level lineage, synchronized with the Graph view. By default, simplified list view is displayed, and you can toggle to detailed list view for analyzing individual source-target relationships. You can configure which columns are displayed and export lineage data. For more information, see Lineage list view.
Java
import com.google.api.gax.rpc.ApiException;
import com.google.cloud.datacatalog.lineage.v1.BatchSearchLinkProcessesRequest;
import com.google.cloud.datacatalog.lineage.v1.EntityReference;
import com.google.cloud.datacatalog.lineage.v1.EventLink;
import com.google.cloud.datacatalog.lineage.v1.LineageClient;
import com.google.cloud.datacatalog.lineage.v1.LineageEvent;
import com.google.cloud.datacatalog.lineage.v1.Link;
import com.google.cloud.datacatalog.lineage.v1.ListLineageEventsRequest;
import com.google.cloud.datacatalog.lineage.v1.ListRunsRequest;
import com.google.cloud.datacatalog.lineage.v1.LocationName;
import com.google.cloud.datacatalog.lineage.v1.ProcessLinks;
import com.google.cloud.datacatalog.lineage.v1.Run;
import com.google.cloud.datacatalog.lineage.v1.SearchLinksRequest;
import java.io.IOException;
import java.util.ArrayList;
import java.util.HashSet;
import java.util.LinkedList;
import java.util.List;
import java.util.Queue;
import java.util.Set;

public class ViewLineageExample {

  public static void main(String[] args) throws IOException {
    // TODO(developer): Replace these variables before running the sample.
    String projectId = "my-project-id";
    String location = "us";
    String targetFullyQualifiedName = "bigquery:my-project-id.my_dataset.my_table";
    int maxDepth = 3;

    viewLineage(projectId, location, targetFullyQualifiedName, maxDepth);
  }

  static class Node {
    String fqn;
    int depth;
    Node(String fqn, int depth) {
      this.fqn = fqn;
      this.depth = depth;
    }
  }

  public static void viewLineage(
      String projectId, String location, String targetFullyQualifiedName, int maxDepth)
      throws IOException {
    // Initialize client that will be used to send requests. This client only needs
    // to be created once, and can be reused for multiple requests.
    try (LineageClient client = LineageClient.create()) {
      String parent = LocationName.of(projectId, location).toString();

      Set<String> visitedNodes = new HashSet<>();
      Queue<Node> queue = new LinkedList<>();

      visitedNodes.add(targetFullyQualifiedName);
      queue.offer(new Node(targetFullyQualifiedName, 0));

      while (!queue.isEmpty()) {
        Node current = queue.poll();
        System.out.printf("\nExploring node (Depth %d): %s\n", current.depth, current.fqn);

        if (current.depth >= maxDepth) {
          continue;
        }

        EntityReference targetEntity =
            EntityReference.newBuilder().setFullyQualifiedName(current.fqn).build();
        SearchLinksRequest searchLinksRequest =
            SearchLinksRequest.newBuilder().setParent(parent).setTarget(targetEntity).build();

        List<String> linkNames = new ArrayList<>();
        try {
          // 1. Search for links related to the target entity
          for (Link link : client.searchLinks(searchLinksRequest).iterateAll()) {
            linkNames.add(link.getName());
          }
        } catch (ApiException e) {
          System.out.printf("  Failed to retrieve links for %s: %s\n", current.fqn, e.getMessage());
          continue;
        }

        if (linkNames.isEmpty()) {
          continue;
        }

        // 2. Batch search for processes in chunks of 100
        for (int i = 0; i < linkNames.size(); i += 100) {
          List<String> batch = linkNames.subList(i, Math.min(linkNames.size(), i + 100));
          BatchSearchLinkProcessesRequest batchSearchRequest =
              BatchSearchLinkProcessesRequest.newBuilder()
                  .setParent(parent)
                  .addAllLinks(batch)
                  .build();

          try {
            for (ProcessLinks processLinks :
                client.batchSearchLinkProcesses(batchSearchRequest).iterateAll()) {
              String processName = processLinks.getProcess();
              System.out.printf("  Process: %s\n", processName);

              // 3. List runs for the process
              ListRunsRequest runsRequest =
                  ListRunsRequest.newBuilder().setParent(processName).build();
              for (Run run : client.listRuns(runsRequest).iterateAll()) {
                System.out.printf("    Run: %s\n", run.getName());

                // 4. List events for the run
                ListLineageEventsRequest eventsRequest =
                    ListLineageEventsRequest.newBuilder().setParent(run.getName()).build();
                for (LineageEvent event : client.listLineageEvents(eventsRequest).iterateAll()) {
                  for (EventLink eventLink : event.getLinksList()) {
                    String sourceFqn = eventLink.getSource().getFullyQualifiedName();
                    // If exploring upstream, queue the source
                    if (!sourceFqn.isEmpty() && !visitedNodes.contains(sourceFqn)) {
                      visitedNodes.add(sourceFqn);
                      queue.offer(new Node(sourceFqn, current.depth + 1));
                    }
                  }
                }
              }
            }
          } catch (ApiException e) {
            System.out.printf("  Failed to retrieve processes/runs: %s\n", e.getMessage());
          }
        }
      }
    }
  }
}
Python
from google.cloud import datacatalog_lineage_v1
from google.api_core.exceptions import GoogleAPICallError

def view_lineage(project_id: str, location: str, target_fully_qualified_name: str, max_depth: int = 3):
    """Retrieves lineage for a given entity using a depth-limited search."""
    client = datacatalog_lineage_v1.LineageClient()
    parent = f"projects/{project_id}/locations/{location}"

    # Store visited nodes to avoid infinite loops in cyclic graphs
    visited_nodes = set([target_fully_qualified_name])
    queue = [(target_fully_qualified_name, 0)]

    while queue:
        current_node, current_depth = queue.pop(0)
        print(f"\nExploring node (Depth {current_depth}): {current_node}")

        if current_depth >= max_depth:
            continue

        target_entity = datacatalog_lineage_v1.EntityReference(
            fully_qualified_name=current_node
        )
        search_links_request = datacatalog_lineage_v1.SearchLinksRequest(
            parent=parent,
            target=target_entity,
        )

        try:
            links = list(client.search_links(request=search_links_request))
        except GoogleAPICallError as e:
            print(f"  Failed to retrieve links for {current_node}: {e.message}")
            continue

        if not links:
            continue

        # Extract link names to query processes in batches
        link_names = [link.name for link in links]

        # Batch max size is 100
        for i in range(0, len(link_names), 100):
            batch = link_names[i:i + 100]
            batch_request = datacatalog_lineage_v1.BatchSearchLinkProcessesRequest(
                parent=parent,
                links=batch
            )

            try:
                for process_links in client.batch_search_link_processes(request=batch_request):
                    process_name = process_links.process
                    print(f"  Process: {process_name}")

                    runs_request = datacatalog_lineage_v1.ListRunsRequest(parent=process_name)
                    for run in client.list_runs(request=runs_request):
                        print(f"    Run: {run.name}")

                        events_request = datacatalog_lineage_v1.ListLineageEventsRequest(parent=run.name)
                        for event in client.list_lineage_events(request=events_request):
                            for event_link in event.links:
                                source_fqn = event_link.source.fully_qualified_name

                                # If exploring upstream, queue the source
                                if source_fqn and source_fqn not in visited_nodes:
                                    visited_nodes.add(source_fqn)
                                    queue.append((source_fqn, current_depth + 1))

            except GoogleAPICallError as e:
                 print(f"  Failed to retrieve processes/runs: {e.message}")
Refine the lineage visualization
To refine the lineage visualization, you can use highlighting and filtering options in Lineage explorer:
To search for specific projects, datasets, or entity names, use the Filters panel.
After you apply filters, lineage nodes that match your filter criteria are considered matching nodes. You can refine how matching and non-matching nodes are displayed.
In the top right corner of the lineage graph, click the More actions icon located next to the Clear filters button to see display options.
Select one or both of the following options:
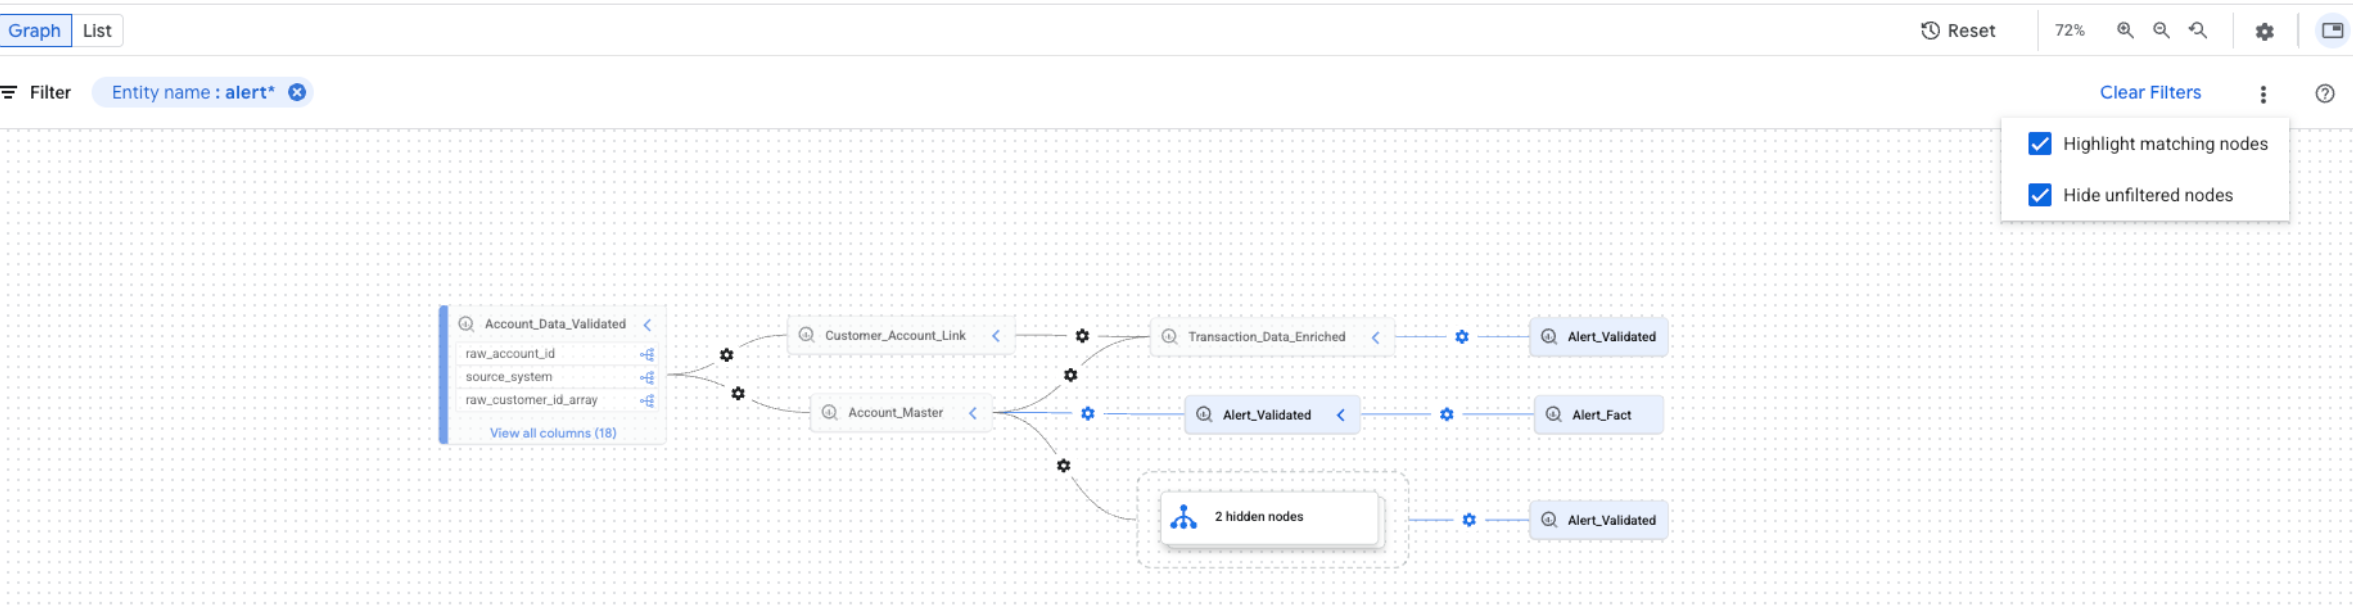
You can select both options at the same time. If both options are selected, unfiltered nodes are hidden, and matching nodes are highlighted in the filtered graph view.
What's next
- Track data lineage for a BigQuery table's copy and query jobs.
- Learn about data lineage information model.
- Learn about data lineage considerations.
- Learn about data lineage audit logging.
- Learn how to troubleshoot data lineage.
- Learn how to integrate with OpenLineage.
- Learn how to use data lineage with Managed Service for Apache Spark.