수집기 배포 및 사용

이 문서에서는 OpenTelemetry Collector를 배포하고, otlphttp 내보내기 도구와 Telemetry (OTLP) API를 사용하도록 수집기를 구성하고, 원격 분석 생성기를 실행하여 Cloud Monitoring에 측정항목을 쓰는 방법을 설명합니다. 그런 다음 Cloud Monitoring에서 이러한 측정항목을 볼 수 있습니다.

Google Kubernetes Engine을 사용하는 경우 Telemetry API를 사용하는 OpenTelemetry Collector를 수동으로 배포하고 구성하는 대신 GKE용 관리형 OpenTelemetry를 따를 수 있습니다.

SDK를 사용하여 애플리케이션에서 원격 분석 API로 직접 측정항목을 전송하는 경우 SDK를 사용하여 애플리케이션에서 측정항목 전송에서 추가 정보와 예를 참고하세요.

OpenTelemetry Collector 및 Telemetry API를 OpenTelemetry 제로 코드 계측과 함께 사용할 수도 있습니다. 자세한 내용은 Java용 OpenTelemetry 제로 코드 계측 사용을 참고하세요.

시작하기 전에

이 섹션에서는 수집기를 배포하고 사용하기 위한 환경을 설정하는 방법을 설명합니다.

Google Cloud 프로젝트 선택 또는 만들기

이 둘러보기의 Google Cloud 프로젝트를 선택합니다. 아직 Google Cloud 프로젝트가 없으면 다음을 실행하여 만듭니다.

  1. Google Cloud 계정에 로그인합니다. Google Cloud를 처음 사용하는 경우 계정을 만들고 Google 제품의 실제 성능을 평가해 보세요. 신규 고객에게는 워크로드를 실행, 테스트, 배포하는 데 사용할 수 있는 $300의 무료 크레딧이 제공됩니다.
  2. In the Google Cloud console, on the project selector page, select or create a Google Cloud project.

    Roles required to select or create a project

    • Select a project: Selecting a project doesn't require a specific IAM role—you can select any project that you've been granted a role on.
    • Create a project: To create a project, you need the Project Creator role (roles/resourcemanager.projectCreator), which contains the resourcemanager.projects.create permission. Learn how to grant roles.

    Go to project selector

  3. Verify that billing is enabled for your Google Cloud project.

  4. In the Google Cloud console, on the project selector page, select or create a Google Cloud project.

    Roles required to select or create a project

    • Select a project: Selecting a project doesn't require a specific IAM role—you can select any project that you've been granted a role on.
    • Create a project: To create a project, you need the Project Creator role (roles/resourcemanager.projectCreator), which contains the resourcemanager.projects.create permission. Learn how to grant roles.

    Go to project selector

  5. Verify that billing is enabled for your Google Cloud project.

명령줄 도구 설치

이 문서에서는 다음 명령줄 도구를 사용합니다.

  • gcloud
  • kubectl

gcloudkubectl 도구는 Google Cloud CLI의 일부입니다. 설치에 대한 자세한 내용은 Google Cloud CLI 구성요소 관리를 참조하세요. 설치한 gcloud CLI 구성요소를 보려면 다음 명령어를 실행하세요.

gcloud components list

사용할 gcloud CLI를 구성하려면 다음 명령어를 실행합니다.

gcloud auth login
gcloud config set project PROJECT_ID

API 사용 설정

Google Cloud 프로젝트에서 Cloud Monitoring API와 Telemetry API를 사용 설정합니다. 원격 분석 API(telemetry.googleapis.com)에 특히 주의하세요. 이 문서에서 이 API를 처음 접했을 수도 있습니다.

다음 명령어를 실행하여 API를 사용 설정합니다.

gcloud services enable monitoring.googleapis.com
gcloud services enable telemetry.googleapis.com

클러스터 만들기

GKE 클러스터 만들기

  1. 다음 명령어를 실행하여 otlp-test라는 Google Kubernetes Engine 클러스터를 만듭니다.

    gcloud container clusters create-auto --location CLUSTER_LOCATION otlp-test --project PROJECT_ID
    
  2. 클러스터가 생성되면 다음 명령어를 실행하여 클러스터에 연결합니다.

    gcloud container clusters get-credentials otlp-test --region CLUSTER_LOCATION --project PROJECT_ID
    

Kubernetes 서비스 계정 승인

다음 명령어는 Kubernetes 서비스 계정에 필요한 Identity and Access Management (IAM) 역할을 부여합니다. 이러한 명령어는 GKE용 워크로드 아이덴티티 제휴를 사용한다고 가정합니다.

export PROJECT_NUMBER=$(gcloud projects describe PROJECT_ID --format="value(projectNumber)")

gcloud projects add-iam-policy-binding projects/PROJECT_ID \
  --role=roles/logging.logWriter \
  --member=principal://iam.googleapis.com/projects/$PROJECT_NUMBER/locations/global/workloadIdentityPools/PROJECT_ID.svc.id.goog/subject/ns/opentelemetry/sa/opentelemetry-collector \
  --condition=None

gcloud projects add-iam-policy-binding projects/PROJECT_ID \
  --role=roles/monitoring.metricWriter \
  --member=principal://iam.googleapis.com/projects/$PROJECT_NUMBER/locations/global/workloadIdentityPools/PROJECT_ID.svc.id.goog/subject/ns/opentelemetry/sa/opentelemetry-collector \
  --condition=None

gcloud projects add-iam-policy-binding projects/PROJECT_ID \
  --role=roles/telemetry.tracesWriter \
  --member=principal://iam.googleapis.com/projects/$PROJECT_NUMBER/locations/global/workloadIdentityPools/PROJECT_ID.svc.id.goog/subject/ns/opentelemetry/sa/opentelemetry-collector \
  --condition=None

서비스 계정의 형식이 다른 경우 Google Cloud Managed Service for Prometheus 문서의 명령어를 사용하여 다음 변경사항과 함께 서비스 계정을 승인할 수 있습니다.

  • 서비스 계정 이름 gmp-test-sa을 서비스 계정으로 바꿉니다.
  • roles/monitoring.metricWriter 역할뿐만 아니라 이전 명령어 세트에 표시된 역할도 부여합니다.

OpenTelemetry Collector 배포

다음 YAML 파일을 복사하여 collector.yaml이라는 파일에 배치하여 수집기 구성을 만듭니다. GitHub의 otlp-k8s-ingest 저장소에서도 다음 구성을 확인할 수 있습니다.

복사본에서 ${GOOGLE_CLOUD_PROJECT}를 프로젝트 ID PROJECT_ID로 바꿔야 합니다.

Prometheus 측정항목용 OTLP는 OpenTelemetry Collector 버전 0.140.0 이상을 사용하는 경우에만 작동합니다.

# Copyright 2024 Google LLC
#
# Licensed under the Apache License, Version 2.0 (the "License");
# you may not use this file except in compliance with the License.
# You may obtain a copy of the License at
#
#     http://www.apache.org/licenses/LICENSE-2.0
#
# Unless required by applicable law or agreed to in writing, software
# distributed under the License is distributed on an "AS IS" BASIS,
# WITHOUT WARRANTIES OR CONDITIONS OF ANY KIND, either express or implied.
# See the License for the specific language governing permissions and
# limitations under the License.

exporters:
  # The googlecloud exporter is used for logs
  googlecloud:
    log:
      default_log_name: opentelemetry-collector
    user_agent: Google-Cloud-OTLP manifests:0.4.0 OpenTelemetry Collector Built By Google/0.128.0 (linux/amd64)
  googlemanagedprometheus:
    user_agent: Google-Cloud-OTLP manifests:0.4.0 OpenTelemetry Collector Built By Google/0.128.0 (linux/amd64)
  # The otlphttp exporter is used to send traces to Google Cloud Trace and
  # metrics to Google Managed Prometheus using OTLP http/proto.
  # The otlp exporter could also be used to send them using OTLP grpc
  otlphttp:
    encoding: proto
    endpoint: https://telemetry.googleapis.com
    # Use the googleclientauth extension to authenticate with Google credentials
    auth:
      authenticator: googleclientauth


extensions:
  # Standard for the collector. Used for probes.
  health_check:
    endpoint: ${env:MY_POD_IP}:13133
  # This is an auth extension that adds Google Application Default Credentials to http and gRPC requests.
  googleclientauth:


processors:
  # This filter is a standard part of handling the collector's self-observability metrics. Not related to OTLP ingestion.
  filter/self-metrics:
    metrics:
      include:
        match_type: strict
        metric_names:
        - otelcol_process_uptime
        - otelcol_process_memory_rss
        - otelcol_grpc_io_client_completed_rpcs
        - otelcol_googlecloudmonitoring_point_count

  # The recommended batch size for the OTLP endpoint is 200 metric data points.
  batch:
    send_batch_max_size: 200
    send_batch_size: 200
    timeout: 5s

  # The k8sattributes processor adds k8s resource attributes to metrics based on the source IP that sent the metrics to the collector.
  # k8s attributes are important for avoiding errors from timeseries "collisions".
  # These attributes help distinguish workloads from each other, and provide useful metadata (e.g. namespace) when querying.
  k8sattributes:
    extract:
      metadata:
      - k8s.namespace.name
      - k8s.deployment.name
      - k8s.statefulset.name
      - k8s.daemonset.name
      - k8s.cronjob.name
      - k8s.job.name
      - k8s.replicaset.name
      - k8s.node.name
      - k8s.pod.name
      - k8s.pod.uid
      - k8s.pod.start_time
    passthrough: false
    pod_association:
    - sources:
      - from: resource_attribute
        name: k8s.pod.ip
    - sources:
      - from: resource_attribute
        name: k8s.pod.uid
    - sources:
      - from: connection

  # Standard processor for gracefully degrading when overloaded to prevent OOM.
  memory_limiter:
    check_interval: 1s
    limit_percentage: 65
    spike_limit_percentage: 20

  # Standard processor for enriching self-observability metrics. Unrelated to OTLP ingestion.
  metricstransform/self-metrics:
    transforms:
    - action: update
      include: otelcol_process_uptime
      operations:
      - action: add_label
        new_label: version
        new_value: Google-Cloud-OTLP manifests:0.4.0 OpenTelemetry Collector Built By Google/0.128.0 (linux/amd64)

  # The resourcedetection processor, similar to the k8sattributes processor, enriches metrics with important metadata.
  # The gcp detector provides the cluster name and cluster location.
  resourcedetection:
    detectors: [gcp]
    timeout: 10s

  # This transform processor avoids ingestion errors if metrics contain attributes with names that are reserved for the prometheus_target resource.
  transform/collision:
    metric_statements:
    - context: datapoint
      statements:
      - set(attributes["exported_location"], attributes["location"])
      - delete_key(attributes, "location")
      - set(attributes["exported_cluster"], attributes["cluster"])
      - delete_key(attributes, "cluster")
      - set(attributes["exported_namespace"], attributes["namespace"])
      - delete_key(attributes, "namespace")
      - set(attributes["exported_job"], attributes["job"])
      - delete_key(attributes, "job")
      - set(attributes["exported_instance"], attributes["instance"])
      - delete_key(attributes, "instance")
      - set(attributes["exported_project_id"], attributes["project_id"])
      - delete_key(attributes, "project_id")

  # The relative ordering of statements between ReplicaSet & Deployment and Job & CronJob are important.
  # The ordering of these controllers is decided based on the k8s controller documentation available at
  # https://kubernetes.io/docs/concepts/workloads/controllers.
  # The relative ordering of the other controllers in this list is inconsequential since they directly
  # create pods.
  transform/aco-gke:
    metric_statements:
    - context: datapoint
      statements:
      - set(attributes["top_level_controller_type"], "ReplicaSet") where resource.attributes["k8s.replicaset.name"] != nil
      - set(attributes["top_level_controller_name"], resource.attributes["k8s.replicaset.name"]) where resource.attributes["k8s.replicaset.name"] != nil
      - set(attributes["top_level_controller_type"], "Deployment") where resource.attributes["k8s.deployment.name"] != nil
      - set(attributes["top_level_controller_name"], resource.attributes["k8s.deployment.name"]) where resource.attributes["k8s.deployment.name"] != nil
      - set(attributes["top_level_controller_type"], "DaemonSet") where resource.attributes["k8s.daemonset.name"] != nil
      - set(attributes["top_level_controller_name"], resource.attributes["k8s.daemonset.name"]) where resource.attributes["k8s.daemonset.name"] != nil
      - set(attributes["top_level_controller_type"], "StatefulSet") where resource.attributes["k8s.statefulset.name"] != nil
      - set(attributes["top_level_controller_name"], resource.attributes["k8s.statefulset.name"]) where resource.attributes["k8s.statefulset.name"] != nil
      - set(attributes["top_level_controller_type"], "Job") where resource.attributes["k8s.job.name"] != nil
      - set(attributes["top_level_controller_name"], resource.attributes["k8s.job.name"]) where resource.attributes["k8s.job.name"] != nil
      - set(attributes["top_level_controller_type"], "CronJob") where resource.attributes["k8s.cronjob.name"] != nil
      - set(attributes["top_level_controller_name"], resource.attributes["k8s.cronjob.name"]) where resource.attributes["k8s.cronjob.name"] != nil
  # For each Prometheus unknown-typed metric, which is a gauge, create a counter that is an exact copy of this metric.
  # The GCP OTLP endpoint will add appropriate the appropriate suffixes for the counter and gauge.
  transform/unknown-counter:
    metric_statements:
    - context: metric
      statements:
      # Copy the unknown metric, but add a suffix so we can distinguish the copy from the original.
      - copy_metric(Concat([metric.name, "unknowncounter"], ":")) where metric.metadata["prometheus.type"] == "unknown" and not HasSuffix(metric.name, ":unknowncounter")
      # Change the copy to a monotonic, cumulative sum.
      - convert_gauge_to_sum("cumulative", true) where HasSuffix(metric.name, ":unknowncounter")
      # Delete the extra suffix once we are done.
      - set(metric.name, Substring(metric.name, 0, Len(metric.name)-Len(":unknowncounter"))) where HasSuffix(metric.name, ":unknowncounter")

  # When sending telemetry to the GCP OTLP endpoint, the gcp.project_id resource attribute is required to be set to your project ID.
  resource/gcp_project_id:
    attributes:
    - key: gcp.project_id
      # MAKE SURE YOU REPLACE THIS WITH YOUR PROJECT ID
      value: ${GOOGLE_CLOUD_PROJECT}
      action: insert
  # The metricstarttime processor is important to include if you are using the prometheus receiver to ensure the start time is set properly.
  # It is a no-op otherwise.
  metricstarttime:
    strategy: subtract_initial_point

receivers:
  # This collector is configured to accept OTLP metrics, logs, and traces, and is designed to receive OTLP from workloads running in the cluster.
  otlp:
    protocols:
      grpc:
        endpoint: ${env:MY_POD_IP}:4317
      http:
        cors:
          allowed_origins:
          - http://*
          - https://*
        endpoint: ${env:MY_POD_IP}:4318

  # Push the collector's own self-observability metrics to the otlp receiver.
  otlp/self-metrics:
    protocols:
      grpc:
        endpoint: ${env:MY_POD_IP}:14317

service:
  extensions:
  - health_check
  - googleclientauth
  pipelines:
    # Recieve OTLP logs, and export logs using the googlecloud exporter.
    logs:
      exporters:
      - googlecloud
      processors:
      - k8sattributes
      - resourcedetection
      - memory_limiter
      - batch
      receivers:
      - otlp
    # Recieve OTLP metrics, and export metrics to GMP using the otlphttp exporter.
    metrics/otlp:
      exporters:
      - otlphttp
      processors:
      - k8sattributes
      - memory_limiter
      - resource/gcp_project_id
      - resourcedetection
      - transform/collision
      - transform/aco-gke
      - transform/unknown-counter
      - metricstarttime
      - batch
      receivers:
      - otlp
    # Scrape self-observability Prometheus metrics, and export metrics to GMP using the otlphttp exporter.
    metrics/self-metrics:
      exporters:
      - otlphttp
      processors:
      - filter/self-metrics
      - metricstransform/self-metrics
      - k8sattributes
      - memory_limiter
      - resource/gcp_project_id
      - resourcedetection
      - batch
      receivers:
      - otlp/self-metrics
    # Recieve OTLP traces, and export traces using the otlphttp exporter.
    traces:
      exporters:
      - otlphttp
      processors:
      - k8sattributes
      - memory_limiter
      - resource/gcp_project_id
      - resourcedetection
      - batch
      receivers:
      - otlp
  telemetry:
    logs:
      encoding: json
    metrics:
      readers:
      - periodic:
          exporter:
            otlp:
              protocol: grpc
              endpoint: ${env:MY_POD_IP}:14317

배포된 OpenTelemetry Collector 구성

Kubernetes 리소스를 만들어 수집기 배포를 구성합니다.

  1. 다음 명령어를 실행하여 opentelemetry 네임스페이스를 만들고 네임스페이스에 수집기 구성을 만듭니다.

    kubectl create namespace opentelemetry
    
    kubectl create configmap collector-config -n opentelemetry --from-file=collector.yaml
    
  2. 다음 명령어를 실행하여 Kubernetes 리소스로 수집기를 구성합니다.

    kubectl apply -f https://raw.githubusercontent.com/GoogleCloudPlatform/otlp-k8s-ingest/refs/heads/otlpmetric/k8s/base/2_rbac.yaml
    
    kubectl apply -f https://raw.githubusercontent.com/GoogleCloudPlatform/otlp-k8s-ingest/refs/heads/otlpmetric/k8s/base/3_service.yaml
    
    kubectl apply -f https://raw.githubusercontent.com/GoogleCloudPlatform/otlp-k8s-ingest/refs/heads/otlpmetric/k8s/base/4_deployment.yaml
    
    kubectl apply -f https://raw.githubusercontent.com/GoogleCloudPlatform/otlp-k8s-ingest/refs/heads/otlpmetric/k8s/base/5_hpa.yaml
    
  3. 수집기 포드가 'Running' 상태가 되고 1/1 컨테이너가 준비될 때까지 기다립니다. 첫 번째 워크로드를 배포하는 경우 Autopilot에서 약 3분이 걸립니다. 포드를 확인하려면 다음 명령어를 사용합니다.

    kubectl get po -n opentelemetry -w
    

    포드 상태 모니터링을 중지하려면 Ctrl-C를 입력하여 명령어를 중지합니다.

  4. 수집기 로그를 확인하여 명백한 오류가 없는지 확인할 수도 있습니다.

    kubectl logs -n opentelemetry deployment/opentelemetry-collector
    

원격 분석 생성기 배포

오픈소스 telemetrygen 도구를 사용하여 구성을 테스트할 수 있습니다. 이 앱은 원격 분석을 생성하여 수집기로 전송합니다.

  1. opentelemetry-demo 네임스페이스에 telemetrygen 앱을 배포하려면 다음 명령어를 실행합니다.

    kubectl apply -f https://raw.githubusercontent.com/GoogleCloudPlatform/otlp-k8s-ingest/refs/heads/main/sample/app.yaml
    
  2. 배포를 만든 후 포드가 생성되고 실행되기까지 시간이 걸릴 수 있습니다. 포드 상태를 확인하려면 다음 명령어를 실행하세요.

    kubectl get po -n opentelemetry-demo -w
    

    포드 상태 모니터링을 중지하려면 Ctrl-C를 입력하여 명령어를 중지합니다.

측정항목 탐색기를 사용하여 측정항목 쿼리
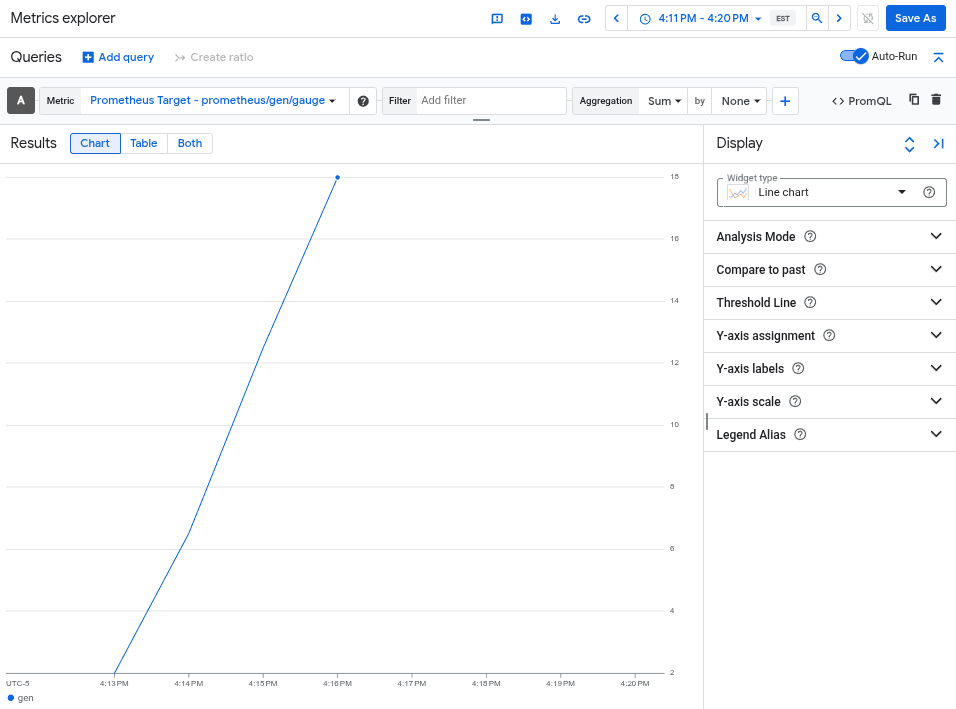
telemetrygen 도구는 gen이라는 측정항목에 작성합니다. 측정항목 탐색기의 쿼리 빌더 인터페이스와 PromQL 쿼리 편집기에서 이 측정항목을 쿼리할 수 있습니다.

Google Cloud 콘솔에서  측정항목 탐색기 페이지로 이동합니다.

측정항목 탐색기로 이동

검색창을 사용하여 이 페이지를 찾은 경우 부제목이 Monitoring인 결과를 선택합니다.

  • 측정항목 탐색기 쿼리 빌더 인터페이스를 사용하는 경우 측정항목의 전체 이름은 prometheus.googleapis.com/gen/gauge입니다.
  • PromQL 쿼리 편집기를 사용하는 경우 gen 이름을 사용하여 측정항목을 쿼리할 수 있습니다.

다음 이미지는 측정항목 탐색기의 gen 측정항목 차트를 보여줍니다.

차트에는 otlphttp 내보내기 도구로 캡처된 gen 측정항목이 표시됩니다.

클러스터 삭제

측정항목을 쿼리하여 배포를 확인한 후 클러스터를 삭제할 수 있습니다. 클러스터를 삭제하려면 다음 명령어를 실행합니다.

gcloud container clusters delete --location CLUSTER_LOCATION otlp-test --project PROJECT_ID

다음 단계