コレクタをデプロイして使用する

このドキュメントでは、OpenTelemetry Collector をデプロイし、otlphttp エクスポータと Telemetry(OTLP)API を使用するようにコレクタを構成し、テレメトリー ジェネレータを実行して Cloud Monitoring に指標を書き込む方法について説明します。これらの指標は、Cloud Monitoring で確認できます。

Google Kubernetes Engine を使用している場合は、Telemetry API を使用する OpenTelemetry Collector を手動でデプロイして構成する代わりに、GKE 用のマネージド OpenTelemetry を使用できます。

SDK を使用してアプリケーションから Telemetry API に指標を直接送信する場合は、SDK を使用してアプリケーションから指標を送信するで詳細と例をご覧ください。

OpenTelemetry Collector と Telemetry API を OpenTelemetry のゼロコード計測と組み合わせて使用することもできます。詳細については、Java 用の OpenTelemetry ゼロコード計測を使用するをご覧ください。

始める前に

このセクションでは、コレクタのデプロイと使用のために環境を設定する方法について説明します。

Google Cloud プロジェクトを選択または作成する

このチュートリアルで使用する Google Cloud プロジェクトを選択します。 Google Cloud プロジェクトが存在しない場合は作成します。

  1. Google Cloud アカウントにログインします。 Google Cloudを初めて使用する場合は、 アカウントを作成して、実際のシナリオでの Google プロダクトのパフォーマンスを評価してください。新規のお客様には、ワークロードの実行、テスト、デプロイができる無料クレジット $300 分を差し上げます。
  2. In the Google Cloud console, on the project selector page, select or create a Google Cloud project.

    Roles required to select or create a project

    • Select a project: Selecting a project doesn't require a specific IAM role—you can select any project that you've been granted a role on.
    • Create a project: To create a project, you need the Project Creator role (roles/resourcemanager.projectCreator), which contains the resourcemanager.projects.create permission. Learn how to grant roles.

    Go to project selector

  3. Verify that billing is enabled for your Google Cloud project.

  4. In the Google Cloud console, on the project selector page, select or create a Google Cloud project.

    Roles required to select or create a project

    • Select a project: Selecting a project doesn't require a specific IAM role—you can select any project that you've been granted a role on.
    • Create a project: To create a project, you need the Project Creator role (roles/resourcemanager.projectCreator), which contains the resourcemanager.projects.create permission. Learn how to grant roles.

    Go to project selector

  5. Verify that billing is enabled for your Google Cloud project.

コマンドライン ツールをインストールする

このドキュメントでは、次のコマンドライン ツールを使用します。

  • gcloud
  • kubectl

gcloud ツールと kubectl ツールは Google Cloud CLI に含まれています。インストールの詳細については、Google Cloud CLI コンポーネントの管理をご覧ください。インストールされている gcloud CLI コンポーネントを確認するには、次のコマンドを実行します。

gcloud components list

gcloud CLI を使用するように構成するには、次のコマンドを実行します。

gcloud auth login
gcloud config set project PROJECT_ID

API を有効にする

Google Cloud プロジェクトで Cloud Monitoring API と Telemetry API を有効にします。テレメトリー API(telemetry.googleapis.com)に特に注意してください。この API を初めて使用する可能性があります。

次のコマンドを実行して API を有効にします。

gcloud services enable monitoring.googleapis.com
gcloud services enable telemetry.googleapis.com

クラスタの作成

GKE クラスタを作成する。

  1. 次のコマンドを実行して、otlp-test という名前の Google Kubernetes Engine クラスタを作成します。

    gcloud container clusters create-auto --location CLUSTER_LOCATION otlp-test --project PROJECT_ID
    
  2. クラスタを作成したら、次のコマンドを実行してクラスタに接続します。

    gcloud container clusters get-credentials otlp-test --region CLUSTER_LOCATION --project PROJECT_ID
    

Kubernetes サービス アカウントを承認する

次のコマンドは、必要な Identity and Access Management(IAM)ロールを Kubernetes サービス アカウントに付与します。これらのコマンドは、Workload Identity Federation for GKE を使用していることを前提としています。

export PROJECT_NUMBER=$(gcloud projects describe PROJECT_ID --format="value(projectNumber)")

gcloud projects add-iam-policy-binding projects/PROJECT_ID \
  --role=roles/logging.logWriter \
  --member=principal://iam.googleapis.com/projects/$PROJECT_NUMBER/locations/global/workloadIdentityPools/PROJECT_ID.svc.id.goog/subject/ns/opentelemetry/sa/opentelemetry-collector \
  --condition=None

gcloud projects add-iam-policy-binding projects/PROJECT_ID \
  --role=roles/monitoring.metricWriter \
  --member=principal://iam.googleapis.com/projects/$PROJECT_NUMBER/locations/global/workloadIdentityPools/PROJECT_ID.svc.id.goog/subject/ns/opentelemetry/sa/opentelemetry-collector \
  --condition=None

gcloud projects add-iam-policy-binding projects/PROJECT_ID \
  --role=roles/telemetry.tracesWriter \
  --member=principal://iam.googleapis.com/projects/$PROJECT_NUMBER/locations/global/workloadIdentityPools/PROJECT_ID.svc.id.goog/subject/ns/opentelemetry/sa/opentelemetry-collector \
  --condition=None

サービス アカウントの形式が異なる場合は、Google Cloud Managed Service for Prometheus のドキュメントにあるコマンドを使用して、次の変更を加えてサービス アカウントを承認できます。

  • サービス アカウント名 gmp-test-sa を実際のサービス アカウントに置き換えます。
  • roles/monitoring.metricWriter ロールだけでなく、前のコマンドセットに示されているロールを付与します。

OpenTelemetry Collector をデプロイする

次の YAML ファイルのコピーを作成し、collector.yaml という名前のファイルに配置して、コレクタ構成を作成します。次の構成は、GitHub の otlp-k8s-ingest リポジトリにもあります。

コピーでは、${GOOGLE_CLOUD_PROJECT} の出現箇所をプロジェクト ID PROJECT_ID に置き換えてください。

Prometheus 指標の OTLP は、OpenTelemetry Collector バージョン 0.140.0 以降を使用する場合にのみ機能します。

# Copyright 2024 Google LLC
#
# Licensed under the Apache License, Version 2.0 (the "License");
# you may not use this file except in compliance with the License.
# You may obtain a copy of the License at
#
#     http://www.apache.org/licenses/LICENSE-2.0
#
# Unless required by applicable law or agreed to in writing, software
# distributed under the License is distributed on an "AS IS" BASIS,
# WITHOUT WARRANTIES OR CONDITIONS OF ANY KIND, either express or implied.
# See the License for the specific language governing permissions and
# limitations under the License.

exporters:
  # The googlecloud exporter is used for logs
  googlecloud:
    log:
      default_log_name: opentelemetry-collector
    user_agent: Google-Cloud-OTLP manifests:0.4.0 OpenTelemetry Collector Built By Google/0.128.0 (linux/amd64)
  googlemanagedprometheus:
    user_agent: Google-Cloud-OTLP manifests:0.4.0 OpenTelemetry Collector Built By Google/0.128.0 (linux/amd64)
  # The otlphttp exporter is used to send traces to Google Cloud Trace and
  # metrics to Google Managed Prometheus using OTLP http/proto.
  # The otlp exporter could also be used to send them using OTLP grpc
  otlphttp:
    encoding: proto
    endpoint: https://telemetry.googleapis.com
    # Use the googleclientauth extension to authenticate with Google credentials
    auth:
      authenticator: googleclientauth


extensions:
  # Standard for the collector. Used for probes.
  health_check:
    endpoint: ${env:MY_POD_IP}:13133
  # This is an auth extension that adds Google Application Default Credentials to http and gRPC requests.
  googleclientauth:


processors:
  # This filter is a standard part of handling the collector's self-observability metrics. Not related to OTLP ingestion.
  filter/self-metrics:
    metrics:
      include:
        match_type: strict
        metric_names:
        - otelcol_process_uptime
        - otelcol_process_memory_rss
        - otelcol_grpc_io_client_completed_rpcs
        - otelcol_googlecloudmonitoring_point_count

  # The recommended batch size for the OTLP endpoint is 200 metric data points.
  batch:
    send_batch_max_size: 200
    send_batch_size: 200
    timeout: 5s

  # The k8sattributes processor adds k8s resource attributes to metrics based on the source IP that sent the metrics to the collector.
  # k8s attributes are important for avoiding errors from timeseries "collisions".
  # These attributes help distinguish workloads from each other, and provide useful metadata (e.g. namespace) when querying.
  k8sattributes:
    extract:
      metadata:
      - k8s.namespace.name
      - k8s.deployment.name
      - k8s.statefulset.name
      - k8s.daemonset.name
      - k8s.cronjob.name
      - k8s.job.name
      - k8s.replicaset.name
      - k8s.node.name
      - k8s.pod.name
      - k8s.pod.uid
      - k8s.pod.start_time
    passthrough: false
    pod_association:
    - sources:
      - from: resource_attribute
        name: k8s.pod.ip
    - sources:
      - from: resource_attribute
        name: k8s.pod.uid
    - sources:
      - from: connection

  # Standard processor for gracefully degrading when overloaded to prevent OOM.
  memory_limiter:
    check_interval: 1s
    limit_percentage: 65
    spike_limit_percentage: 20

  # Standard processor for enriching self-observability metrics. Unrelated to OTLP ingestion.
  metricstransform/self-metrics:
    transforms:
    - action: update
      include: otelcol_process_uptime
      operations:
      - action: add_label
        new_label: version
        new_value: Google-Cloud-OTLP manifests:0.4.0 OpenTelemetry Collector Built By Google/0.128.0 (linux/amd64)

  # The resourcedetection processor, similar to the k8sattributes processor, enriches metrics with important metadata.
  # The gcp detector provides the cluster name and cluster location.
  resourcedetection:
    detectors: [gcp]
    timeout: 10s

  # This transform processor avoids ingestion errors if metrics contain attributes with names that are reserved for the prometheus_target resource.
  transform/collision:
    metric_statements:
    - context: datapoint
      statements:
      - set(attributes["exported_location"], attributes["location"])
      - delete_key(attributes, "location")
      - set(attributes["exported_cluster"], attributes["cluster"])
      - delete_key(attributes, "cluster")
      - set(attributes["exported_namespace"], attributes["namespace"])
      - delete_key(attributes, "namespace")
      - set(attributes["exported_job"], attributes["job"])
      - delete_key(attributes, "job")
      - set(attributes["exported_instance"], attributes["instance"])
      - delete_key(attributes, "instance")
      - set(attributes["exported_project_id"], attributes["project_id"])
      - delete_key(attributes, "project_id")

  # The relative ordering of statements between ReplicaSet & Deployment and Job & CronJob are important.
  # The ordering of these controllers is decided based on the k8s controller documentation available at
  # https://kubernetes.io/docs/concepts/workloads/controllers.
  # The relative ordering of the other controllers in this list is inconsequential since they directly
  # create pods.
  transform/aco-gke:
    metric_statements:
    - context: datapoint
      statements:
      - set(attributes["top_level_controller_type"], "ReplicaSet") where resource.attributes["k8s.replicaset.name"] != nil
      - set(attributes["top_level_controller_name"], resource.attributes["k8s.replicaset.name"]) where resource.attributes["k8s.replicaset.name"] != nil
      - set(attributes["top_level_controller_type"], "Deployment") where resource.attributes["k8s.deployment.name"] != nil
      - set(attributes["top_level_controller_name"], resource.attributes["k8s.deployment.name"]) where resource.attributes["k8s.deployment.name"] != nil
      - set(attributes["top_level_controller_type"], "DaemonSet") where resource.attributes["k8s.daemonset.name"] != nil
      - set(attributes["top_level_controller_name"], resource.attributes["k8s.daemonset.name"]) where resource.attributes["k8s.daemonset.name"] != nil
      - set(attributes["top_level_controller_type"], "StatefulSet") where resource.attributes["k8s.statefulset.name"] != nil
      - set(attributes["top_level_controller_name"], resource.attributes["k8s.statefulset.name"]) where resource.attributes["k8s.statefulset.name"] != nil
      - set(attributes["top_level_controller_type"], "Job") where resource.attributes["k8s.job.name"] != nil
      - set(attributes["top_level_controller_name"], resource.attributes["k8s.job.name"]) where resource.attributes["k8s.job.name"] != nil
      - set(attributes["top_level_controller_type"], "CronJob") where resource.attributes["k8s.cronjob.name"] != nil
      - set(attributes["top_level_controller_name"], resource.attributes["k8s.cronjob.name"]) where resource.attributes["k8s.cronjob.name"] != nil
  # For each Prometheus unknown-typed metric, which is a gauge, create a counter that is an exact copy of this metric.
  # The GCP OTLP endpoint will add appropriate the appropriate suffixes for the counter and gauge.
  transform/unknown-counter:
    metric_statements:
    - context: metric
      statements:
      # Copy the unknown metric, but add a suffix so we can distinguish the copy from the original.
      - copy_metric(Concat([metric.name, "unknowncounter"], ":")) where metric.metadata["prometheus.type"] == "unknown" and not HasSuffix(metric.name, ":unknowncounter")
      # Change the copy to a monotonic, cumulative sum.
      - convert_gauge_to_sum("cumulative", true) where HasSuffix(metric.name, ":unknowncounter")
      # Delete the extra suffix once we are done.
      - set(metric.name, Substring(metric.name, 0, Len(metric.name)-Len(":unknowncounter"))) where HasSuffix(metric.name, ":unknowncounter")

  # When sending telemetry to the GCP OTLP endpoint, the gcp.project_id resource attribute is required to be set to your project ID.
  resource/gcp_project_id:
    attributes:
    - key: gcp.project_id
      # MAKE SURE YOU REPLACE THIS WITH YOUR PROJECT ID
      value: ${GOOGLE_CLOUD_PROJECT}
      action: insert
  # The metricstarttime processor is important to include if you are using the prometheus receiver to ensure the start time is set properly.
  # It is a no-op otherwise.
  metricstarttime:
    strategy: subtract_initial_point

receivers:
  # This collector is configured to accept OTLP metrics, logs, and traces, and is designed to receive OTLP from workloads running in the cluster.
  otlp:
    protocols:
      grpc:
        endpoint: ${env:MY_POD_IP}:4317
      http:
        cors:
          allowed_origins:
          - http://*
          - https://*
        endpoint: ${env:MY_POD_IP}:4318

  # Push the collector's own self-observability metrics to the otlp receiver.
  otlp/self-metrics:
    protocols:
      grpc:
        endpoint: ${env:MY_POD_IP}:14317

service:
  extensions:
  - health_check
  - googleclientauth
  pipelines:
    # Recieve OTLP logs, and export logs using the googlecloud exporter.
    logs:
      exporters:
      - googlecloud
      processors:
      - k8sattributes
      - resourcedetection
      - memory_limiter
      - batch
      receivers:
      - otlp
    # Recieve OTLP metrics, and export metrics to GMP using the otlphttp exporter.
    metrics/otlp:
      exporters:
      - otlphttp
      processors:
      - k8sattributes
      - memory_limiter
      - resource/gcp_project_id
      - resourcedetection
      - transform/collision
      - transform/aco-gke
      - transform/unknown-counter
      - metricstarttime
      - batch
      receivers:
      - otlp
    # Scrape self-observability Prometheus metrics, and export metrics to GMP using the otlphttp exporter.
    metrics/self-metrics:
      exporters:
      - otlphttp
      processors:
      - filter/self-metrics
      - metricstransform/self-metrics
      - k8sattributes
      - memory_limiter
      - resource/gcp_project_id
      - resourcedetection
      - batch
      receivers:
      - otlp/self-metrics
    # Recieve OTLP traces, and export traces using the otlphttp exporter.
    traces:
      exporters:
      - otlphttp
      processors:
      - k8sattributes
      - memory_limiter
      - resource/gcp_project_id
      - resourcedetection
      - batch
      receivers:
      - otlp
  telemetry:
    logs:
      encoding: json
    metrics:
      readers:
      - periodic:
          exporter:
            otlp:
              protocol: grpc
              endpoint: ${env:MY_POD_IP}:14317

デプロイされた OpenTelemetry Collector を構成する

Kubernetes リソースを作成して、コレクタのデプロイを構成します。

  1. 次のコマンドを実行して、opentelemetry Namespace を作成し、Namespace にコレクタ構成を作成します。

    kubectl create namespace opentelemetry
    
    kubectl create configmap collector-config -n opentelemetry --from-file=collector.yaml
    
  2. 次のコマンドを実行して、Kubernetes リソースでコレクタを構成します。

    kubectl apply -f https://raw.githubusercontent.com/GoogleCloudPlatform/otlp-k8s-ingest/refs/heads/otlpmetric/k8s/base/2_rbac.yaml
    
    kubectl apply -f https://raw.githubusercontent.com/GoogleCloudPlatform/otlp-k8s-ingest/refs/heads/otlpmetric/k8s/base/3_service.yaml
    
    kubectl apply -f https://raw.githubusercontent.com/GoogleCloudPlatform/otlp-k8s-ingest/refs/heads/otlpmetric/k8s/base/4_deployment.yaml
    
    kubectl apply -f https://raw.githubusercontent.com/GoogleCloudPlatform/otlp-k8s-ingest/refs/heads/otlpmetric/k8s/base/5_hpa.yaml
    
  3. コレクタ Pod が「実行中」になり、1/1 コンテナの準備が整うまで待ちます。Autopilot では、最初のワークロードをデプロイする場合、これに約 3 分かかります。Pod を確認するには、次のコマンドを使用します。

    kubectl get po -n opentelemetry -w
    

    Pod のステータスの監視を停止するには、Ctrl+C キーを押してコマンドを停止します。

  4. コレクタログを調べて、明らかなエラーがないことを確認することもできます。

    kubectl logs -n opentelemetry deployment/opentelemetry-collector
    

テレメトリー生成ツールをデプロイする

オープンソースの telemetrygen ツールを使用して構成をテストできます。このアプリはテレメトリーを生成し、コレクタに送信します。

  1. opentelemetry-demo Namespace に telemetrygen アプリをデプロイするには、次のコマンドを実行します。

    kubectl apply -f https://raw.githubusercontent.com/GoogleCloudPlatform/otlp-k8s-ingest/refs/heads/main/sample/app.yaml
    
  2. デプロイを作成した後、Pod が作成されて実行を開始するまでに時間がかかることがあります。Pod のステータスを確認するには、次のコマンドを実行します。

    kubectl get po -n opentelemetry-demo -w
    

    Pod のステータスの監視を停止するには、Ctrl+C キーを押してコマンドを停止します。

Metrics Explorer を使用して指標をクエリする

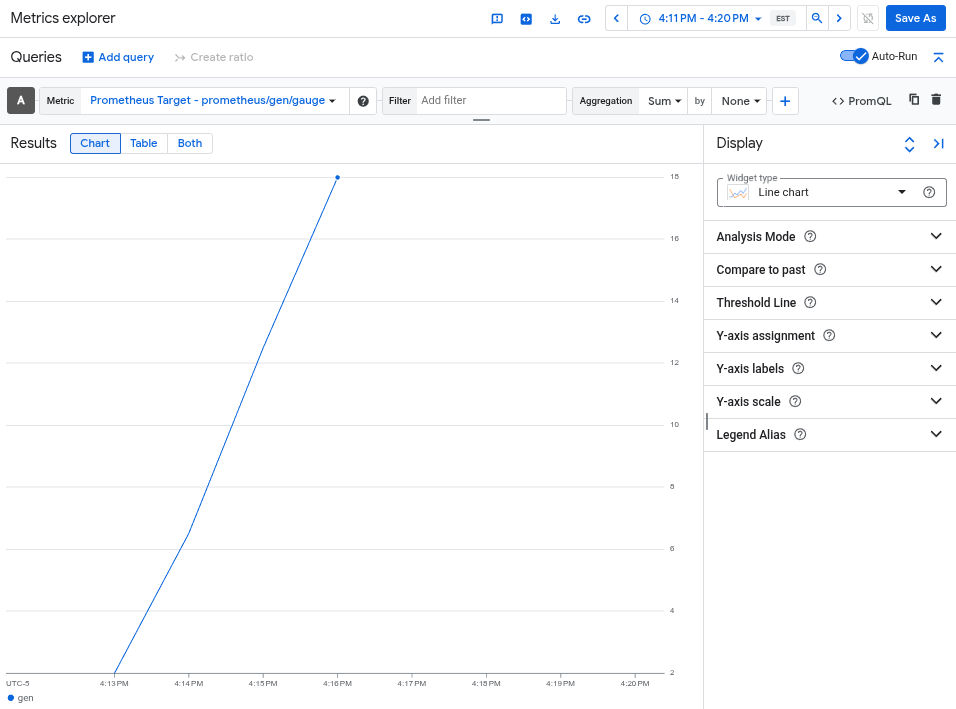
telemetrygen ツールは、gen という指標に書き込みます。この指標は、Metrics Explorer のクエリビルダー インターフェースと PromQL クエリエディタの両方からクエリできます。

Google Cloud コンソールで Metrics explorer のページに移動します。

[Metrics Explorer] に移動

検索バーを使用してこのページを検索する場合は、小見出しが [Monitoring] である結果を選択します。

  • Metrics Explorer のクエリビルダー インターフェースを使用する場合、指標の完全名は prometheus.googleapis.com/gen/gauge です。
  • PromQL クエリ エディタを使用する場合は、名前 gen を使用して指標をクエリできます。

次の図は、Metrics Explorer の gen 指標のグラフを示しています。

グラフには、otlphttp エクスポータによってキャプチャされた gen 指標が表示されます。

クラスタの削除

指標をクエリしてデプロイを確認したら、クラスタを削除できます。クラスタを削除するには、次のコマンドを実行します。

gcloud container clusters delete --location CLUSTER_LOCATION otlp-test --project PROJECT_ID

次のステップ