
本教程介绍如何使用 Google 构建的 OpenTelemetry 收集器作为边车,编写、部署和调用向 Google Cloud Managed Service for Prometheus 报告自定义 OTLP 指标的 Cloud Run 服务。如需了解 Google 构建的收集器,请参阅 Google 构建的 OpenTelemetry 收集器概览。
如果您有报告 Prometheus 指标的 Cloud Run 服务,请改用适用于 Cloud Run 的 Prometheus 边车。
目标
- 使用 Google 构建的 OpenTelemetry 收集器作为边车,编写、构建服务并将其部署到 Cloud Run。
- 生成自定义指标并将其报告给 Google Cloud Managed Service for Prometheus。
费用
在本文档中,您将使用 Google Cloud的以下收费组件:
如需根据您的预计使用量来估算费用,请使用价格计算器。
准备工作
- Sign in to your Google Cloud account. If you're new to Google Cloud, create an account to evaluate how our products perform in real-world scenarios. New customers also get $300 in free credits to run, test, and deploy workloads.
-
In the Google Cloud console, on the project selector page, select or create a Google Cloud project.
Roles required to select or create a project
- Select a project: Selecting a project doesn't require a specific IAM role—you can select any project that you've been granted a role on.
-
Create a project: To create a project, you need the Project Creator role
(
roles/resourcemanager.projectCreator), which contains theresourcemanager.projects.createpermission. Learn how to grant roles.
-
Verify that billing is enabled for your Google Cloud project.
-
Enable the Cloud Run, Cloud Monitoring, Artifact Registry, and Cloud Build APIs.
Roles required to enable APIs
To enable APIs, you need the Service Usage Admin IAM role (
roles/serviceusage.serviceUsageAdmin), which contains theserviceusage.services.enablepermission. Learn how to grant roles. - 安装并初始化 gcloud CLI。
- 更新 Google Cloud CLI:
gcloud components update -
Cloud Build Editor (
roles/cloudbuild.builds.editor) -
Cloud Run Admin (
roles/run.admin) -
Create Service Accounts (
roles/iam.serviceAccountCreator) -
Project IAM Admin (
roles/resourcemanager.projectIamAdmin) -
Monitoring Metric Writer (
roles/monitoring.metricWriter) -
Service Account User (
roles/iam.serviceAccountUser) -
Service Usage Consumer (
roles/serviceusage.serviceUsageConsumer) -
Storage Admin (
roles/storage.admin)
所需的角色
如需获得完成本教程所需的权限,请让您的管理员为您授予项目的以下 IAM 角色:
如需详细了解如何授予角色,请参阅管理对项目、文件夹和组织的访问权限。
另请注意,Cloud Run 服务身份需要 Monitoring Metric Writer (roles/monitoring.metricWriter) 角色。默认情况下,Compute Engine 默认服务账号可能具有此角色,但如果您更改了此账号的权限或使用其他服务账号,则可能需要添加此角色。
设置 gcloud 默认值
要配置您的 Cloud Run 服务的 gcloud 默认值,请执行以下操作:
设置默认项目:
gcloud config set project PROJECT_ID
将 PROJECT_ID 替换为您在本教程中创建的项目的名称。
为您选择的区域配置 gcloud:
gcloud config set run/region REGION
将 REGION 替换为您选择的受支持的 Cloud Run 区域。
Cloud Run 位置
Cloud Run 是区域级的,这意味着运行 Cloud Run 服务的基础架构位于特定区域,并且由 Google 代管,以便在该区域内的所有可用区以冗余方式提供。
选择用于运行 Cloud Run 服务的区域时,主要考虑该区域能否满足您的延迟时间、可用性或耐用性要求。通常,您可以选择距离用户最近的区域,但除此之外,您还应该考虑 Cloud Run 服务使用的其他 Google Cloud产品的位置。跨多个位置使用 Google Cloud 产品可能会影响服务的延迟时间和费用。
Cloud Run 可在以下区域使用:
基于层级 1 价格
asia-east1(台湾)asia-northeast1(东京)asia-northeast2(大阪)asia-south1(印度孟买)europe-north1(芬兰) 二氧化碳排放量低
europe-north2(斯德哥尔摩) 二氧化碳排放量低
europe-southwest1(马德里) 二氧化碳排放量低
europe-west1(比利时) 二氧化碳排放量低
europe-west4(荷兰) 二氧化碳排放量低
europe-west8(米兰)europe-west9(巴黎) 二氧化碳排放量低
me-west1(特拉维夫)northamerica-south1(墨西哥)us-central1(爱荷华) 二氧化碳排放量低
us-east1(南卡罗来纳)us-east4(北弗吉尼亚)us-east5(哥伦布)us-south1(达拉斯) 二氧化碳排放量低
us-west1(俄勒冈) 二氧化碳排放量低
基于层级 2 价格
africa-south1(约翰内斯堡)asia-east2(香港)asia-northeast3(韩国首尔)asia-southeast1(新加坡)asia-southeast2(雅加达)asia-south2(印度德里)australia-southeast1(悉尼)australia-southeast2(墨尔本)europe-central2(波兰,华沙)europe-west10(柏林)europe-west12(都灵)europe-west2(英国伦敦) 二氧化碳排放量低
europe-west3(德国法兰克福)europe-west6(瑞士苏黎世) 二氧化碳排放量低
me-central1(多哈)me-central2(达曼)northamerica-northeast1(蒙特利尔) 二氧化碳排放量低
northamerica-northeast2(多伦多) 二氧化碳排放量低
southamerica-east1(巴西圣保罗) 二氧化碳排放量低
southamerica-west1(智利圣地亚哥) 二氧化碳排放量低
us-west2(洛杉矶)us-west3(盐湖城)us-west4(拉斯维加斯)
如果您已创建 Cloud Run 服务,可在Google Cloud 控制台的 Cloud Run 信息中心内查看区域。
创建 Artifact Registry 映像代码库
创建 Artifact Registry Docker 代码库以托管示例服务映像:
gcloud artifacts repositories create run-otel \
    --repository-format=docker \
    --location=REGION \
    --project=PROJECT_ID
请替换以下内容:
- 将 PROJECT_ID 替换为您在本教程中创建的项目的名称。
- 将 REGION 替换为您选择的受支持的 Cloud Run 区域。
检索代码示例
如需检索可用的代码示例,请执行以下操作:
将示例应用代码库克隆到本地机器:
Go
git clone https://github.com/GoogleCloudPlatform/golang-samples.git
或者,您也可以下载该示例的 zip 文件并将其解压缩。
切换到包含 Cloud Run 示例代码的目录:
Go
cd golang-samples/run/custom-metrics/
查看代码
本教程中使用的代码包含以下部分:
- 处理传入请求并生成名为
sidecar_sample_counter_total的指标的服务器。
- 用于定义服务的操作环境的
Dockerfile。
该示例还在 collector 子目录下包含用于构建自定义收集器的文件:
收集器的配置文件。
将提供的配置捆绑到上游 Collector 映像的
Dockerfile。
交付代码
交付代码包括三个步骤:使用 Cloud Build 构建容器映像、将容器映像上传到 Artifact Registry,以及将容器映像部署到 Cloud Run。
如需交付代码,请执行以下操作:
-
构建示例服务容器并将其发布到 Artifact Registry 上:
gcloud builds submit --tag REGION-docker.pkg.dev/PROJECT_ID/run-otel/sample-metrics-app
成功完成后,您应该会看到一条包含 ID、创建时间和映像名称的 SUCCESS 消息。该映像存储在 Artifact Registry 中,并可根据需要重复使用。
-
构建收集器容器并将其发布到 Artifact Registry 上:
gcloud builds submit collector --tag REGION-docker.pkg.dev/PROJECT_ID/run-otel/otel-collector-metrics
成功完成后,您应该会看到一条包含 ID、创建时间和映像名称的 SUCCESS 消息。该映像存储在 Artifact Registry 中,并可根据需要重复使用。
-
部署应用:
YAML
-
创建名为
service.yaml且包含以下内容的新文件:apiVersion: serving.knative.dev/v1 kind: Service metadata: name: SERVICE-NAME annotations: run.googleapis.com/launch-stage: BETA spec: template: metadata: annotations: run.googleapis.com/container-dependencies: "{app:[collector]}" spec: containers: - image: REGION-docker.pkg.dev/PROJECT_ID/run-otel/sample-metrics-app name: app ports: - containerPort: CONTAINER_PORT env: - name: "OTEL_EXPORTER_OTLP_ENDPOINT" value: "http://localhost:4317" - image: REGION-docker.pkg.dev/PROJECT_ID/run-otel/otel-collector-metrics name: collector startupProbe: httpGet: path: / port: 13133 - 替换以下内容:
- 将 CONTAINER_PORT 替换为服务的入站流量容器监听的端口。默认情况下为
8080。 - 将 SERVICE-NAME 替换为您的服务的名称,例如
custom-metrics-sample-service。
- 将 CONTAINER_PORT 替换为服务的入站流量容器监听的端口。默认情况下为
-
-
使用以下命令创建新服务:
gcloud run services replace service.yaml
此命令会返回服务网址。使用此网址试用试用中的示例应用。
测试
使用交付代码中 gcloud run 命令的网址连接到服务以生成一些示例指标(您可以多次运行此命令以生成更有用的数据):
curl -H \
"Authorization: Bearer $(gcloud auth print-identity-token)" \
SERVICE_URL
将 SERVICE_URL 替换为您的服务的网址。
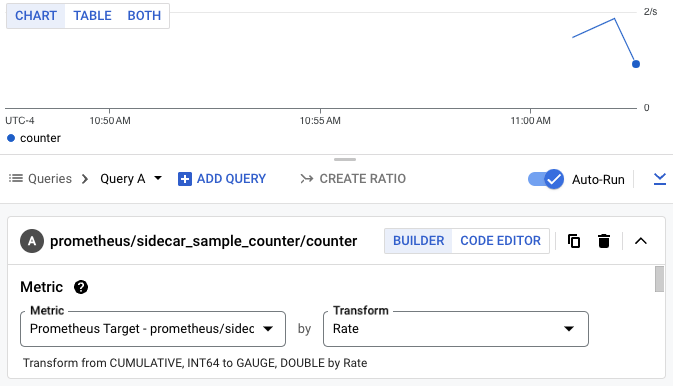
接下来,前往 Google Cloud 控制台的 Cloud Monitoring 部分中的 Metrics Explorer,然后选择 sidecar_sample_counter_total 指标。
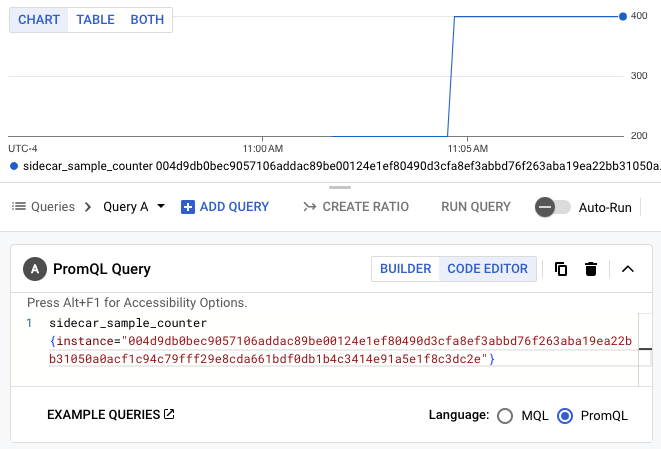
您还可以使用 PromQL 查询指标。例如,以下查询将根据 Cloud Run 实例 ID 过滤指标:
sidecar_sample_counter_total{instance="INSTANCE_ID"}
将 INSTANCE_ID 替换为服务的任何实例的 ID(可在实例日志中或从元数据服务器中找到)。
此查询会生成如下所示的图表:
清理
为避免您的 Google Cloud 账号产生额外费用,请删除您在本教程中部署的所有资源。
删除项目
如果您为本教程创建了一个新项目,请删除项目。 如果您使用的是某个现有项目,并且需要保留此项目但不保留在本教程中所做的更改,请删除为本教程创建的资源。
为了避免产生费用,最简单的方法是删除您为本教程创建的项目。
要删除项目,请执行以下操作:
- In the Google Cloud console, go to the Manage resources page.
- In the project list, select the project that you want to delete, and then click Delete.
- In the dialog, type the project ID, and then click Shut down to delete the project.
删除教程资源
删除您在本教程中部署的 Cloud Run 服务。Cloud Run 服务在收到请求之前不会产生费用。
如需删除 Cloud Run 服务,请运行以下命令:
gcloud run services delete SERVICE-NAME
将 SERVICE-NAME 替换为服务的名称。
您还可以通过Google Cloud 控制台删除 Cloud Run 服务。
移除您在教程设置过程中添加的
gcloud默认区域配置:gcloud config unset run/region移除项目配置:
gcloud config unset project删除在本教程中创建的其他 Google Cloud 资源:
后续步骤
GitHub 上提供了更多示例(包括跟踪记录和日志的示例)。