
This document shows you how to view TPU metrics on the Ray Dashboard with KubeRay on Google Kubernetes Engine (GKE). In a GKE cluster with the Ray GKE add-on, TPU metrics are available in Cloud Monitoring.
Before you begin
Before you start, make sure that you have performed the following tasks:
- Enable the Google Kubernetes Engine API. Enable Google Kubernetes Engine API
- If you want to use the Google Cloud CLI for this task,
install and then
initialize the
gcloud CLI. If you previously installed the gcloud CLI, get the latest
version by running the
gcloud components updatecommand. Earlier gcloud CLI versions might not support running the commands in this document.
You have a GKE cluster that meets the following conditions:
- A node pool configured to use TPUs.
- The Ray on GKE add-on must not be enabled on this cluster.
- A serving or training workload on GKE using Ray and TPUs.
If you need to create a cluster with these conditions, choose an example TPU workload such as Train an LLM using JAX, Ray Train, and TPU Trillium on GKE or the Serve an LLM using TPUs on GKE with KubeRay and follow the setup steps to configure a cluster.
Prepare your environment
In this tutorial you will use Cloud Shell, which is a shell environment for managing resources hosted on Google Cloud.
Cloud Shell comes preinstalled with the
Google Cloud CLI
and kubectl
command-line tool. The gcloud CLI provides the primary command-line
interface for Google Cloud, and kubectl provides the primary command-line
interface for running commands against Kubernetes clusters.
Launch Cloud Shell:
Go to the Google Cloud console.
From the upper-right corner of the console, click the Activate Cloud Shell button:

A Cloud Shell session opens inside a frame lower on the console.
You use this shell to run gcloud and kubectl commands.
Before you run commands, set your default project in the Google Cloud CLI
using the following command:
gcloud config set project PROJECT_ID
Replace PROJECT_ID with your project ID.
View TPU metrics on the Ray Dashboard
To view TPU metrics on the Ray Dashboard, do the following:
In your shell, enable metrics in the Ray Dashboard by installing the Kubernetes Prometheus Stack.
./install/prometheus/install.sh --auto-load-dashboard true
kubectl get all -n prometheus-system
The output is similar to the following:
NAME                                                  READY   UP-TO-DATE   AVAILABLE   AGE
deployment.apps/prometheus-grafana                    1/1     1            1           46s
deployment.apps/prometheus-kube-prometheus-operator   1/1     1            1           46s
deployment.apps/prometheus-kube-state-metrics         1/1     1            1           46s
This installation uses a Helm chart to add the Custom Resource Definitions (CRDs), a Pod Monitor, and a Service Monitor for Ray Pods to your cluster.
Install KubeRay operator v1.5.0 or later with metrics scraping enabled. To view TPU metrics in Grafana with the default dashboards provided in KubeRay, you must install KubeRay v1.5.0 or later.
helm repo add kuberay https://ray-project.github.io/kuberay-helm/
helm install kuberay-operator kuberay/kuberay-operator --version 1.5.0-rc.0 \
    --set metrics.serviceMonitor.enabled=true \
    --set metrics.serviceMonitor.selector.release=prometheus
Install the KubeRay TPU webhook. This webhook sets an environment variable
TPU_DEVICE_PLUGIN_HOST_IPthat Ray uses to poll TPU metrics from thetpu-device-pluginDaemonSet.helm install kuberay-tpu-webhook \ oci://us-docker.pkg.dev/ai-on-gke/kuberay-tpu-webhook-helm/kuberay-tpu-webhook \ --set tpuWebhook.image.tag=v1.2.6-gke.0To prepare your workload to log the metrics, set the following ports and environment variables within the RayCluster spec:
headGroupSpec:
...
ports:
...
- containerPort: 44217
  name: as-metrics
- containerPort: 44227
  name: dash-metrics
env:
- name: RAY_GRAFANA_IFRAME_HOST
  value: http://127.0.0.1:3000
- name: RAY_GRAFANA_HOST
  value: http://prometheus-grafana.prometheus-system.svc:80
- name: RAY_PROMETHEUS_HOST
  value: http://prometheus-kube-prometheus-prometheus.prometheus-system.svc:9090
Run a workload with TPUs by using Ray. You can use an example TPU workload such as Train an LLM using JAX, Ray Train, and TPU Trillium on GKE or the Serve an LLM using TPUs on GKE with KubeRay.
View the metrics in the Ray Dashboard or Grafana
To connect to the RayCluster, port-forward the Ray head service:
kubectl port-forward service/RAY_CLUSTER_NAME-head-svc 8265:8265Replace
RAY_CLUSTER_NAMEwith the name of your RayCluster. If your workload is from the Train an LLM using JAX, Ray Train, and TPU Trillium on GKE tutorial, then this value ismaxtext-tpu-cluster.To view the Ray Dashboard, navigate to
http://localhost:8265/on your local machine.Port forward the Grafana web UI. You need to port-forward Grafana to view TPU metrics which are displayed on Grafana dashboards embedded in the Ray Dashboard.
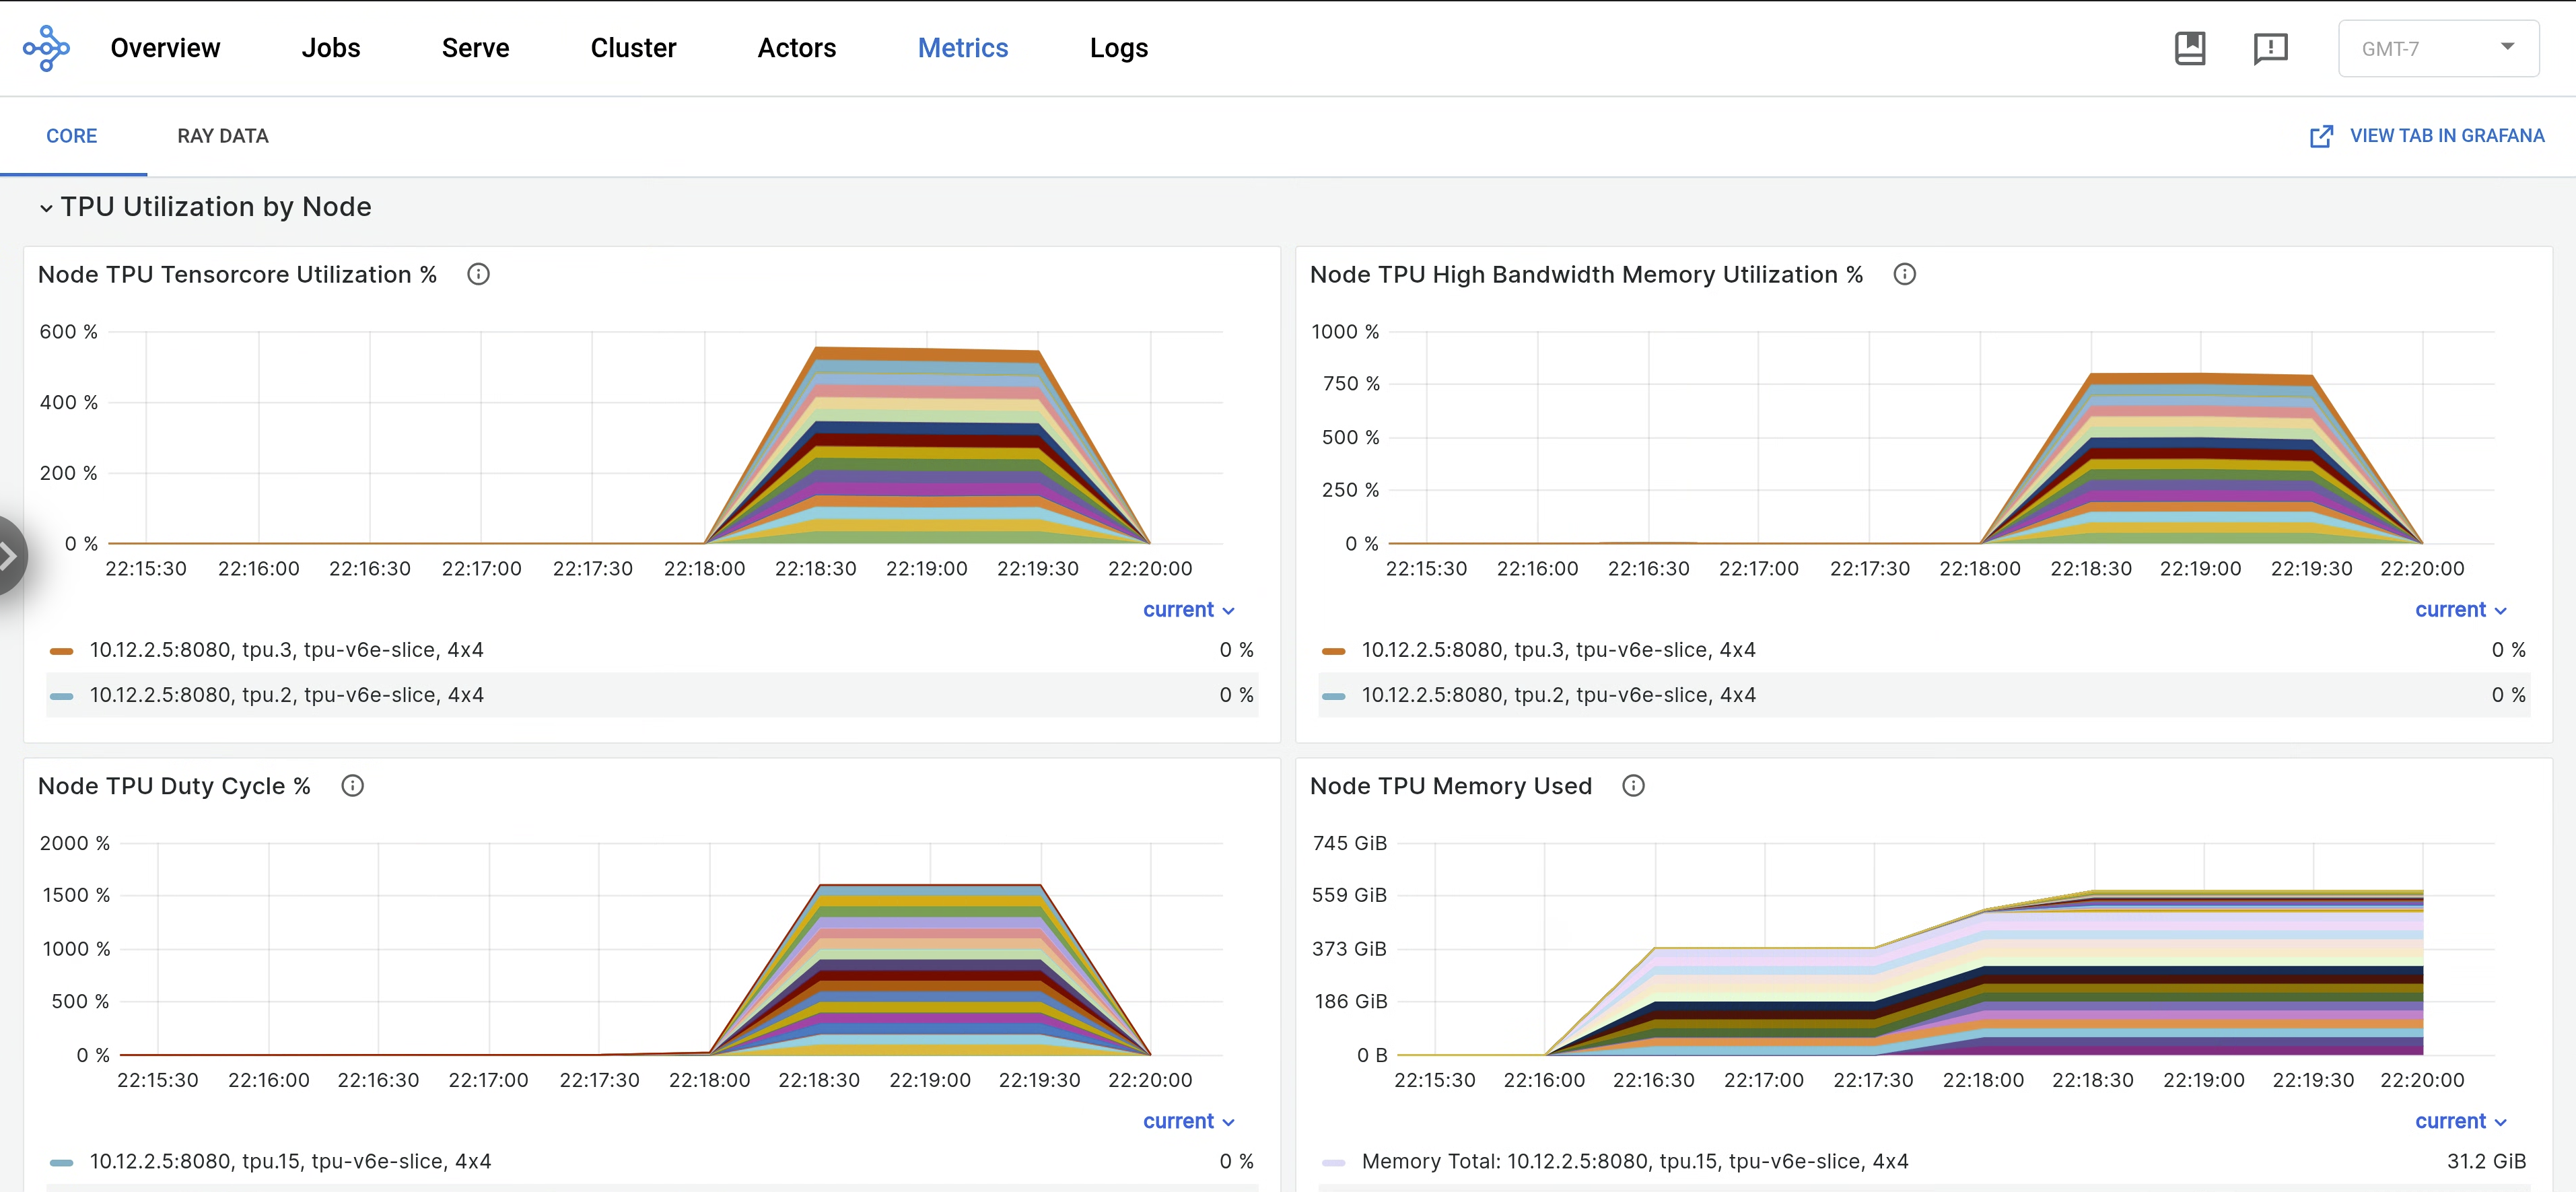
kubectl port-forward -n prometheus-system service/prometheus-grafana 3000:http-webIn the Ray Dashboard, open the Metrics tab and find the TPU Utilization by Node tab. When TPUs are running, per-node metrics for Tensor Core utilization, HBM utilization, TPU duty cycle, and memory usage are streamed to the dashboard. These metrics are viewable in Grafana by navigating to View Tab in Grafana.
To view
libtpulogs, navigate to the Logs tab on the Ray Dashboard and select the TPU node. Libtpu logs are written to the/tpu_logsdirectory.
For more information on configuring TPU logging, see Debugging TPU VM logs.
What's next
- Learn how to collect and view logs and metrics for Ray clusters on Google Kubernetes Engine (GKE).
- Learn how to view Ray Operator logs.