

Data lineage in Knowledge Catalog (formerly Dataplex Universal Catalog) lets you track how data transformations affect downstream resources and the workflows that depend on them. Tracing column-level dependencies before you modify tables helps you verify data integrity and determine whether existing pipelines require adjustments.
In this tutorial, you maintain a database that stores records about how various services provided by a healthcare provider are used. To make the data easier to use, you browse the tables to identify potential changes. Before you implement the changes, you use BigQuery Lineage Explorer to examine columns, inspect data type changes, and identify if any improvements affect existing workflows or require additional adjustments.
Get started
To complete the use case, first set up the environment and run the data transformations. Use the prerequisites and setup page to connect a remote repository to Dataform. This repository contains the code necessary to set up the dataset and transform the data.
After you finish the environment setup, use BigQuery and Lineage Explorer to track data transformations and the effect they have on the workflows.
Analyze data transformations with Lineage Explorer
After you prepare the dataset, analyze the impact of the data transformation using the BigQuery Lineage tab.
Verify column data integrity with lineage graphs
In this example, examine the medicare_participation_indicator column that indicates whether a physician or supplier agrees to provide services for Medicare. The lineage graph shows how data transformations between the derived tables result in column data type changes:
- In Google Cloud console, go to the BigQuery page.
- Use the search field to find the
physicians_and_other_supplier_2012_originaltable. - Click the Lineage tab.
- In the Lineage Explorer pane, do the following:
- In the Column Level Lineage section, select the
medicare_participation_indicatorcolumn name from the list. - In the Direction section, select the Downstream direction.
- Click Apply.
- In the Column Level Lineage section, select the
- Expand the lineage path until you reach
vertex_ai_model_final_features. Analyze the path changes between the
supplier_stg3table and thesupplier_transform1table: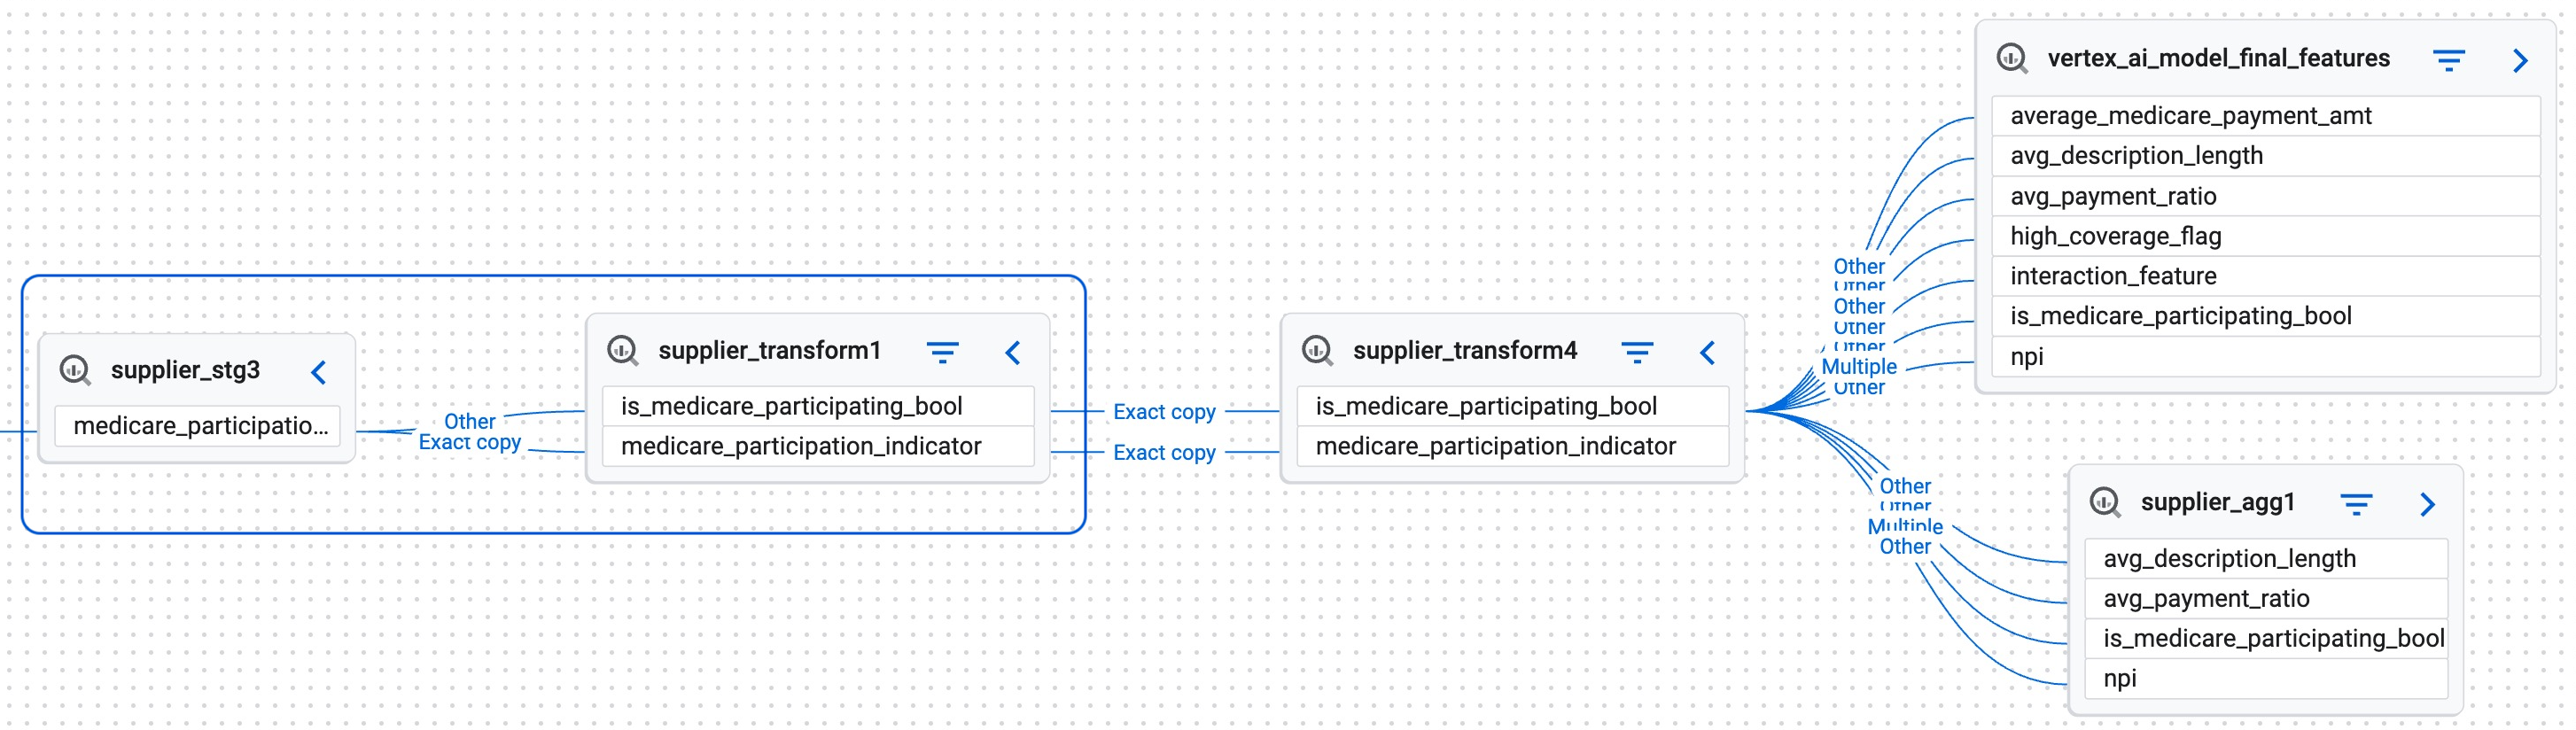
Lineage tracking visualization for medicare_participation_indicatorcolumn- Exact Copy path marking indicates that the column is passing through unchanged.
- Other path marking indicates a transformation. In this path, the data type
Stringis treated likeBoolean.
The path shows that the column data types change, which might require adjustments in the workflows that use these tables.
Identify redundant downstream columns
This example examines the nppes_credentials column that lists National Provider Identifiers the practitioners hold in the National Plan and Provider Enumeration System (NPPES):
- In Google Cloud console, go to the BigQuery page.
- Use the search field to find the
physicians_and_other_supplier_2012_originaltable. - Click the Lineage tab.
- In the Lineage Explorer pane, do the following:
- In the Column Level Lineage section, select the
nppes_credentialscolumn name from the list. - In the Direction section, select the Downstream direction.
- Click Apply.
- In the Column Level Lineage section, select the
- Expand the path to check if downstream lineage exists leading to
vertex_ai_model_final_features.
No lineage means that this column might not be relevant in this particular workflow, and can even be deleted.
For more information about visualizing data with data lineage graph, see the lineage graph view.