

This guide explains how savings calculations work before and after your migration to the new CUD program, whether you opted in early or automatically migrated. It also provides steps to validate that your savings remain consistent using the CUD analysis tool, cost reports, and BigQuery exports.
After you migrate, you might notice differences in how your savings data appears in the Cloud Billing user interface. However, your discounts did not change. Your current contractual rates are the same for the duration of your contract. As long as your usage remains the same, your total costs won't increase.
Key concepts
- Savings consistency: Your total cost won't increase as long as your usage remains the same. You might see incremental savings if you have usage on SKUs newly added to the CUDs.
- Calculation models: The mechanics for applying discounts differ between the pre-migration and post-migration models.
- Recommended tool: To see the most accurate spend-based CUD savings and effective discounts, use the CUD analysis page in the Google Cloud console.
- Cost reports: For an accurate comparison in cost reports, you must include both usage SKUs and commitment fee SKUs. This ensures your analysis covers the entire scope of the commitment offering.
Understanding calculation models
The method for calculating savings changes after migration, even though the net cost remains the same.
Pre-migration CUD model
In the pre-migration model, the system calculates savings in multiple steps. You are charged the on-demand price for your usage and a separate commitment fee. Then, the system applies a credit to offset the on-demand cost of usage. The cost reports user interface doesn't show the savings directly, instead, it shows the credits applied in the Savings column while the cost of usage of the commitment are in the Usage column. Therefore, to find your actual savings from your commitment, you must perform a manual calculation.
Post-migration CUD model
In the post-migration model, the system applies your discounted price directly to any usage covered by a commitment.
Validate savings consistency
This section uses an example scenario to explain how to confirm that your savings remain consistent, and compare your costs for a specific timeframe before and after the migration using the following steps:
- Identify your migration date (for example, 2025-10-27).
- Select a spend-based commitment to analyze (for example, Cloud SQL).
- Analyze the total cost and savings for that CUD for one day before the migration date.
- Analyze the total cost and savings for one day after the migration date.
You can use CUD analysis, Cost reports, or BigQuery export to complete this analysis.
Example: CUD analysis using Cloud SQL
This example compares pre-migration and post-migration costs for Cloud SQL using the CUD analysis tool.
Before you begin, identify your migration date.
In the Google Cloud console, go to the Billing page:
On the Billing account overview tab, see the right panel with a notification of your successful migration date as shown in the following screenshot:

For this example, the migration date is Oct 27, 2025.
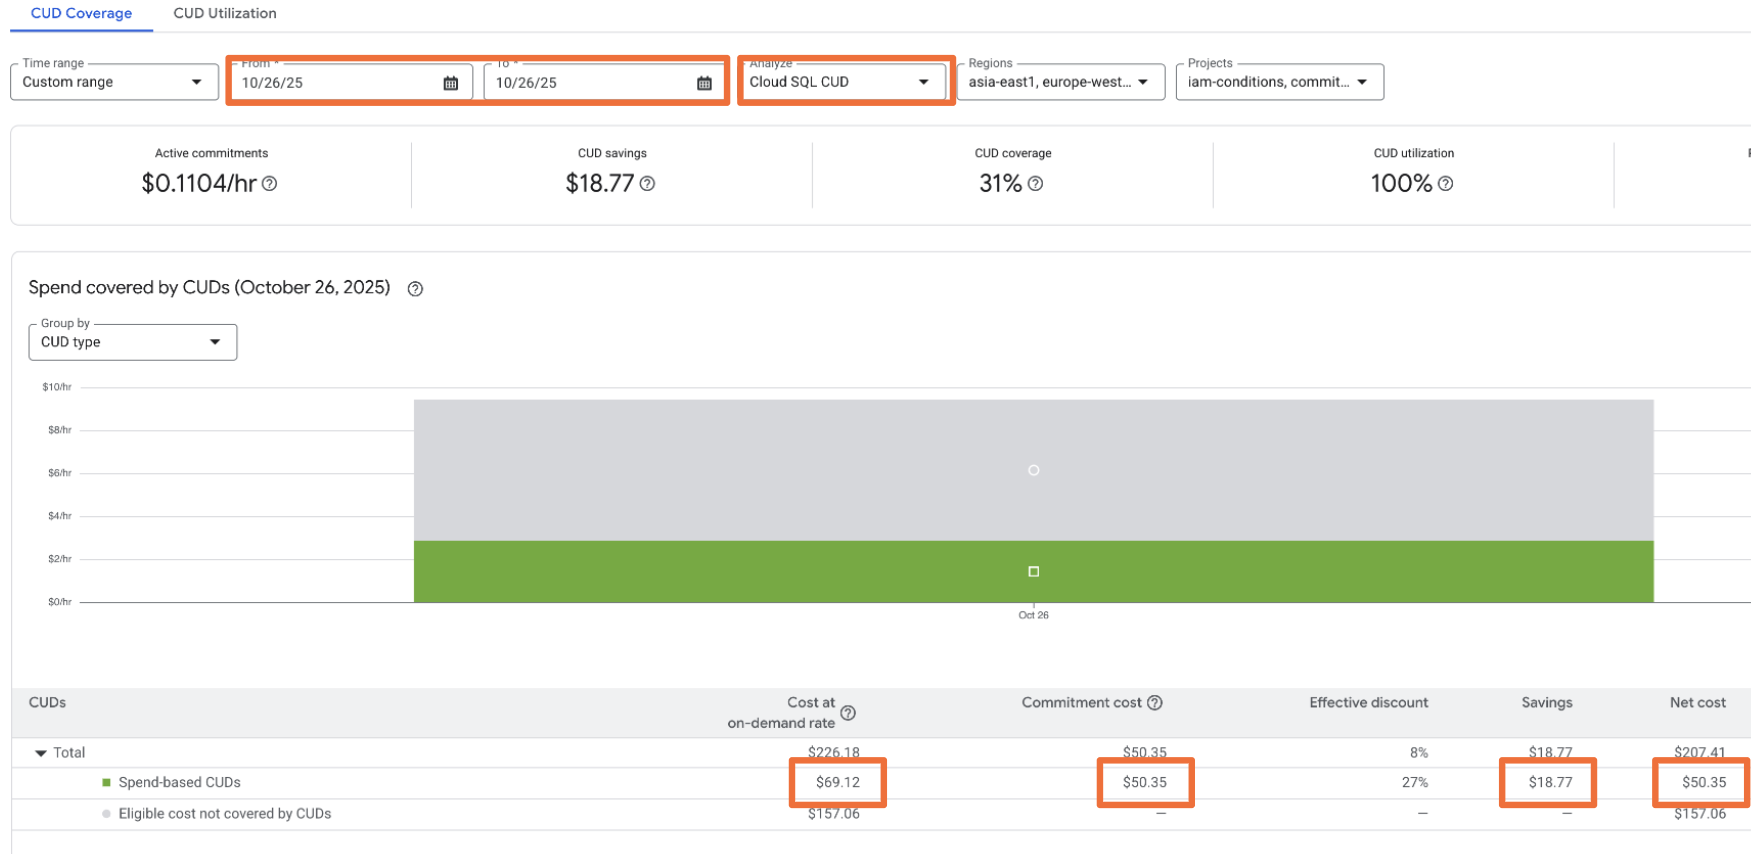
Pre-migration analysis (2025-10-26)
- Select the Cloud SQL CUD.
- Analyze the data for one day before migration.
- Cost of covered usage (on-demand): $69.12
- Commitment cost (CUD fee SKU): $50.35
- Savings: $18.77
- Net cost: $50.35
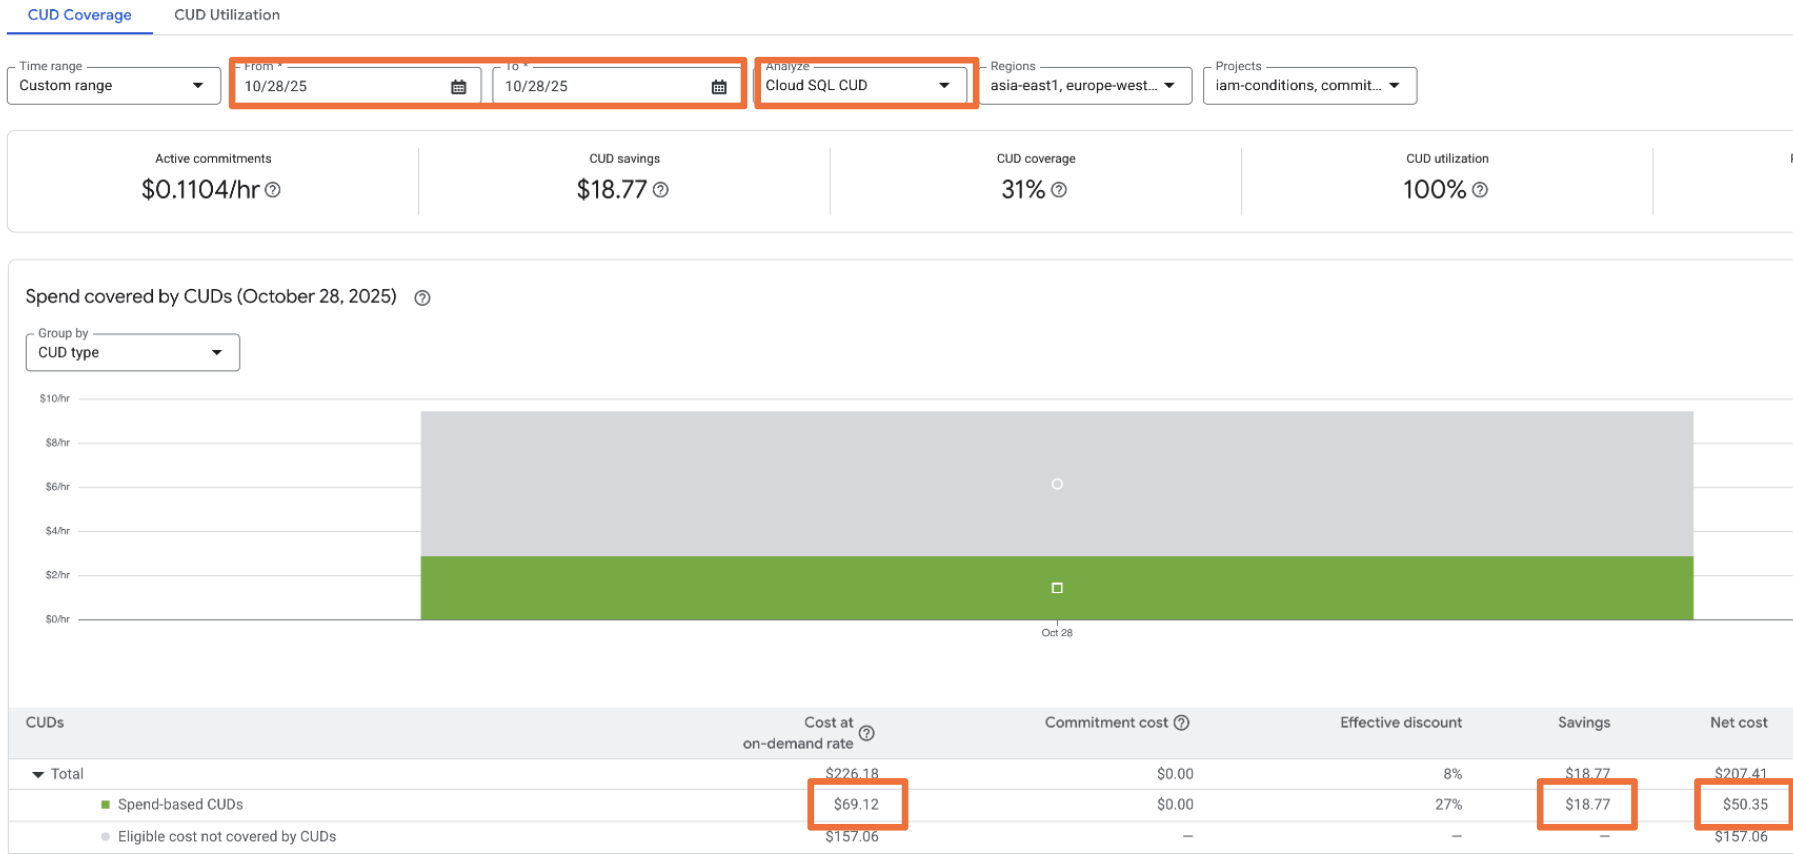
Post-migration analysis (2025-10-28)
- Analyze the data for one day after migration.
- Cost at on-demand rate: $69.12
- Cost of covered usage (discounted): $50.35
- Commitment cost: $0.00 (using this example's 100% utilization)
- Savings: $18.77 ($69.12 on-demand - $50.35 paid)
- Net cost: $50.35
Example: Cost reports
When you use cost reports, you must group data correctly to see the commitment fees. This example demonstrates how to group data in cost reports by Service and then by SKU to accurately view commitment fees and calculate your savings.
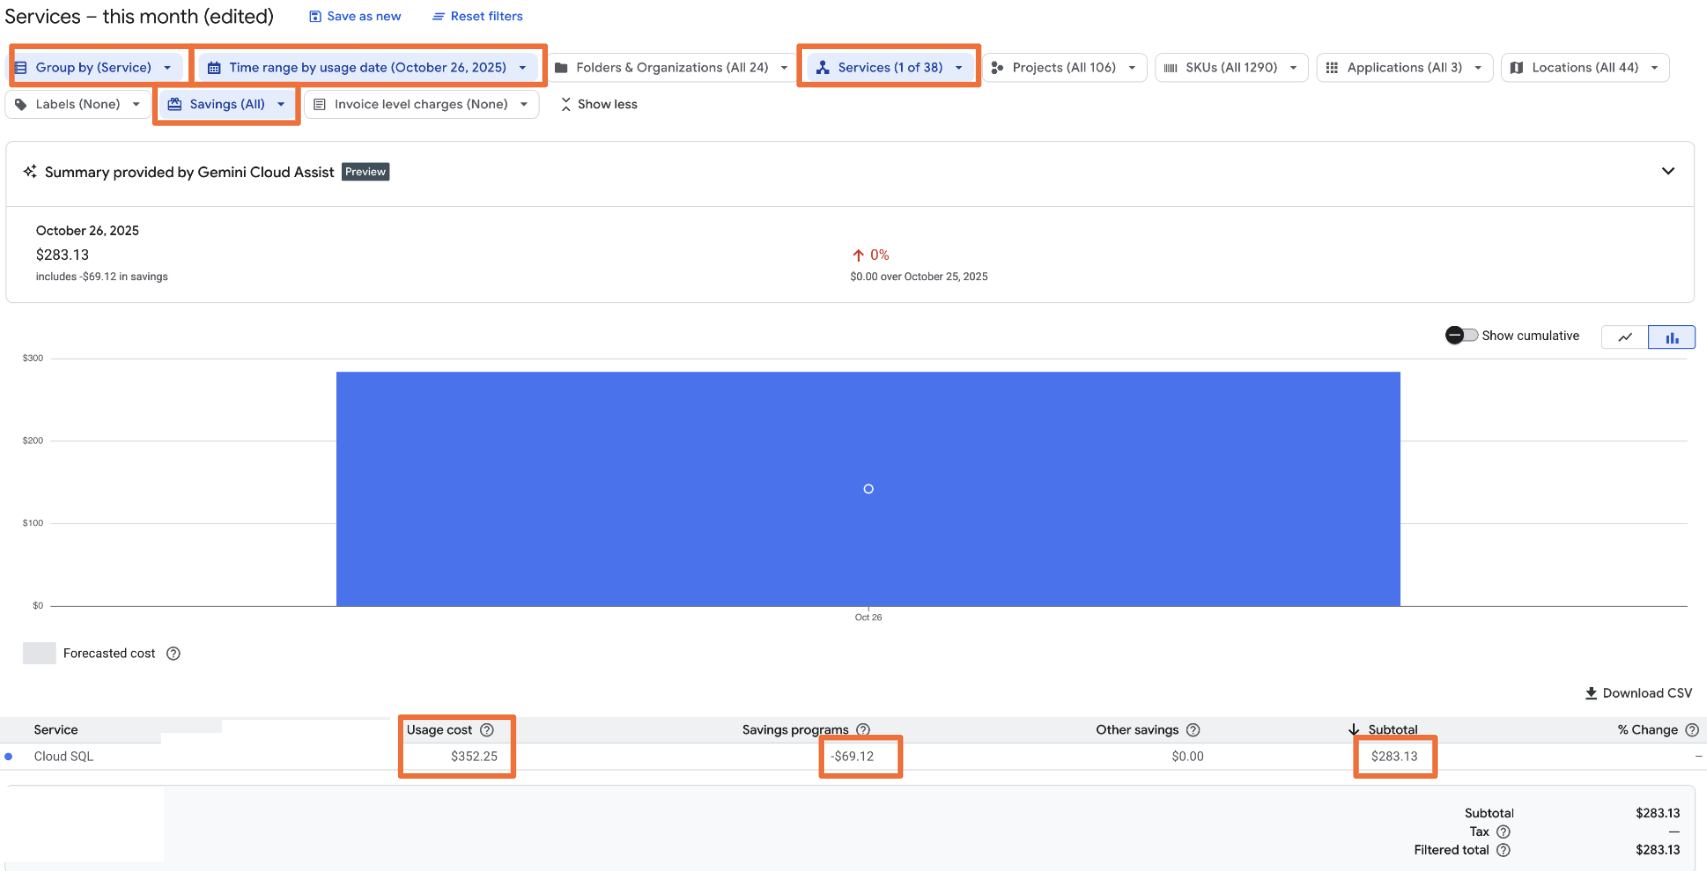
Pre-migration analysis
- Group by Service (Cloud SQL).
- Filter by Service (Cloud SQL) includes the cost of usage & commitment fee SKUs.
- Review the costs:
- Usage cost: $352.25 (This includes $50.36 in CUD fee SKUs).
- Savings programs (Credits): -$69.12.
- Net cost: $283.13.
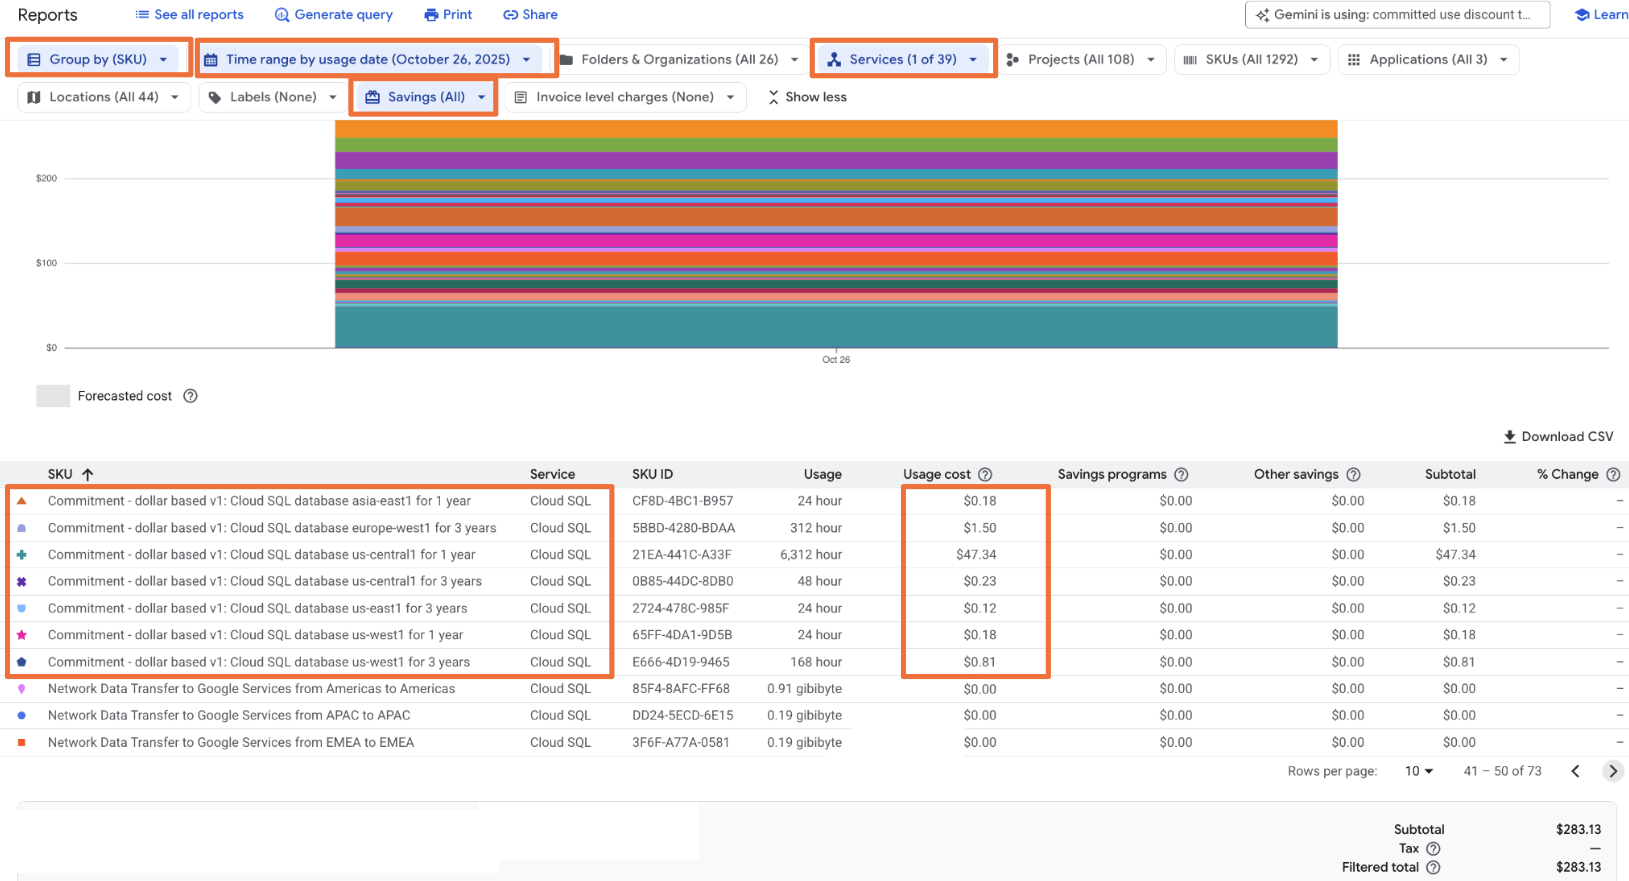
- Calculate savings (seen when grouped by SKU): $69.12 (Credits) - $50.36 (Fees) = $18.76.
In addition, group by SKU to calculate your savings and see a more detailed breakdown of the usage costs.
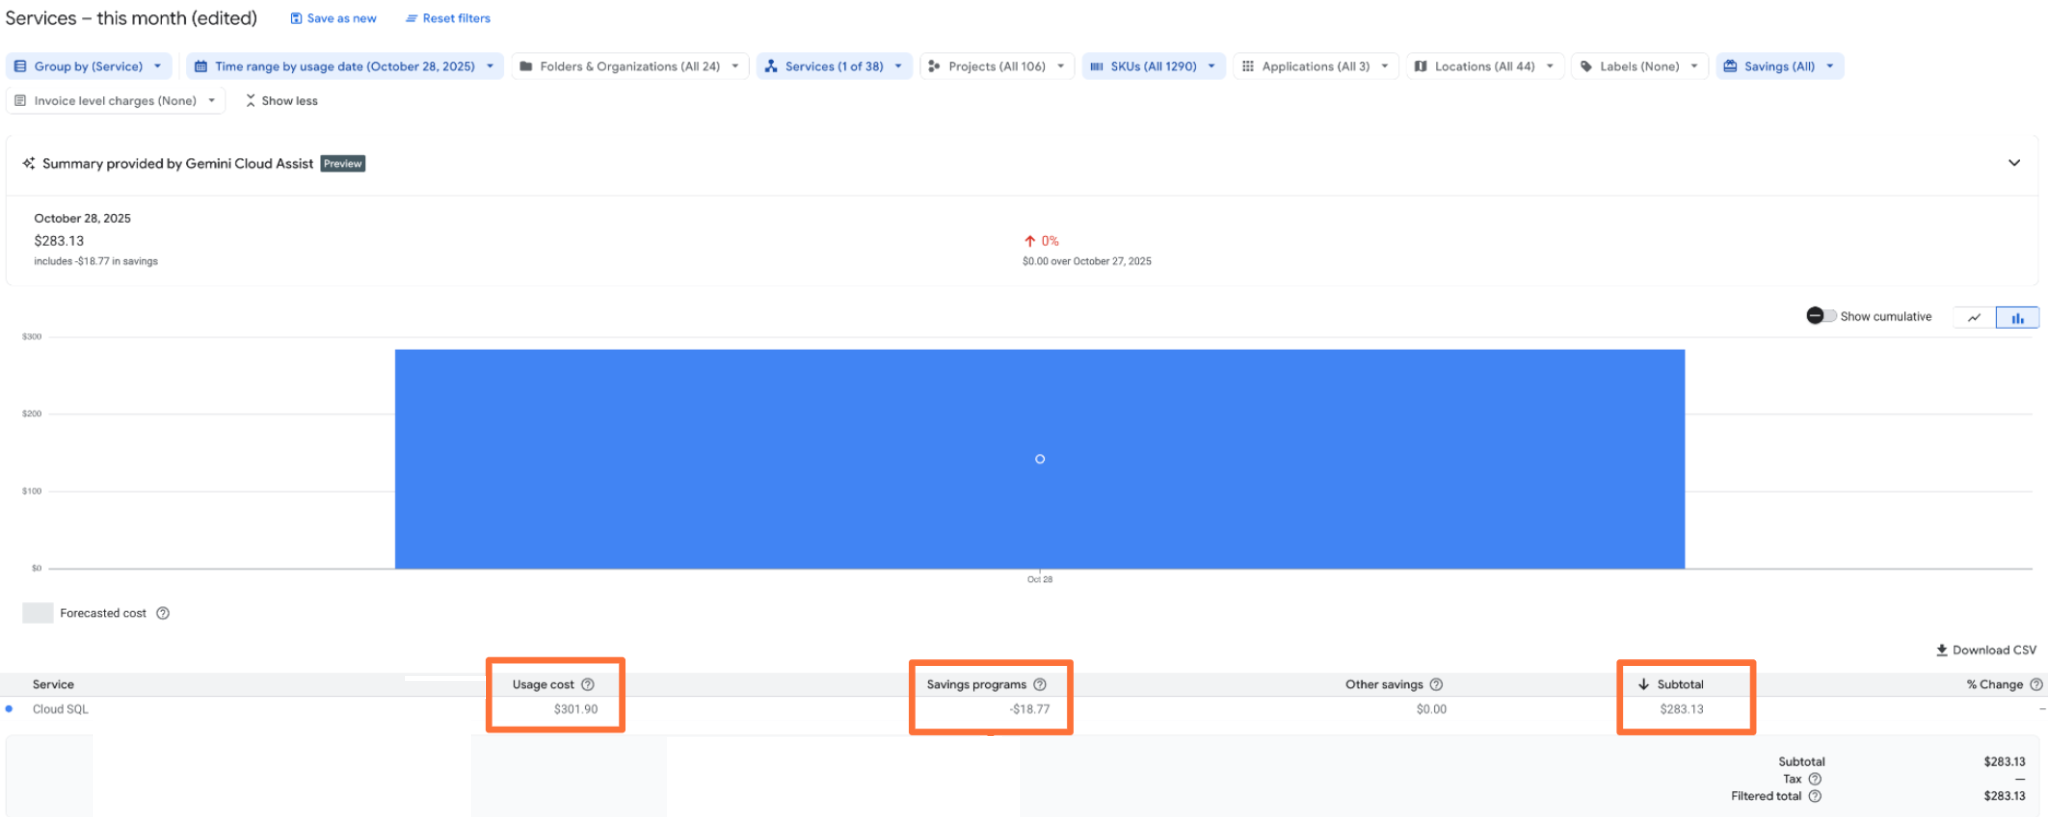
Post-migration analysis
- Group by Service (Cloud SQL).
- Filter by Service (Cloud SQL) and date (2025-10-26).
- Review the costs:
- Usage cost: $301.90 (This includes $50.36 in CUD fee SKUs).
- Savings programs (Credits): -$18.77.
- Net cost: $283.13 (the same value as the pre-migration analysis).
- The usage cost reflects the discounted prices.
- Usage SKUs receive the discount directly.
- The Savings Programs column shows the effective savings without manual calculations.
Verify discount percentages
To understand your savings, commitment utilization, and effective savings rate, you can see the discount percentages in the CUD analysis without manual calculations, or view them in the Compute flexible CUD example queries with manual calculations.
To view your effective commitment discount compared to List On-Demand Price, see Calculate your overall flexible CUDs savings.
To view your effective commitment discount compared to Contracted On-Demand Price, use
this formula: (On-demand price - Flex CUD consumption model price) / On-demand
price.
View discount percentages after migration
After you migrate to the new model, SKUs can have different usage rates based
on the consumption model you use them under.
In this example, we analyze the SKU named N2 Instance Core running in Americas
(SKU ID: BB77-5FDA-69D9). This SKU has three primary consumption models:
- On-Demand: Standard, pay-as-you-go usage (consumption model 7754-699E-0EBF).
- 1-Year Flexible CUD: Usage covered by a 1-year commitment (consumption model D97B-0795-975B).
- 3-Year Flexible CUD: Usage covered by a 3-year commitment (consumption model 70D7-D1AB-12A4).
Use the Pricing user interface to see details about the pricing for each model:
- In the Google Cloud console, go to your Cloud Billing account.
- Select Pricing from the sidebar.
Both the public list price and your contractual prices are displayed. In this example, we add two columns to show the savings ($/%) compared to the on-demand consumption model. The following table uses five formulas to calculate the dollar savings in the columns named Savings from on-demand contract rates and Savings from on-demand list rates. The calculations use the formula New Price - Baseline Price to show savings as a negative value. The accompanying percentage is then calculated by dividing that dollar saving by the baseline price.
SKU ID |
Consumption model ID |
Description |
List price ($) |
Contract price ($) |
Effective discount |
Savings from on-demand contract rates |
Savings from on-demand list rates |
|---|---|---|---|---|---|---|---|
BB77-5FDA-69D9 |
7754-699E-0EBF |
Default |
$0.03161 |
$0.02055 |
($0.03161 - $0.02055) 35% |
- |
($0.03161 - $0.02055) -$0.01106 (-35.0%) |
BB77-5FDA-69D9 |
70D7-D1AB-12A4 |
Compute Flexible CUD - 3 Year |
$0.01707 |
$0.01408 |
($0.01707 - $0.01408) 17.5% |
($0.02055 - $0.01408) -$0.00646 (-31.5%) |
($0.03161 - $0.01408) -$0.01753 (-55.5%) |
BB77-5FDA-69D9 |
D97B-0795-975B |
Compute Flexible CUD - 1 Year |
$0.02276 |
$0.01878 |
($0.02276 - $0.01878) 17.5% |
($0.02055 - $0.01878) -$0.00177 (-8.6%) |
($0.03161 - $0.01878) -$0.01283 (-40.6%) |
Savings from on-demand list rates (for on-demand usage) This formula calculates your initial savings from using the discounted On-demand Contract Price instead of the public On-demand List Price.
- Formula: On-demand Contract Price − On-demand List Price
- Example from table: $0.02055 − $0.03161 = −$0.01106
Savings from on-demand contract rates (for 3-Year CUD) This formula calculates the additional savings gained by using a 3-Year Flexible CUD compared to the already discounted On-demand Contract Price.
- Formula: 3-Year CUD Contract Price − On-demand Contract Price
- Example from table: $0.01408 − $0.02055 = −$0.00647
- Formula: 3-Year CUD Contract Price − On-demand List Price
- Example from table: $0.01408 − $0.03161 = −$0.01753
Savings from on-demand contract rates (for 1-Year CUD) This formula calculates the additional savings gained by using a 1-Year Flexible CUD compared to the on-demand Contract Price.
- Formula: 1-Year CUD Contract Price − On-demand Contract Price
- Example from table: $0.01878 − $0.02055 = −$0.00177
Savings from on-demand list rates (for 1-Year CUD) This formula calculates the total savings gained by using a 1-Year Flexible CUD compared to the public On-demand List Price.
- Formula: 1-Year CUD Contract Price − On-demand List Price
- Example from table: $0.01878 − $0.03161 = −$0.01283
Special cases for Compute Engine flexible CUDs
If you use Compute Engine flexible CUDs, check if your billing account also has spend-based CUDs for Cloud Run or Google Kubernetes Engine. If you have these additional commitments, pre-migration analysis in CUD analysis, Cost reports, or Cost breakdown might be inaccurate for dates starting July 2024. This is because flexible CUDs expanded to cover more than Compute Engine resources.
Alternative analysis tools
You can use other tools to validate your data.
- Cost breakdown: Follow similar steps as the cost reports validation. Identify the net cost with the spend-based CUD (including usage and commitment fee SKUs) and compare it to the cost without the CUDs.
- BigQuery export: Use BigQuery queries to determine costs and savings for a selected timeframe (for example, one day or one week) before and after migration. To calculate your effective savings rate (ROI), use the CUD KPI sample queries. Separate sample queries are available specifically for the legacy data model and the new data model to facilitate comparison.
- CSV download: From the CUD analysis page, download a CSV file to analyze usage and savings for all SKUs covered by a specific CUD type.
Related topics
- Spend-based CUD program improvements
- Spend-based CUD data model changes
- Choose the correct amount of CUD to buy
- Sample queries for the new CUDs data model
- Migrated CUD SKUs, offers, and consumption model IDs
- Billing user interface improvements