This document describes different ways to optimize queries and manage indexes in AlloyDB for PostgreSQL. For related information on indexing strategies, see AlloyDB database indexing strategies.
Memory and query optimizations
You can use work_mem parameter to optimize the memory and query.
work_mem
Work memory is dedicated memory for each connection to PostgreSQL. It's a
crucial configuration parameter that controls the maximum amount of memory a
query operation can use, like sorting or hashing, before it starts to write
temporary data to disk. Setting this parameter incorrectly can create negative
effects such as swapping or even crashing your instance. Therefore, it's
important to understand what work_mem is used for and how to correctly size
it.
Here's a breakdown of what work_mem is used for and why it's important:
- Sorting operations: when you have queries with
ORDER BY,DISTINCT, orGROUP BYclauses, or when you perform merge joins, PostgreSQL often needs to sort data. If the dataset to be sorted exceeds thework_memlimit, PostgreSQL performs an "external merge sort," meaning it writes temporary files to disk to complete the sort. This is a significantly slower process than sorting entirely in memory. - Hashing operations: hash joins and hash-based aggregations, such as
GROUP BYwith a hashing strategy, use hash tables in memory. If the hash table exceeds thework_memlimit, PostgreSQL spills the data to temporary files on disk, which degrades performance. Thehash_mem_multiplierparameter can further influence the memory allocated for hash operations and by default, this is three times thework_memlimit. - Memoize nodes: these are used in some query plans to cache the results of lookups, particularly in nested loop joins where there are many duplicates, and to avoid returning the same results.
Here are the ways that work_mem affects query performance:
- In-memory versus disk-based operations: When
work_memis sufficient, PostgreSQL can perform operations entirely in memory, which is much faster. Whenwork_memis too low, it's forced to spill to disk, creating temporary files. Disk I/O is significantly slower than memory access, which leads to noticeable performance degradation. - Query planner decisions: The query planner considers
work_memwhen it decides on the most efficient execution plan. Ifwork_memis low, the planner might choose less efficient access methods—a merge join instead of a hash join—to avoid disk spills, even if a hash-based approach would be faster with sufficient memory.
The value of work_mem can negatively affect performance in the following ways:
- Concurrency: it's important to remember that
work_memis allocated per session. A single complex query might have multiple sort or hash operations, each consuming its ownwork_memallowance. Furthermore, if you have many concurrent connections or parallel query workers, the total memory consumed bywork_memcan quickly add up to many times the configured value. - Value is too low: leads to excessive disk spills and slow
queries. You often see this in
EXPLAIN ANALYZEoutput as external merge, or when you monitor temporary file creation in your PostgreSQL logs. External merge signifies that intermediate temporary files were written to the file system in support of the given operation. - Value is too high: can lead to excessive memory consumption,
potentially causing the system to run out of memory—OOM errors—
or swap heavily, impacting overall system stability and performance. This is
why it's very important to understand how much free memory the system has to
work with before you alter the
work_memsetting.
If different values based upon workload are needed, you can set work_mem at
the instance, database, user, or session level.
Determine a work_mem setting
The following example shows how to determine an optimum work_mem setting by
using psql and a normal explain plan and trace output:
SET SESSION log_temp_files TO 0;

show log_temp_files;
 log_temp_files
----------------
 0

SET SESSION client_min_messages TO 'log';

show client_min_messages;
 client_min_messages
---------------------
 log

SET SESSION trace_sort TO 'on';

show trace_sort;
 trace_sort
------------
 on

EXPLAIN (analyze, buffers) SELECT * from person order by lastname,firstname;
LOG:  begin tuple sort: nkeys = 2, workMem = 4096, randomAccess = f
LOG:  varstr_abbrev: abbrev_distinct after 160: 155.187096 (key_distinct: 158.683969, norm_abbrev_card: 0.969919, prop_card: 0.200000)
LOG:  varstr_abbrev: abbrev_distinct after 320: 285.295387 (key_distinct: 297.256587, norm_abbrev_card: 0.891548, prop_card: 0.200000)
LOG:  varstr_abbrev: abbrev_distinct after 640: 515.447330 (key_distinct: 535.493647, norm_abbrev_card: 0.805386, prop_card: 0.200000)
LOG:  varstr_abbrev: abbrev_distinct after 1280: 890.895244 (key_distinct: 962.567433, norm_abbrev_card: 0.696012, prop_card: 0.200000)
LOG:  varstr_abbrev: abbrev_distinct after 2560: 1070.456601 (key_distinct: 1162.663992, norm_abbrev_card: 0.418147, prop_card: 0.200000)
LOG:  varstr_abbrev: abbrev_distinct after 5120: 1096.382036 (key_distinct: 1181.511150, norm_abbrev_card: 0.214137, prop_card: 0.200000)
LOG:  worker -1 switching to external sort with 15 tapes: CPU: user: 0.00 s, system: 0.00 s, elapsed: 0.00 s
LOG:  worker -1 starting quicksort of run 1: CPU: user: 0.00 s, system: 0.00 s, elapsed: 0.00 s
LOG:  worker -1 finished quicksort of run 1: CPU: user: 0.00 s, system: 0.00 s, elapsed: 0.00 s
LOG:  worker -1 finished writing run 1 to tape 1: CPU: user: 0.00 s, system: 0.00 s, elapsed: 0.00 s
LOG:  worker -1 starting quicksort of run 2: CPU: user: 0.00 s, system: 0.00 s, elapsed: 0.01 s
LOG:  begin tuple sort: nkeys = 2, workMem = 4096, randomAccess = f
LOG:  varstr_abbrev: abbrev_distinct after 160: 81.130738 (key_distinct: 82.213763, norm_abbrev_card: 0.507067, prop_card: 0.200000)
LOG:  varstr_abbrev: abbrev_distinct after 320: 90.919448 (key_distinct: 92.012881, norm_abbrev_card: 0.284123, prop_card: 0.200000)
LOG:  varstr_abbrev: abbrev_distinct after 640: 111.897001 (key_distinct: 115.248886, norm_abbrev_card: 0.174839, prop_card: 0.200000)
LOG:  worker -1 finished quicksort of run 2: CPU: user: 0.01 s, system: 0.00 s, elapsed: 0.01 s
........................
LOG:  performsort of worker -1 done (except 2-way final merge): CPU: user: 0.00 s, system: 0.00 s, elapsed: 0.00 s
LOG:  temporary file: path "base/pgsql_tmp/pgsql_tmp3337921.0", size 3907584
LOG:  external sort of worker -1 ended, 477 disk blocks used: CPU: user: 0.00 s, system: 0.00 s, elapsed: 0.01 s
LOG:  temporary file: path "base/pgsql_tmp/pgsql_tmp3324597.0", size 9117696
LOG:  external sort of worker -1 ended, 1113 disk blocks used: CPU: user: 0.02 s, system: 0.00 s, elapsed: 0.03 s

                                 QUERY PLAN
--------------------------------------------------------------------------------------
 Gather Merge  (cost=8324.86..9675.88 rows=11748 width=1563) (actual time=23.038..32.701 rows=19972 loops=1)
   Workers Planned: 1
   Workers Launched: 1
   Buffers: shared hit=1768, temp read=1590 written=1592
   I/O Timings: temp read=2.106 write=5.763
   ->  Sort  (cost=7324.85..7354.22 rows=11748 width=1563) (actual time=14.770..17.354 rows=9986 loops=2)
         Sort Key: lastname, firstname
         Sort Method: external merge  Disk: 8904kB
         Buffers: shared hit=1768, temp read=1590 written=1592
         I/O Timings: temp read=2.106 write=5.763
         Worker 0:  Sort Method: external merge  Disk: 3816kB
         ->  Parallel Seq Scan on person  (cost=0.00..1848.48 rows=11748 width=1563) (actual time=0.008..1.481 rows=9986 loops=2)
               Buffers: shared hit=1731
 Planning Time: 0.063 ms
 Execution Time: 35.174 ms
As highlighted in the trace example, you can see that two temporary files were
created on disk for a combined size of approximately 12.5 MB. Additionally,
the query plan points out in the sort step that the projected cost of the sort
is 7354.22, which represents almost 76% of the total projected cost.
There are two methods to estimate the amount of work_mem required:
Method 1
- Multiply the estimated rows by the estimated row width. In the trace example case, it's 11748 * 1563 = 17.5 MB.
- Divide this by the number of workers + 1. For example, if the number of
parallel_workers_per_gatheris 2, then it's 2 + 1 = 3. 17.5 / 3 = 6 + 1 = 7 - Add 1 MB for overhead.
The estimated setting for
work_memequals 7 MB.Method 2
- Sum up the number of temporary files shown in the trace with some arbitrary overhead value to account for the coordination. In the trace example case, the first file size is 3,907,584 MB plus the second file size 9,117,696 MB, which equates to a total memory requirement of 13.5 MB.
Divide this by the number of workers + 1.
Add 1 MB for overhead.
The estimated setting for
work_memequals 8 MB.
Here's an example of the query with the updated setting:
SET SESSION log_temp_files TO 0;

show log_temp_files;
 log_temp_files
----------------
 0

SET SESSION client_min_messages TO 'log';

show client_min_messages;
 client_min_messages
---------------------
 log

SET SESSION trace_sort TO 'on';

show trace_sort;
 trace_sort
------------
 on

SET SESSION work_mem TO '8MB';

show work_mem;
 work_mem
----------
 8MB

EXPLAIN (analyze, buffers) SELECT * FROM person ORDER BY lastname,firstname;
LOG:  begin tuple sort: nkeys = 2, workMem = 8192, randomAccess = f
LOG:  varstr_abbrev: abbrev_distinct after 160: 155.187096 (key_distinct: 158.683969, norm_abbrev_card: 0.969919, prop_card: 0.200000)
LOG:  varstr_abbrev: abbrev_distinct after 320: 285.295387 (key_distinct: 297.256587, norm_abbrev_card: 0.891548, prop_card: 0.200000)
.......................
LOG:  performsort of worker -1 done: CPU: user: 0.01 s, system: 0.00 s, elapsed: 0.01 s
LOG:  internal sort of worker -1 ended, 7077 KB used: CPU: user: 0.01 s, system: 0.00 s, elapsed: 0.01 s
LOG:  internal sort of worker -1 ended, 6751 KB used: CPU: user: 0.01 s, system: 0.00 s, elapsed: 0.01 s
                                 QUERY PLAN
--------------------------------------------------------------------------------------
 Gather Merge  (cost=8324.86..9675.88 rows=11748 width=1563) (actual time=12.124..17.612 rows=19972 loops=1)
   Workers Planned: 1
   Workers Launched: 1
   Buffers: shared hit=1773
   ->  Sort  (cost=7324.85..7354.22 rows=11748 width=1563) (actual time=11.138..11.802 rows=9986 loops=2)
         Sort Key: lastname, firstname
         Sort Method: quicksort  Memory: 6751kB
         Buffers: shared hit=1773
         Worker 0:  Sort Method: quicksort  Memory: 7077kB
         ->  Parallel Seq Scan on person  (cost=0.00..1848.48 rows=11748 width=1563) (actual time=0.005..1.556 rows=9986 loops=2)
               Buffers: shared hit=1731
 Planning Time: 0.069 ms
 Execution Time: 18.662 ms
As noted by the bold portion of the query plan example, the cost of the sort still represents the same portion of the entire cost of the query. However, the time is now reduced by about 50% because the entire sort is performed in memory.
PostgreSQL query differences compared to Oracle or SQL Server
The PostgreSQL optimizer is different from that of Oracle or SQL Server.
Except for in specific circumstances, such as explicitly issuing PREPARE,
PostgreSQL doesn't store parsed queries for reuse later. Each and every query
is "planned" every single time.
PostgreSQL statistics
Ensuring that statistics are up-to-date is paramount to a proper execution plan.
Overall, the autovacuum process maintains statistics adequately, but there are
circumstances where it might not. Manual statistics might need to be gathered to
ensure proper performance for the following scenarios:
- When a new partition is created.
- When temporary tables are used.
- When tables are loaded and then immediately queried.
Options for statistics gathering
There aren't many options for changing the way statistics are gathered in PostgreSQL. Of the available options, the following are the most common:
default_statistics_target: the default is 100. This instance-level option controls the number of rows sampled to create statistics. By default, PostgreSQL samples up to 30k rows. This option uses the following formula to determine how many rows to sample:300 *
default_statistics_targetColumn-level statistics target: This option follows the same formula as the instance-level option, but only for a given column. More data can be sampled at the column level by setting the statistics level for a given column. Use the following command:
ALTER TABLE [table_name] ALTER COLUMN [column_name] SET STATISTICS 500;This command samples up to 150k rows for the modified column, but 30k rows for all other columns. Keep in mind that any time statistics settings are altered, additional time is required to collect those statistics.
Note: The
default_statistics_targetcan only be set globally for the entire instance, not for each individual table. Individual columns must have thestatisticsoption set to influence statistics for individual tables.
For more information about the default_statistics_target option,
see
Postgres' Clever Query Planning System.
SQL plan management
To manage your SQL plan, you can use the pg_hint_plan extension.
pg_hint_plan
When you use pg_hint_plan to manage query plans, it's important to use the
correct syntax. Otherwise, you can waste additional planning
time by having each and every query allow the extension to interpret invalid
hints.
All documented hints in the following tables are available in AlloyDB:
pg_hint_plan hint |
Purpose |
|---|---|
ColumnarScan(table),NoColumnarScan(table) |
Influences the planner to use columnar engine for the specified table. |
The following reference can be helpful to compare Oracle hints with their
pg_hint_plan equivalents:
| Oracle hint | pg_hint_plan hint |
Explanation |
|---|---|---|
USE_NL(table1 table2),
NO_USE_NL(t1 [t2...]) |
NestLoop(table1 table2),
NoNestLoop(t1 t2 [t3...]) |
Influences the planner to use a nested join loop between the specified
tables. The NoNestLoop hint influences the planner not to
use a nested join loop between the inner and outer table. You must
specify in the hint both of the tables—or aliases—that
participate in the join. |
USE_HASH(table1 table2),
NO_USE_HASH(t1 [t2...]) |
HashJoin(table1 table2),
NoHashJoin(t1 t2 [t3...]) |
Influences the planner to use a hash join between the specified
tables. The NoHashJoin influences the planner not to
use a hash join between the inner and outer table. You must
specify in the hint both of the tables—or aliases—that
participate in the join. |
USE_MERGE(table1 table2),
NO_USE_MERGE(t1 [t2...]) |
MergeJoin(table1 table2),
NoMergeJoin(t1 t2 [t3...]) |
Influences the planner to use a merge join between the specified
tables. The NoMergeJoin influences the planner not to
use a merge join between the inner and outer table. You must
specify in the hint both of the tables—or aliases—that
participate in the join. |
USE_NL_WITH_INDEX(t1 idx1) |
NestLoop(table1 table2),
IndexScan(table1 index1),
Leading(table2 table1) |
Influences the planner to choose a nested loop using an index. While this is a single hint in Oracle, in PostgreSQL you must specify the same hint using two separate hints. |
FULL(table) |
SeqScan(table), NoSeqScan(table) |
SeqScan(table) influences the planner to use a full table
scan on the specified table, while NoSeqScan(table)
influences the planner to use alternative methods other than a
SeqScan. |
INDEX(table [index]) |
IndexScan(table[ index...]),
NoIndexScan(table) |
PostgreSQL uses separate hints for each index scan type, compared to Oracle where there's just one directive. |
INDEX(table [index]) |
IndexOnlyScan(table[ index...]),
NoIndexOnlyScan(table) |
PostgreSQL uses separate hints for each index scan type, compared to Oracle where there's just one directive. |
INDEX_DESC(table [index]) |
None (built-in functionality) | This hint is considered automatically by the PostgreSQL planner as long as the columns being sorted are in the index being used. |
INDEX(table [index]) |
BitmapScan(table[ index...]),
NoBitmapScan(table) |
PostgreSQL uses separate hints for each index scan type, compared to
Oracle where there's just one directive. The BitmapScan
hint is useful when returning larger datasets and prefetch could be
helpful to return rows faster. |
PARALLEL(table, degree of parallelism),
NO_PARALLEL(table) |
Parallel(table[soft|hard]) |
In Oracle, the PARALLEL hint directs the optimizer to
execute a parallel plan. However, if there are no parallel workers
available, then the hint might be ignored or the statement queued,
depending on other database settings.
In PostgreSQL, there are two configurations. When you specify
"soft", it's treated as a suggestion. If the planner determines the
costs aren't favorable for the parallel hint, it doesn't use it. When
you specify "hard", it emulates the Oracle functionality of forcing the
parallel scan regardless of planner costs. |
OPT_PARAM |
Set(GUC-param value) |
Allows different PostgreSQL parameters to be set for this particular query plan. |
LEADING(t1 t2 ... tN) |
Leading(t1 t2 ... tN,
Leading(((t1 t2) t3)) |
This is a method to influence join order. You can use parentheses in
the pg_hint_plan version to further influence which tables
can be used as the inner versus outer table. |
ORDERED |
Set(join_collapse_limit 1) |
The GUC join_collapse_limit allows the planner to attempt
multiple permutations of the join order in an attempt to find the
optimal order. When you force the join_collapse_limit to
1, it forces the planner to use the tables as
listed in the FROM clause. |
The following table contains Oracle hints for which there are no equivalent hints in PostgreSQL:
| Oracle hint | pg_hint_plan hint |
Explanation |
|---|---|---|
RESULT_CACHE, NO_RESULT_CACHE |
None | Result cache doesn't exist in PostgreSQL. |
DYNAMIC_SAMPLING |
None | PostgreSQL statistics completely rely on the ANALYZE
action. PostgreSQL doesn't have the ability to pre-sample a table like
Oracle does. |
QB_NAME |
None | No equivalent of query blocks in PostgreSQL. |
PUSH_PRED, NO_PUSH_PRED |
None | PostgreSQL automatically handles predicate pushdown and there's no way to influence the planner otherwise. |
USE_CONCAT |
None | No equivalent hint in PostgreSQL. The query should be
re-written if you want to expand OR directives into
UNION ALL directives. |
NO_QUERY_TRANSFORMATION |
None | No ability to turn off transformations within the PostgreSQL planner. |
NO_INDEX(table [index]) |
None | Can't eliminate specific indexes from planner consideration in PostgreSQL. |
INDEX_JOIN(table) |
None | No similar functionality. |
INDEX_FFS(table index) |
None | The IndexOnlyScan hint is the closest equivalent.
However, to be effective, the index needs to be a covered index. The
index must include all returned columns. |
The following table contains PostgreSQL hints for which there are no Oracle equivalents:
| Oracle hint | pg_hint_plan hint |
Explanation |
|---|---|---|
| None | Memoize(table table[ table...]),
NoMemoize(table table[ table...]) |
Allows PostgreSQL to cache the results of certain nested loop operations for reuse to optimize execution. While this hint can be specified, it's not an absolute directive. The planner might still ignore it. |
| None | Rows(table table[ table...] correction) |
Allows the manual specification of a rowcount estimate to the planner.
The specification can be made using the following directives:
absolute(#), addition(+),
subtraction(-), and multiplication(*).
For example, if the hint Rows(t1 #50) were specified, that
would instruct the optimizer to consider the number of rows in table
t1 to be 50 regardless of whatever is set
in the database statistics. |
| None | TidScan(table), NoTidScan(table) |
Helpful when specifying a TID value in the WHERE clause
for a given query. |
To debug pg_hint_plan, you can set the following options in psql:
SET SESSION pg_hint_plan.debug_print TO true;

SET pg_hint_plan.message_level TO notice;

SET SESSION client_min_messages TO LOG;
pg_proctab
You can also use the pg_proctab extension along with various other GUI
interfaces that use the extension to query system statistics directly from the
database. For documentation on the extension and example queries, see
Metrics with pg_proctab.
Specifically, you can use pg_proctab to determine how much memory your idle
connections are using, as shown:
SELECT
    sa.pid,
    SUBSTR(sa.query,0,50) as query,
    pg_size_pretty(ps.rss * 1024) AS memory_consumption
FROM
    pg_stat_activity sa
JOIN
    pg_proctab() ps
ON
    sa.pid = ps.pid
WHERE
    sa.state = 'idle';
pg_systat
The pg_systat command-line tool can be executed remotely to retrieve
statistics about databases, tables, indexes, tablespaces, vacuum, and standby
instances. While there are plenty of other statistics available to you using
System insights, this tool
might provide additional information in a concise view if you prefer
command-line access. For more information, see the
PostgreSQL systat Project GitHub page.
pg_gather
The pg_gather command-line tool is an open source tool that scans a PostgreSQL
instance for potential problems. The pg_gather tool is a SQL-only script that
uses built-in features of psql. You can find the tool at the
pg_gather GitHub page.
To execute the pg_gather tool, use psql. It creates a collection of files that
you then must run through several analysis scripts and a PostgreSQL schema to
produce an HTML report.
The following is an example of the report:
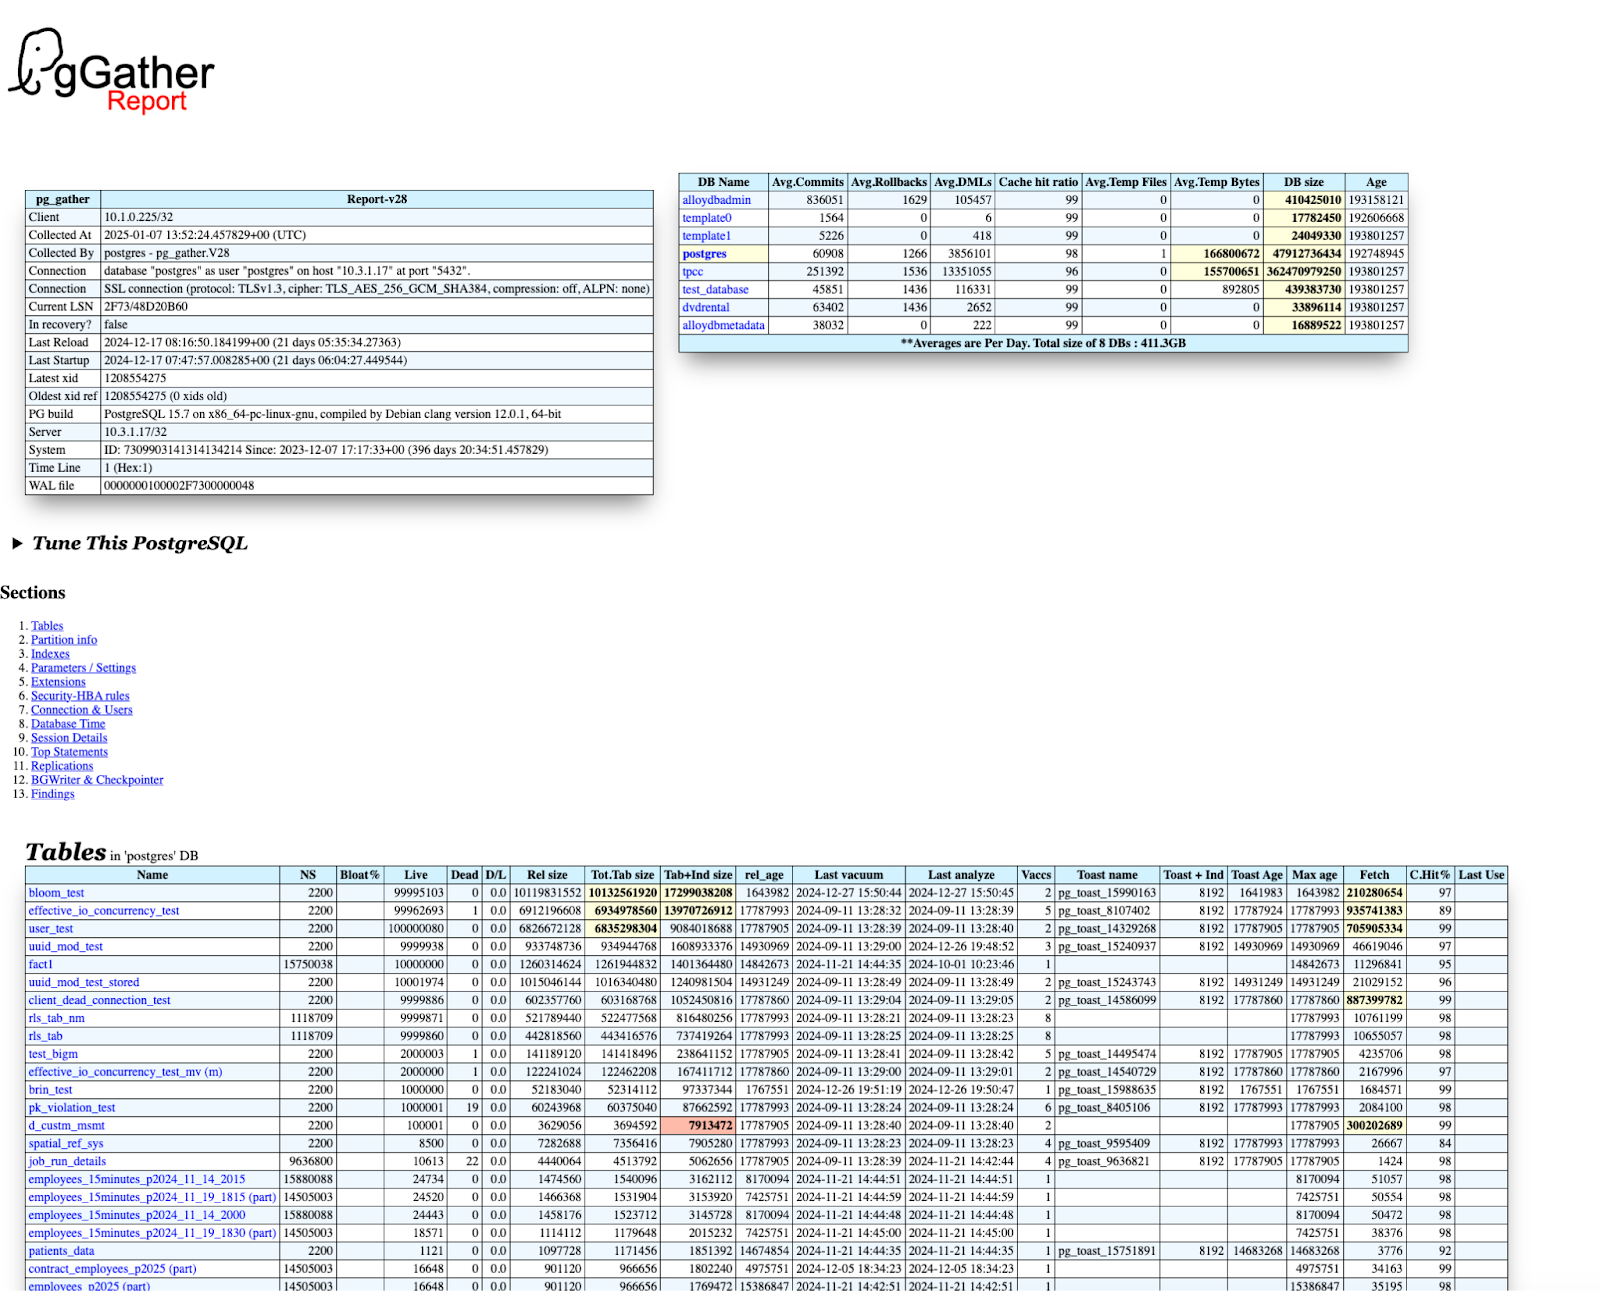
The following is a list of some database elements that the report helps you tune:
- Vacuum
- Identification of unused indexes
- Full parameter list, with identification of parameters that might need tuning
- Abandoned replication slots
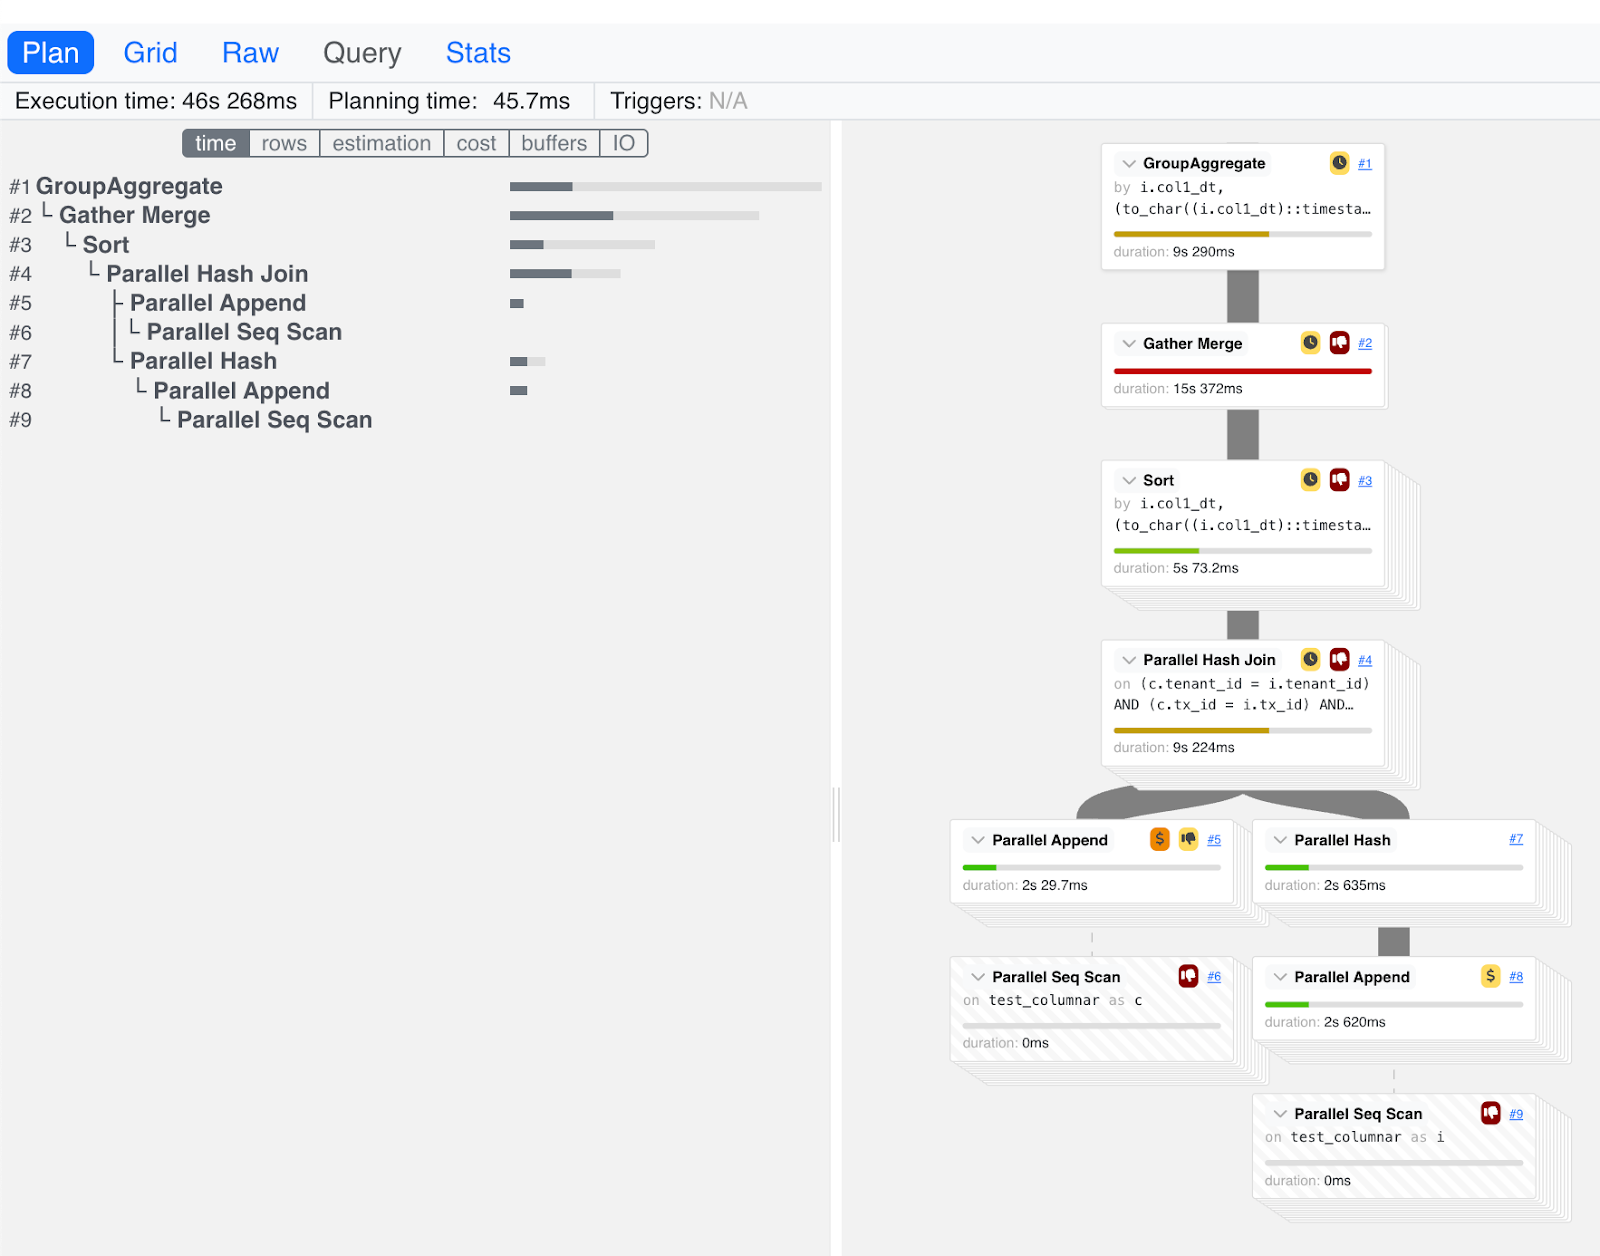
pev2
The pev2 tool allows the visualization of PostgreSQL EXPLAIN output query
plans. There's an online and offline format available to use, and for data
privacy purposes, preference is given to the offline version. You can download
the tool at the
pev2 GitHub page.
The best way to use the pev2 tool is to capture the EXPLAIN output in JSON
format using the following invocation:
SET enable_ultra_fast_cache_explain_output TO ON;
EXPLAIN (analyze, verbose, columnar_engine, costs, settings, buffers, wal, timing, summary, format json)
To create the visualization, copy the EXPLAIN output into the
tool.
The following is an example of pev2 output: