This document describes how to deploy the OpenTelemetry Collector, configure
the collector to use the `otlphttp` exporter and the
[Telemetry (OTLP) API](https://docs.cloud.google.com/stackdriver/docs/reference/telemetry/overview.md.txt), and run a telemetry
generator to write metrics to Cloud Monitoring. You can then view these
metrics in Cloud Monitoring.
If you are using Google Kubernetes Engine, you can follow
[Managed OpenTelemetry for GKE](https://docs.cloud.google.com/kubernetes-engine/docs/concepts/managed-otel-gke.md.txt) instead of
manually deploying and configuring an OpenTelemetry Collector that uses the
Telemetry API.
If you are using an SDK to send metrics from an application directly to
the Telemetry API, then see
[Use SDKs to send metrics from applications](https://docs.cloud.google.com/stackdriver/docs/otlp-metrics/use-sdks.md.txt) for additional
information and examples.
You can also use an OpenTelemetry Collector and the Telemetry API in
conjunction with OpenTelemetry zero-code instrumentation. For more information,
see [Use OpenTelemetry zero-code instrumentation for Java](https://docs.cloud.google.com/stackdriver/docs/instrumentation/otel-zerocode-java-gke.md.txt).
## Before you begin
This section describes how to set up your environment for deploying
and using the collector.
### Select or create a Google Cloud project
Choose a Google Cloud project for this walkthrough. If you don't already
have a Google Cloud project, then create one:
### Install command-line tools
This document uses following command-line tools:
- `gcloud`
- `kubectl`
The `gcloud` and `kubectl` tools are part of the
Google Cloud CLI. For information about installing them, see
[Managing Google Cloud CLI components](https://docs.cloud.google.com/sdk/docs/components.md.txt). To see the
gcloud CLI components you have installed, run the following
command:
```
gcloud components list
```
To configure the gcloud CLI for use, run the following commands:
```
gcloud auth login
gcloud config set project PROJECT_ID
```
### Enable APIs
Enable the Cloud Monitoring API and the Telemetry API in your
Google Cloud project. **Pay particular attention to the
Telemetry API, `telemetry.googleapis.com`**; this document
might be the first time you've encountered this API.
Enable the APIs by running the following commands:
```
gcloud services enable monitoring.googleapis.com
gcloud services enable telemetry.googleapis.com
```
### Create a cluster
Create a GKE cluster.
1. Create a Google Kubernetes Engine cluster named `otlp-test` by running the following
command:
```bash
gcloud container clusters create-auto --location CLUSTER_LOCATION otlp-test --project PROJECT_ID
```
2. After the cluster is created, connect to it by running the following
command:
```bash
gcloud container clusters get-credentials otlp-test --region CLUSTER_LOCATION --project PROJECT_ID
```
### Authorize the Kubernetes service account
The following commands grant the necessary Identity and Access Management (IAM) roles
to the Kubernetes service account. These commands assume you are using
[Workload Identity Federation for GKE](https://docs.cloud.google.com/kubernetes-engine/docs/how-to/workload-identity.md.txt):
```
export PROJECT_NUMBER=$(gcloud projects describe PROJECT_ID --format="value(projectNumber)")
gcloud projects add-iam-policy-binding projects/PROJECT_ID \
--role=roles/logging.logWriter \
--member=principal://iam.googleapis.com/projects/$PROJECT_NUMBER/locations/global/workloadIdentityPools/PROJECT_ID.svc.id.goog/subject/ns/opentelemetry/sa/opentelemetry-collector \
--condition=None
gcloud projects add-iam-policy-binding projects/PROJECT_ID \
--role=roles/monitoring.metricWriter \
--member=principal://iam.googleapis.com/projects/$PROJECT_NUMBER/locations/global/workloadIdentityPools/PROJECT_ID.svc.id.goog/subject/ns/opentelemetry/sa/opentelemetry-collector \
--condition=None
gcloud projects add-iam-policy-binding projects/PROJECT_ID \
--role=roles/telemetry.tracesWriter \
--member=principal://iam.googleapis.com/projects/$PROJECT_NUMBER/locations/global/workloadIdentityPools/PROJECT_ID.svc.id.goog/subject/ns/opentelemetry/sa/opentelemetry-collector \
--condition=None
```
If your service account has a different format, then you can use the
command in the Google Cloud Managed Service for Prometheus documentation to
[authorize the service account](https://docs.cloud.google.com/stackdriver/docs/managed-prometheus/setup-unmanaged.md.txt#create-bind-sa), with the following changes:
- Replace `gmp-test-sa` with your service account's name.
- Grant the roles shown in the previous set of commands, not just the `roles/monitoring.metricWriter` role.
## Deploy the OpenTelemetry Collector
Create the collector configuration by making a copy of the following
YAML file and placing it in a file named `collector.yaml`. You can also find
the following configuration on GitHub in the [`otlp-k8s-ingest`
repository](https://github.com/GoogleCloudPlatform/otlp-k8s-ingest/blob/otlpmetric/config/collector.yaml).
**In your copy, be sure to replace the occurrence of `${GOOGLE_CLOUD_PROJECT}`
with your project ID, PROJECT_ID.**
OTLP for Prometheus metrics only works when using the OpenTelemetry Collector version
0.140.0 or newer.
```yaml
# Copyright 2024 Google LLC
#
# Licensed under the Apache License, Version 2.0 (the "License");
# you may not use this file except in compliance with the License.
# You may obtain a copy of the License at
#
# http://www.apache.org/licenses/LICENSE-2.0
#
# Unless required by applicable law or agreed to in writing, software
# distributed under the License is distributed on an "AS IS" BASIS,
# WITHOUT WARRANTIES OR CONDITIONS OF ANY KIND, either express or implied.
# See the License for the specific language governing permissions and
# limitations under the License.
exporters:
# The googlecloud exporter is used for logs
googlecloud:
log:
default_log_name: opentelemetry-collector
user_agent: Google-Cloud-OTLP manifests:0.4.0 OpenTelemetry Collector Built By Google/0.128.0 (linux/amd64)
googlemanagedprometheus:
user_agent: Google-Cloud-OTLP manifests:0.4.0 OpenTelemetry Collector Built By Google/0.128.0 (linux/amd64)
# The otlphttp exporter is used to send traces to Google Cloud Trace and
# metrics to Google Managed Prometheus using OTLP http/proto.
# The otlp exporter could also be used to send them using OTLP grpc
otlphttp:
encoding: proto
endpoint: https://telemetry.googleapis.com
# Use the googleclientauth extension to authenticate with Google credentials
auth:
authenticator: googleclientauth
extensions:
# Standard for the collector. Used for probes.
health_check:
endpoint: ${env:MY_POD_IP}:13133
# This is an auth extension that adds Google Application Default Credentials to http and gRPC requests.
googleclientauth:
processors:
# This filter is a standard part of handling the collector's self-observability metrics. Not related to OTLP ingestion.
filter/self-metrics:
metrics:
include:
match_type: strict
metric_names:
- otelcol_process_uptime
- otelcol_process_memory_rss
- otelcol_grpc_io_client_completed_rpcs
- otelcol_googlecloudmonitoring_point_count
# The recommended batch size for the OTLP endpoint is 200 metric data points.
batch:
send_batch_max_size: 200
send_batch_size: 200
timeout: 5s
# The k8sattributes processor adds k8s resource attributes to metrics based on the source IP that sent the metrics to the collector.
# k8s attributes are important for avoiding errors from timeseries "collisions".
# These attributes help distinguish workloads from each other, and provide useful metadata (e.g. namespace) when querying.
k8sattributes:
extract:
metadata:
- k8s.namespace.name
- k8s.deployment.name
- k8s.statefulset.name
- k8s.daemonset.name
- k8s.cronjob.name
- k8s.job.name
- k8s.replicaset.name
- k8s.node.name
- k8s.pod.name
- k8s.pod.uid
- k8s.pod.start_time
passthrough: false
pod_association:
- sources:
- from: resource_attribute
name: k8s.pod.ip
- sources:
- from: resource_attribute
name: k8s.pod.uid
- sources:
- from: connection
# Standard processor for gracefully degrading when overloaded to prevent OOM.
memory_limiter:
check_interval: 1s
limit_percentage: 65
spike_limit_percentage: 20
# Standard processor for enriching self-observability metrics. Unrelated to OTLP ingestion.
metricstransform/self-metrics:
transforms:
- action: update
include: otelcol_process_uptime
operations:
- action: add_label
new_label: version
new_value: Google-Cloud-OTLP manifests:0.4.0 OpenTelemetry Collector Built By Google/0.128.0 (linux/amd64)
# The resourcedetection processor, similar to the k8sattributes processor, enriches metrics with important metadata.
# The gcp detector provides the cluster name and cluster location.
resourcedetection:
detectors: [gcp]
timeout: 10s
# This transform processor avoids ingestion errors if metrics contain attributes with names that are reserved for the prometheus_target resource.
transform/collision:
metric_statements:
- context: datapoint
statements:
- set(attributes["exported_location"], attributes["location"])
- delete_key(attributes, "location")
- set(attributes["exported_cluster"], attributes["cluster"])
- delete_key(attributes, "cluster")
- set(attributes["exported_namespace"], attributes["namespace"])
- delete_key(attributes, "namespace")
- set(attributes["exported_job"], attributes["job"])
- delete_key(attributes, "job")
- set(attributes["exported_instance"], attributes["instance"])
- delete_key(attributes, "instance")
- set(attributes["exported_project_id"], attributes["project_id"])
- delete_key(attributes, "project_id")
# The relative ordering of statements between ReplicaSet & Deployment and Job & CronJob are important.
# The ordering of these controllers is decided based on the k8s controller documentation available at
# https://kubernetes.io/docs/concepts/workloads/controllers.
# The relative ordering of the other controllers in this list is inconsequential since they directly
# create pods.
transform/aco-gke:
metric_statements:
- context: datapoint
statements:
- set(attributes["top_level_controller_type"], "ReplicaSet") where resource.attributes["k8s.replicaset.name"] != nil
- set(attributes["top_level_controller_name"], resource.attributes["k8s.replicaset.name"]) where resource.attributes["k8s.replicaset.name"] != nil
- set(attributes["top_level_controller_type"], "Deployment") where resource.attributes["k8s.deployment.name"] != nil
- set(attributes["top_level_controller_name"], resource.attributes["k8s.deployment.name"]) where resource.attributes["k8s.deployment.name"] != nil
- set(attributes["top_level_controller_type"], "DaemonSet") where resource.attributes["k8s.daemonset.name"] != nil
- set(attributes["top_level_controller_name"], resource.attributes["k8s.daemonset.name"]) where resource.attributes["k8s.daemonset.name"] != nil
- set(attributes["top_level_controller_type"], "StatefulSet") where resource.attributes["k8s.statefulset.name"] != nil
- set(attributes["top_level_controller_name"], resource.attributes["k8s.statefulset.name"]) where resource.attributes["k8s.statefulset.name"] != nil
- set(attributes["top_level_controller_type"], "Job") where resource.attributes["k8s.job.name"] != nil
- set(attributes["top_level_controller_name"], resource.attributes["k8s.job.name"]) where resource.attributes["k8s.job.name"] != nil
- set(attributes["top_level_controller_type"], "CronJob") where resource.attributes["k8s.cronjob.name"] != nil
- set(attributes["top_level_controller_name"], resource.attributes["k8s.cronjob.name"]) where resource.attributes["k8s.cronjob.name"] != nil
# For each Prometheus unknown-typed metric, which is a gauge, create a counter that is an exact copy of this metric.
# The GCP OTLP endpoint will add appropriate the appropriate suffixes for the counter and gauge.
transform/unknown-counter:
metric_statements:
- context: metric
statements:
# Copy the unknown metric, but add a suffix so we can distinguish the copy from the original.
- copy_metric(Concat([metric.name, "unknowncounter"], ":")) where metric.metadata["prometheus.type"] == "unknown" and not HasSuffix(metric.name, ":unknowncounter")
# Change the copy to a monotonic, cumulative sum.
- convert_gauge_to_sum("cumulative", true) where HasSuffix(metric.name, ":unknowncounter")
# Delete the extra suffix once we are done.
- set(metric.name, Substring(metric.name, 0, Len(metric.name)-Len(":unknowncounter"))) where HasSuffix(metric.name, ":unknowncounter")
# When sending telemetry to the GCP OTLP endpoint, the gcp.project_id resource attribute is required to be set to your project ID.
resource/gcp_project_id:
attributes:
- key: gcp.project_id
# MAKE SURE YOU REPLACE THIS WITH YOUR PROJECT ID
value: ${GOOGLE_CLOUD_PROJECT}
action: insert
# The metricstarttime processor is important to include if you are using the prometheus receiver to ensure the start time is set properly.
# It is a no-op otherwise.
metricstarttime:
strategy: subtract_initial_point
receivers:
# This collector is configured to accept OTLP metrics, logs, and traces, and is designed to receive OTLP from workloads running in the cluster.
otlp:
protocols:
grpc:
endpoint: ${env:MY_POD_IP}:4317
http:
cors:
allowed_origins:
- http://*
- https://*
endpoint: ${env:MY_POD_IP}:4318
# Push the collector's own self-observability metrics to the otlp receiver.
otlp/self-metrics:
protocols:
grpc:
endpoint: ${env:MY_POD_IP}:14317
service:
extensions:
- health_check
- googleclientauth
pipelines:
# Recieve OTLP logs, and export logs using the googlecloud exporter.
logs:
exporters:
- googlecloud
processors:
- k8sattributes
- resourcedetection
- memory_limiter
- batch
receivers:
- otlp
# Recieve OTLP metrics, and export metrics to GMP using the otlphttp exporter.
metrics/otlp:
exporters:
- otlphttp
processors:
- k8sattributes
- memory_limiter
- resource/gcp_project_id
- resourcedetection
- transform/collision
- transform/aco-gke
- transform/unknown-counter
- metricstarttime
- batch
receivers:
- otlp
# Scrape self-observability Prometheus metrics, and export metrics to GMP using the otlphttp exporter.
metrics/self-metrics:
exporters:
- otlphttp
processors:
- filter/self-metrics
- metricstransform/self-metrics
- k8sattributes
- memory_limiter
- resource/gcp_project_id
- resourcedetection
- batch
receivers:
- otlp/self-metrics
# Recieve OTLP traces, and export traces using the otlphttp exporter.
traces:
exporters:
- otlphttp
processors:
- k8sattributes
- memory_limiter
- resource/gcp_project_id
- resourcedetection
- batch
receivers:
- otlp
telemetry:
logs:
encoding: json
metrics:
readers:
- periodic:
exporter:
otlp:
protocol: grpc
endpoint: ${env:MY_POD_IP}:14317
```
### Configure the deployed OpenTelemetry Collector
Configure the collector deployment by creating Kubernetes resources.
1. Create the `opentelemetry` namespace and create the collector configuration
in the namespace by running the following commands:
```bash
kubectl create namespace opentelemetry
kubectl create configmap collector-config -n opentelemetry --from-file=collector.yaml
```
2. Configure the collector with Kubernetes resources by running the following
commands:
```bash
kubectl apply -f https://raw.githubusercontent.com/GoogleCloudPlatform/otlp-k8s-ingest/refs/heads/otlpmetric/k8s/base/2_rbac.yaml
kubectl apply -f https://raw.githubusercontent.com/GoogleCloudPlatform/otlp-k8s-ingest/refs/heads/otlpmetric/k8s/base/3_service.yaml
kubectl apply -f https://raw.githubusercontent.com/GoogleCloudPlatform/otlp-k8s-ingest/refs/heads/otlpmetric/k8s/base/4_deployment.yaml
kubectl apply -f https://raw.githubusercontent.com/GoogleCloudPlatform/otlp-k8s-ingest/refs/heads/otlpmetric/k8s/base/5_hpa.yaml
```
3. Wait for the collector pods to reach "Running" and have 1/1 containers
ready. This takes about three minutes on Autopilot, if this is
the first workload deployed. To check the pods, use the following command:
```bash
kubectl get po -n opentelemetry -w
```
To stop watching the pod status, enter Ctrl-C to stop the command.
4. You can also check the collector logs to make sure there aren't any
obvious errors:
```bash
kubectl logs -n opentelemetry deployment/opentelemetry-collector
```
### Deploy the telemetry generator
You can test your configuration by using the open-source
[`telemetrygen` tool](https://github.com/open-telemetry/opentelemetry-collector-contrib/tree/v0.164.0/cmd/telemetrygen). This app
generates telemetry and sends it to the collector.
1. To deploy the `telemetrygen` app in the `opentelemetry-demo` namespace,
run the following command:
```bash
kubectl apply -f https://raw.githubusercontent.com/GoogleCloudPlatform/otlp-k8s-ingest/refs/heads/main/sample/app.yaml
```
2. After you create the deployment, it might take a while for the pods
to be created and start running. To check the status of the pods,
run the following command:
```bash
kubectl get po -n opentelemetry-demo -w
```
To stop watching the pod status, enter Ctrl-C to stop the command.
## Query a metric by using Metrics Explorer
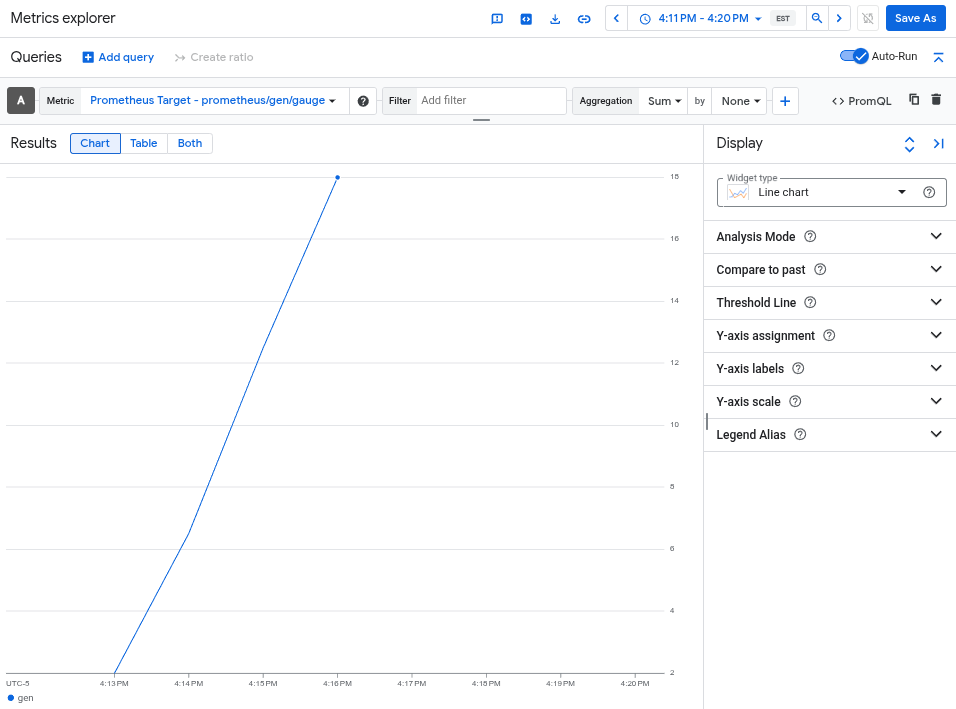
The `telemetrygen` tool writes to a metric called `gen`. You can query
this metric from both the query-builder interface and the PromQL
query editor in Metrics Explorer.
In the Google Cloud console, go to the
**Metrics explorer** page:
[Go to **Metrics explorer**](https://console.cloud.google.com/monitoring/metrics-explorer)
If you use the search bar to find this page, then select the result whose subheading is
**Monitoring**.
- If you use the Metrics Explorer query-builder interface, then the full name of the metric is `prometheus.googleapis.com/gen/gauge`.
- If you use the PromQL query editor, you can query the metric by using the name `gen`.
The following image shows a chart of the `gen` metric in Metrics Explorer:
## Delete the cluster
After verifying your deployment by querying the metric, you can delete the
cluster. To delete the cluster, run the following command:
```bash
gcloud container clusters delete --location CLUSTER_LOCATION otlp-test --project PROJECT_ID
```
## Using other OpenTelemetry-based collectors
You might be able to use other OpenTelemetry-based collectors to send OTLP
metrics to the Telemetry API, although Google Cloud does not provide
customer support for non-standard OpenTelemetry-based collectors.
For example, you can send metrics using
[Grafana Alloy](https://grafana.com/docs/alloy/latest/) version 1.16.0 or
newer by authenticating with the [`otelcol.auth.google`
component](https://github.com/grafana/alloy/blob/main/docs/sources/reference/components/otelcol/otelcol.auth.google.md)
and configuring it similarly to a standard OpenTelemetry Collector
using the instructions in this document.
## What's next
- For information about using an OpenTelemetry Collector and the Telemetry API with OpenTelemetry zero-code instrumentation, see [Use OpenTelemetry zero-code instrumentation for Java](https://docs.cloud.google.com/stackdriver/docs/instrumentation/otel-zerocode-java-gke.md.txt).
- For information about sending metrics from applications that use SDKs, see [Use SDKs to send metrics from applications](https://docs.cloud.google.com/stackdriver/docs/otlp-metrics/use-sdks.md.txt).
- For information about migrating to the `otlphttp` exporter from another exporter, see [Migrate to the OTLP exporter](https://docs.cloud.google.com/stackdriver/docs/otlp/migrate-collector-to-otlp-exporters.md.txt).
- To learn more about the Telemetry API, see [Telemetry (OTLP) API overview](https://docs.cloud.google.com/stackdriver/docs/reference/telemetry/overview.md.txt).