The topology graph in Application Monitoring lets you visualize the relationships between
your applications, services, and workloads. You can use this dynamic graph to
inspect traffic flow, latency, error rates, and open alerts. For
applications registered with [App Hub](https://docs.cloud.google.com/app-hub/docs/overview.md.txt), you can
view the topology for a single application, or at the
[application management boundary level](https://docs.cloud.google.com/app-hub/docs/key-concepts.md.txt#app-mgmt-boundary) to
see how your applications interact with external services and workloads.
To run custom queries and correlate alert and traffic data with other
telemetry, use [App Topology](https://docs.cloud.google.com/hub/docs/app-topology/run-queries.md.txt) in
Cloud Hub.
> [!NOTE]
> **Note:** On October 15, 2026, the App Topology API transitions to a usage-based billing model that includes a daily free data usage allotment. For more information, see [App Topology pricing](https://cloud.google.com/products/app-topology/pricing).
## Understand the topology graph
The application topology graph is fully interactive and provides a dynamic,
useful view of your applications, services, and workloads. This view helps you
monitor and troubleshoot performance issues.
The following image shows a topology graph for an application management boundary:
This graph has the following elements:
- **Blue circles**: Each blue circle represents an application registered with
App Hub. The example shows several applications:
- For two applications, the blue circle displays a
**Collapse** button. For these applications,
the services and workloads are shown.
- For one application, a single node is shown and the blue circle displays
the **Expand** button. The value in the
button is the number of registered services and workloads.
To get information about attributes and alerts for the application,
select its blue circle.
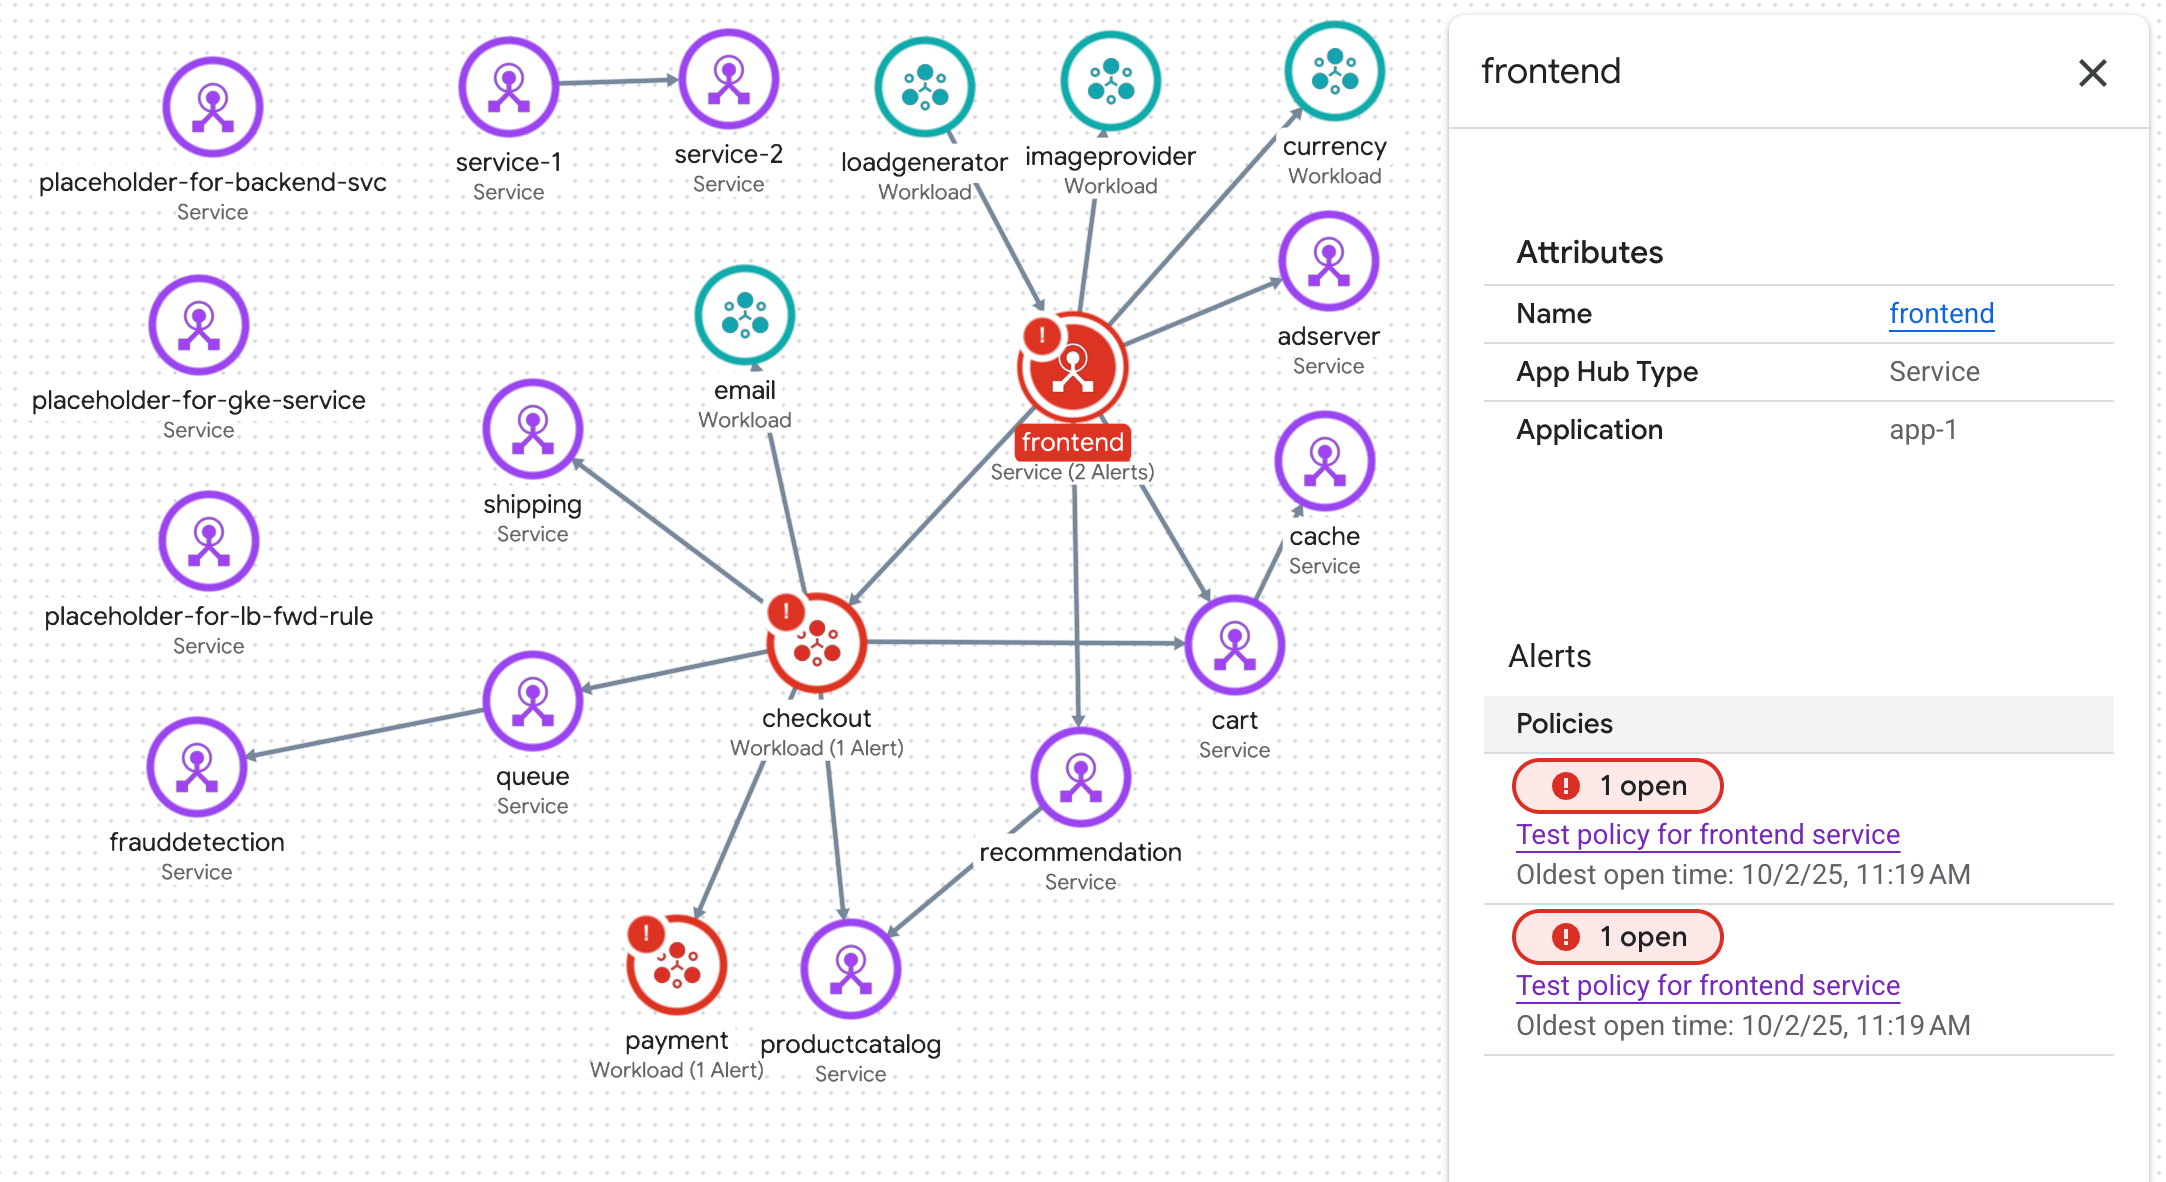
- **Nodes**: Each node represents a registered or discovered service or
workload. The icon of the node displays one of the following:
- Agent ()
- MCP server ()
- Service ()
- Workload ()
To get information about attributes and alerts, select the node.
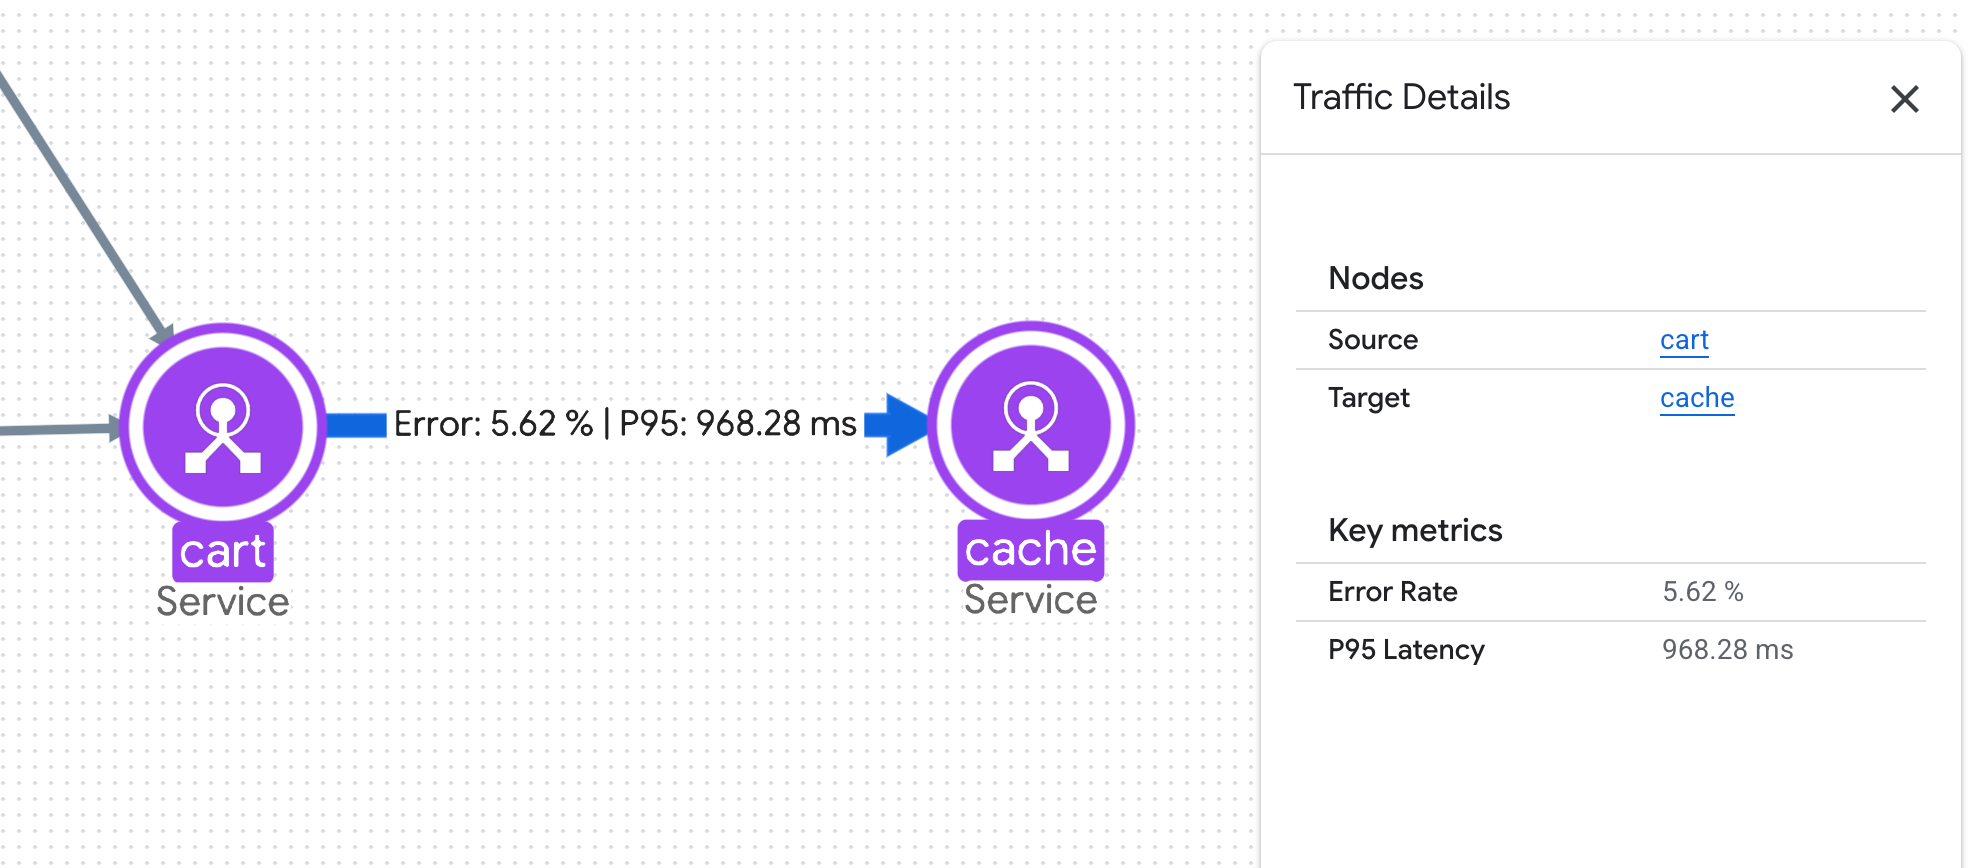
- **Connections**: Represent traffic between two nodes. To get information
about key metrics, such as the error rate and the 95th latency percentile,
select the connection:
### Limitations
- Connections show latency and error rate information that Application Monitoring derives from the most recent hour of data. You can't change the time range that Application Monitoring uses.
- The topology graph and flyouts display only alerts from the past 24 hours.
- For registered applications, services, and workloads, the topology graph displays alerts from alerting policies with resource labels, not from [alerting policies with application labels](https://docs.cloud.google.com/stackdriver/docs/observability/setup-application-monitoring.md.txt#alert). For discovered services and workloads, Application Monitoring uses resource labels to identify alerts.
- The topology graph displays at most 1000 nodes or connections. For each supported [App Hub region](https://docs.cloud.google.com/app-hub/docs/locations.md.txt), the graph displays at most 100 discovered services and 100 discovered workloads.
- You can't register a service or workload with an application by dragging the corresponding node into an application's blue circle. The circle is a visual guide, not a container.
- For the following resources, the topology graph only displays connections
when the corresponding service or workload has an
[App Hub registration status of `discovered`](https://docs.cloud.google.com/app-hub/docs/overview.md.txt#registration-status):
- Firestore resources
- Spanner resources
- Cloud Storage resources
- Google Cloud MCP servers
A service or workload has a registration status of `discovered` when
it is part of the application management boundary but isn't
registered to any application.
## Before you begin
To generate a topology graph for an application, your trace data must contain
application-specific labels. These labels are available only when you instrument
your app with OpenTelemetry, send your trace data to the Telemetry API,
and register your application with App Hub.
To get started, do the following:
1. Configure Application Monitoring as described in [Set up Application Monitoring](https://docs.cloud.google.com/stackdriver/docs/observability/setup-application-monitoring.md.txt). Setup for Application Monitoring includes configuring the default trace scope to [list all projects that store your trace data](https://docs.cloud.google.com/trace/docs/trace-scope/create-and-manage.md.txt#mgmt-project-scopes).
2.
Enable the Observability, App Topology, Cloud Trace, and Telemetry APIs, if any are not already enabled.
**Roles required to enable APIs**
To enable APIs, you need the `serviceusage.services.enable` permission. If you
created the project, then you likely already have this permission through the
Owner role (`roles/owner`). Otherwise, you can get this permission through the
Service Usage Admin role (`roles/serviceusage.serviceUsageAdmin`).
[Learn how to grant roles](https://docs.cloud.google.com/iam/docs/granting-changing-revoking-access.md.txt).
[Enable the APIs](https://console.cloud.google.com/apis/enableflow?apiid=observability.googleapis.com,apptopology.googleapis.com,cloudtrace.googleapis.com,telemetry.googleapis.com)
If you've added other projects to your trace scope, then we recommend that you also enable the Observability API for those projects. The application topology graph only shows trace connections from trace scope projects that are in the same organization as your App Hub project.
3.
To get the permissions that
you need to view an application topology,
ask your administrator to grant you the
[App Topology viewer](https://docs.cloud.google.com/iam/docs/roles-permissions/apptopology.md.txt#apptopology.viewer) (`roles/apptopology.viewer`) IAM role on your project.
For more information about granting roles, see [Manage access to projects, folders, and organizations](https://docs.cloud.google.com/iam/docs/granting-changing-revoking-access.md.txt).
This predefined role contains
the permissions required to view an application topology. To see the exact permissions that are
required, expand the **Required permissions** section:
#### Required permissions
The following permissions are required to view an application topology:
- Get discovered resource data: `apptopology.discoveredResourcesTopologies.generate`
- Get resource data: `apptopology.sreDomainTopologies.generate`
You might also be able to get
these permissions
with [custom roles](https://docs.cloud.google.com/iam/docs/creating-custom-roles.md.txt) or
other [predefined roles](https://docs.cloud.google.com/iam/docs/roles-overview.md.txt#predefined).
4. [Instrument your application to use OpenTelemetry](https://docs.cloud.google.com/trace/docs/setup.md.txt) and [send your trace data to the OTLP endpoint](https://docs.cloud.google.com/trace/docs/migrate-to-otlp-endpoints.md.txt).
## View topology for your application management boundary
1. In the Google Cloud console, go to the **Application monitoring** page:
[Go to **Application monitoring**](https://console.cloud.google.com/monitoring/applications)
If you use the search bar to find this page, then select the result whose subheading is
**Monitoring**.
2. In the project picker of the Google Cloud console,
select your
[host project or management project](https://docs.cloud.google.com/app-hub/docs/overview.md.txt)
.
3. Click the **Topology** tab. The topology graph for your
application management boundary appears.
From the interactive topology graph, you can do the following:
- Change the visualization by zooming in or out, repositioning nodes, or
collapsing or expanding a blue circle.
- Get information about attributes and associated alerts by selecting
an application or a node.
For discovered services and workloads, the flyout might display a
[Cloud Asset Inventory name](https://docs.cloud.google.com/asset-inventory/docs/asset-names.md.txt). Google Cloud Observability
uses the asset name to determine what data a dashboard displays.
- Get information about traffic between nodes by selecting the connection. A
flyout displays the node names and key metrics, such as the error rate and
the 95th latency percentile.
## View the topology graph for an application
1. In the Google Cloud console, go to the **Application monitoring** page:
[Go to **Application monitoring**](https://console.cloud.google.com/monitoring/applications)
If you use the search bar to find this page, then select the result whose subheading is
**Monitoring**.
2. In the project picker of the Google Cloud console,
select your
[host project or management project](https://docs.cloud.google.com/app-hub/docs/overview.md.txt)
.
3. Select an application from the list.
4. Click the **Topology** tab. The topology graph for your application appears.
From the interactive topology graph, you can do the following:
- Change the visualization by zooming in or out, or by repositioning nodes.
- Get information about attributes and alerts by selecting a node.
- Get information about traffic between nodes by selecting the connection. A
flyout displays the node names and key metrics, such as the error rate and
the 95th latency percentile.
## Troubleshoot
For information that might help you understand why the application topology
graph doesn't display data, see
[Troubleshoot Application Monitoring](https://docs.cloud.google.com/monitoring/docs/troubleshoot-application-monitoring.md.txt).
## What's next
- Explore topology graphs in [Cloud Hub](https://docs.cloud.google.com/hub/docs/app-topology/run-queries.md.txt).