This page describes how you can use the Cloud SQL System insights dashboard.
The System insights dashboard displays metrics for the resources that your
instance uses and helps you detect and analyze system performance problems.
## View the System insights dashboard
To view the System insights dashboard, do the following:
1. In the Google Cloud console, go to the **Cloud SQL Instances** page.
[Go to Cloud SQL Instances](https://console.cloud.google.com/sql)
2. Click the name of an instance.
3.
Select the **System insights** tab from the SQL navigation panel on the left.
The System insights dashboard opens.
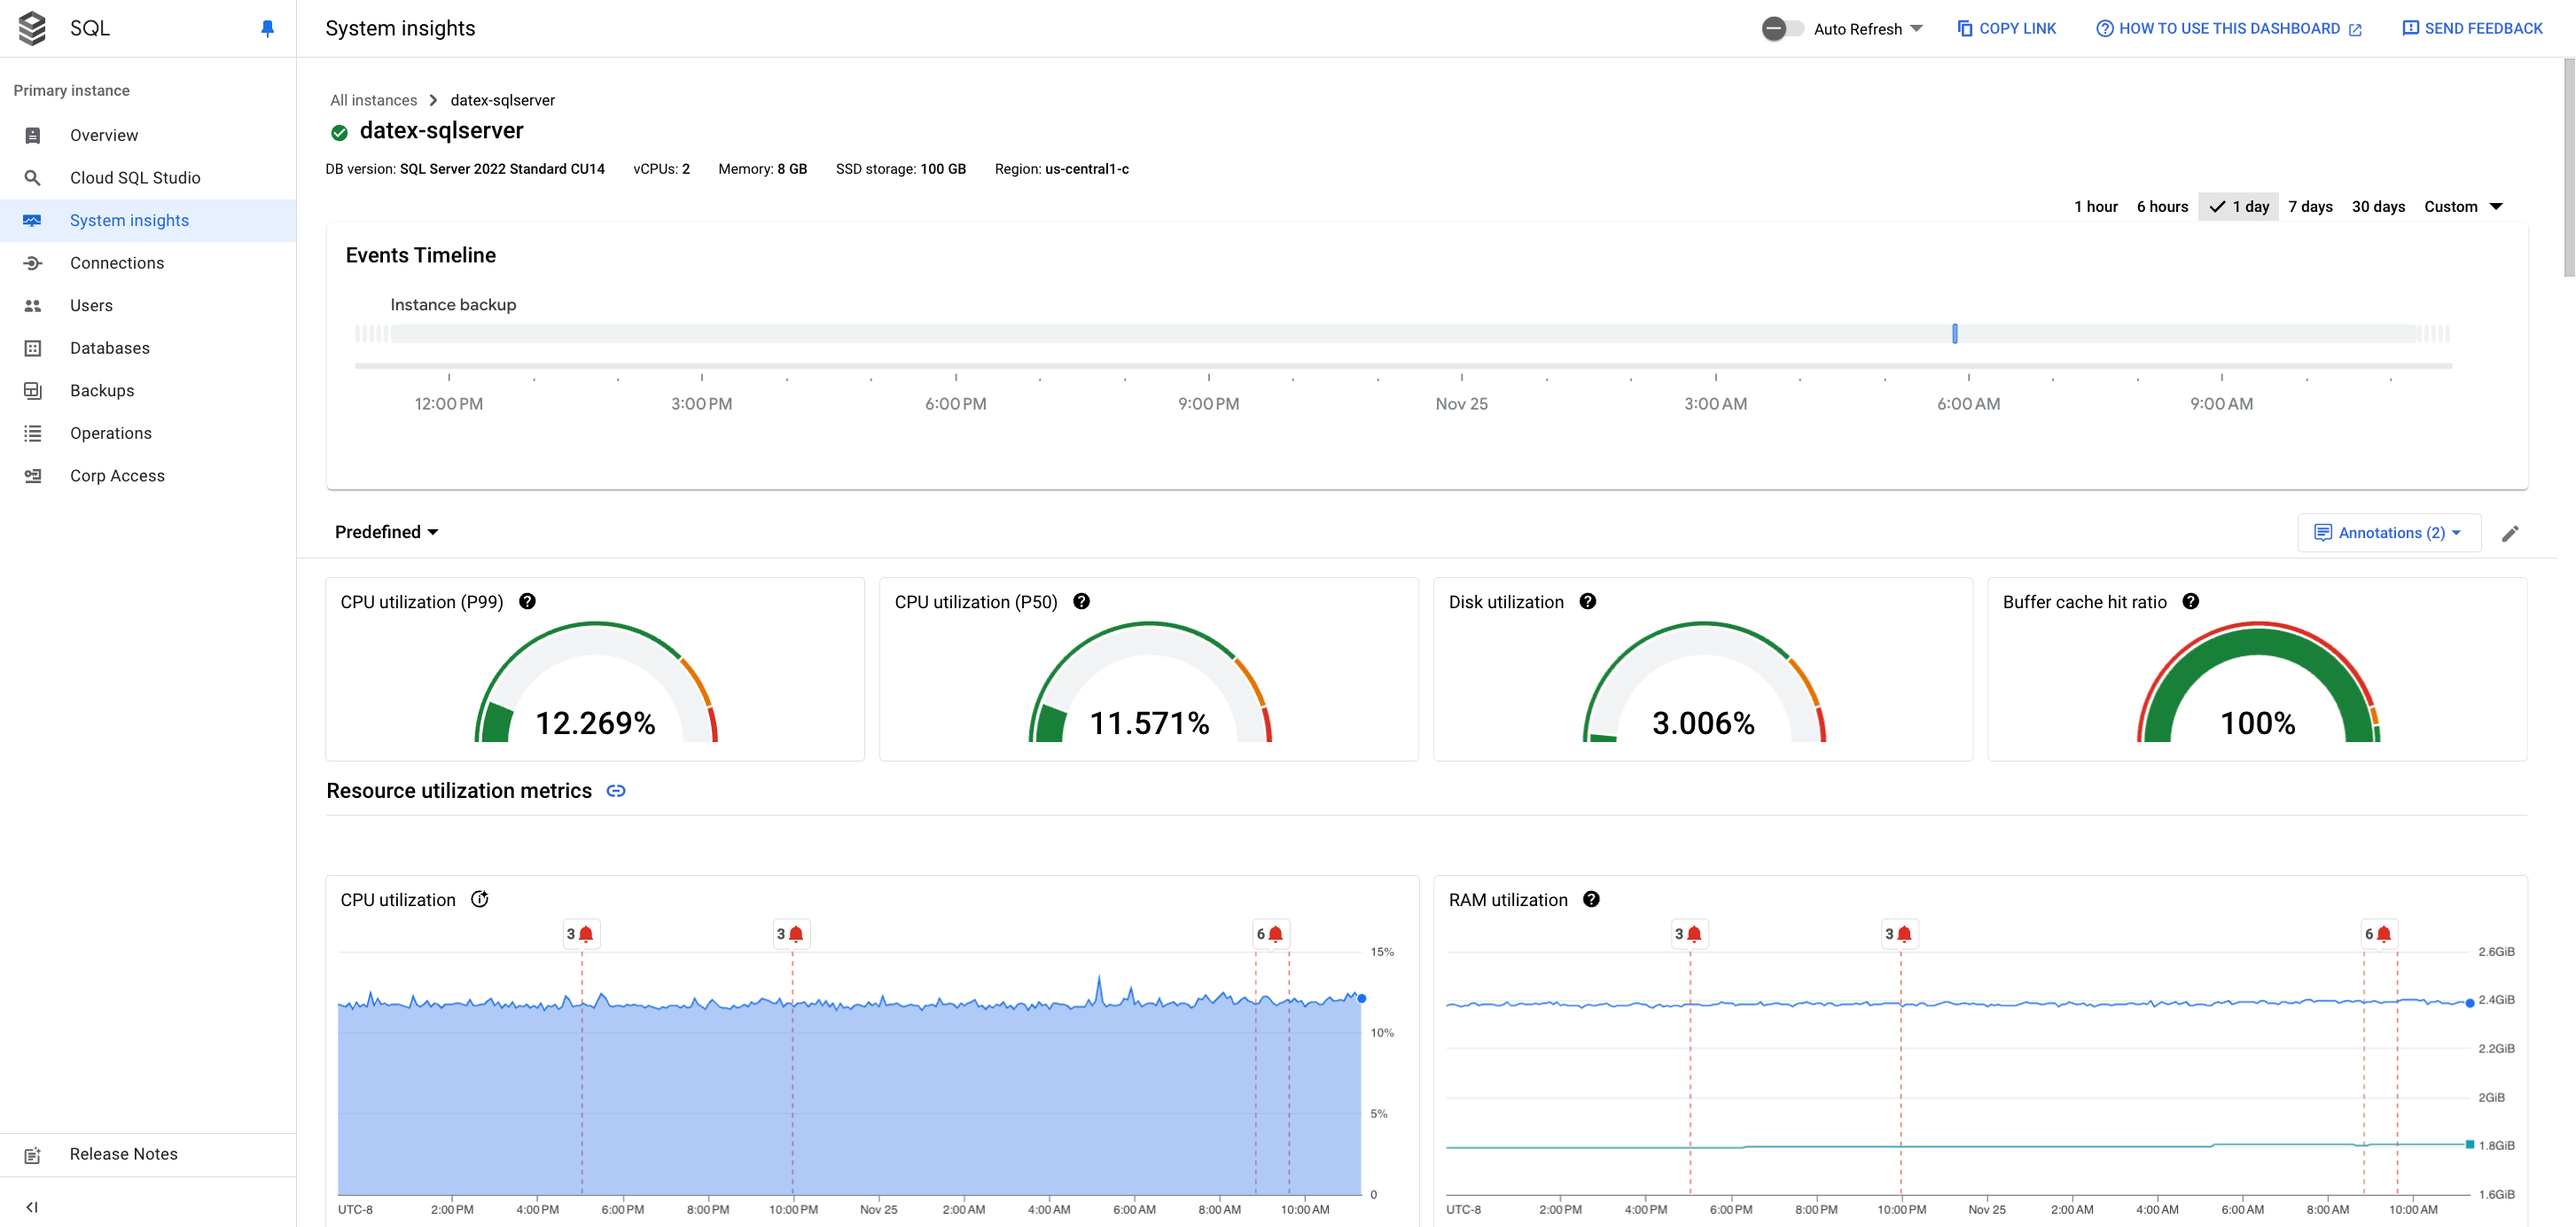 **Figure 1.** Dashboard image showing events timeline and summary cards.
The System insights dashboard shows the following information:
1. Your instance details
2. [Events timeline](https://docs.cloud.google.com/sql/docs/sqlserver/use-system-insights.md.txt#events_timeline):
shows the system events, in a chronological order.
This information helps you evaluate the impact of system events on the health
and performance of the instance.
3. [Summary cards](https://docs.cloud.google.com/sql/docs/sqlserver/use-system-insights.md.txt#summary):
provide an overview of the instance health and performance by displaying the
latest and aggregated values for the CPU utilization, disk utilization, and
log errors metrics.
4. [Metrics charts](https://docs.cloud.google.com/sql/docs/sqlserver/use-system-insights.md.txt#metrics): show the
information about the operating system and database metrics that help you gain
insight into several issues, such as throughput, latency, and cost.
The dashboard offers the following high-level options:
- To create a customized dashboard, click **Mode edit**.
- To keep the dashboard up to date, enable the

**Auto Refresh** option. When you enable **Auto Refresh**, the dashboard data
updates every minute. This feature isn't compatible with customized time
periods.
- The time selector shows `1 day` selected by default. To change the period,
select one of the other predefined periods or click **Custom** and define a
start and end time. Data is available for the last 30 days.
- To create an absolute link to the dashboard, click the **Copy Link** button.
You can share this link with other Cloud SQL users who have the same
permissions.
- To create an alert for a specific event, click **Notification**.
- To display specific alerts, click **Annotations**.
## Summary cards
The following table describes the summary cards displayed at the top of the System
Insights dashboard. These cards provide a brief overview of the instance's health
and performance during the chosen time period.
| Summary card | Description |
|---|---|
| CPU utilization - P50 | The P50 CPU utilization values. |
| CPU utilization - P99 | The P99 CPU utilization values. |
| Disk utilization | The latest disk utilization value. |
| Buffer cache hit ratio | The percentage of pages found in the buffer cache without having to read from a disk. |
## Metrics charts
A chart card for a sample metric appears as follows.
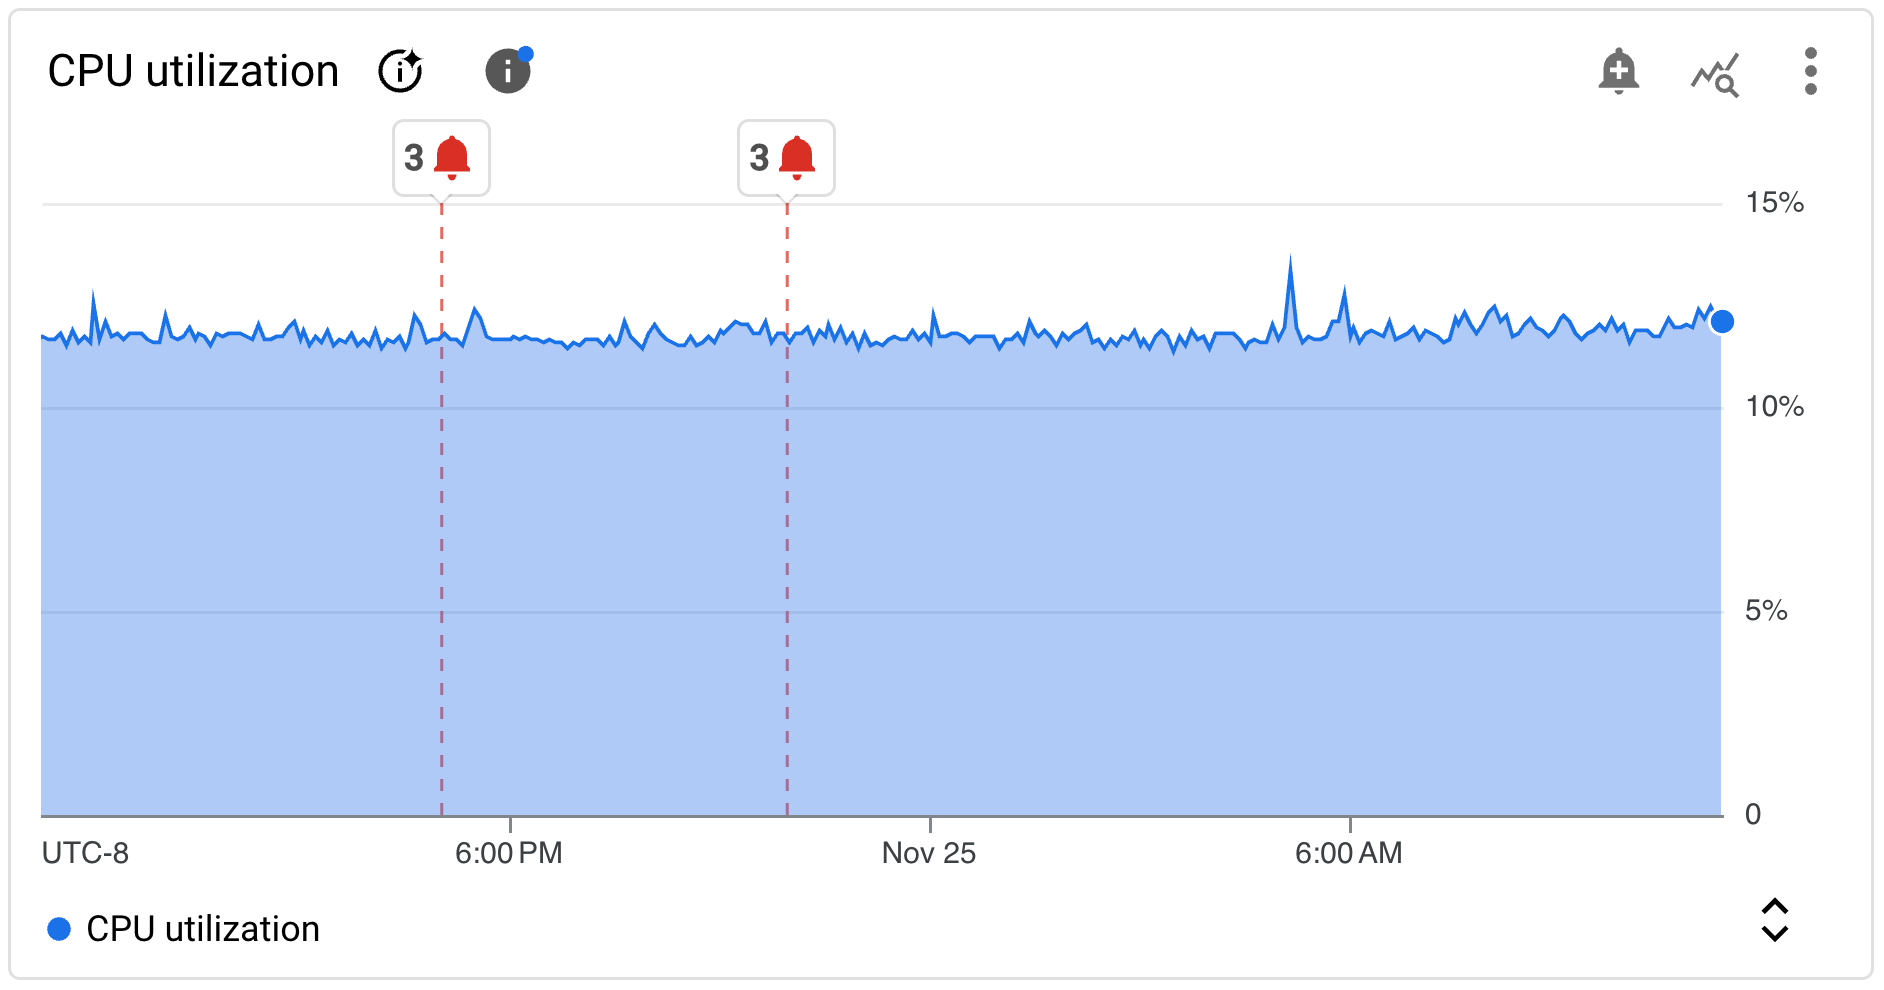 Metric chart showing metrics data.
The toolbar on each chart card provides the following set of standard options:
- To view metric values for a specific moment in the selected period, move the
cursor over the chart.
- To zoom in on a chart, click the chart and drag horizontally along the x-axis
or vertically along the y-axis. To revert the zoom operation, click
**Reset zoom**. Or, click one of the predefined time periods at the top of the
dashboard. Zoom operations apply at the same time to all charts on a dashboard.
- To view additional options, click
**More chart options**. Most charts offer these options:
- To view a chart in full-screen mode, click **View in full screen** . To exit
full-screen mode, click **Cancel**.
- Hide or collapse the legend.
- Download a PNG or CSV file of the chart.
- **View in Metrics Explorer** . View the metric in [Metrics Explorer](https://docs.cloud.google.com/monitoring/charts/metrics-explorer.md.txt).
You can view other Cloud SQL metrics in the Metrics Explorer after
selecting the **Cloud SQL Database** resource type.
- To create a custom dashboard, click
**Customize dashboard** and give it a name. Or, expand the **Predefined** menu
and select an existing custom dashboard.
- To view a metric chart's data in detail, click
**Explore data**. Here, you can filter specific metrics and choose how the
chart displays:
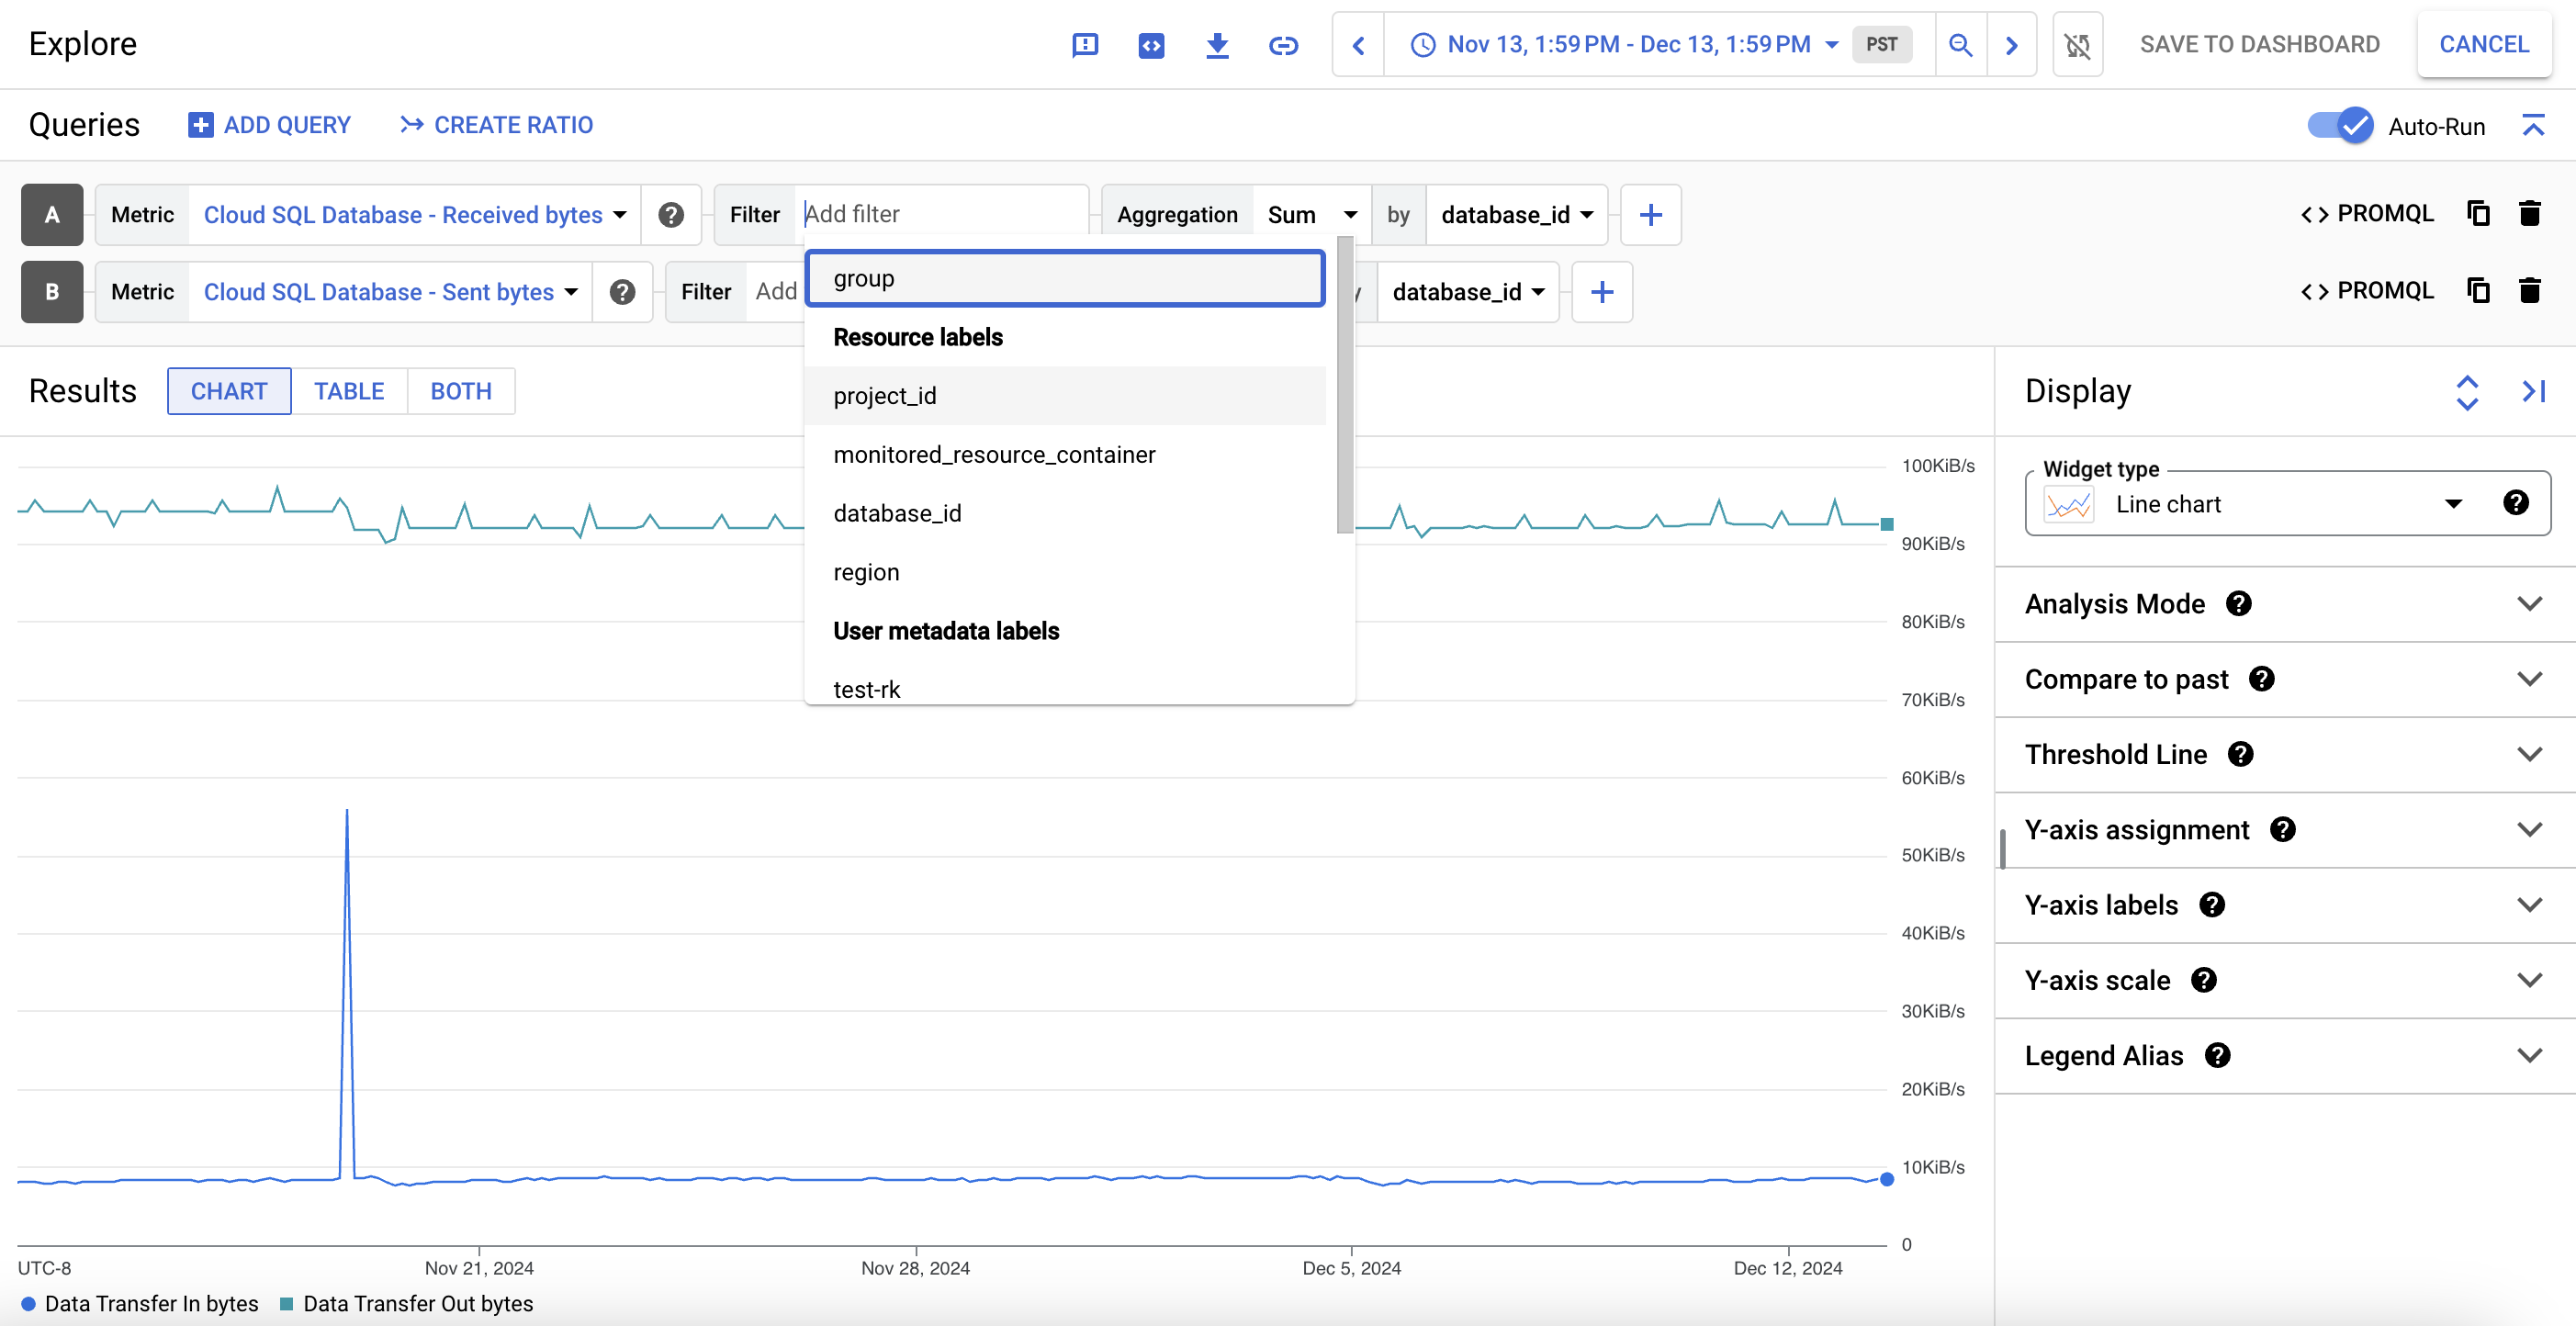
To save this customized view as a metric chart, click **Save to dashboard**.
## Default metrics
The following table describes the Cloud SQL metrics that appear by default
on the Cloud SQL System insights dashboard.
The metric type strings follow one of the following prefixes:
- `cloudsql.googleapis.com/database/`
- `cloudsql.googleapis.com/per_database/`
> [!NOTE]
> **Note:** Cloud SQL for SQL Server instances with more than 500 databases report a single aggregated value for database metrics.
Metrics are grouped by category:
- [Resource utilization](https://docs.cloud.google.com/sql/docs/sqlserver/use-system-insights.md.txt#sqlserver-resource)
- [Memory](https://docs.cloud.google.com/sql/docs/sqlserver/use-system-insights.md.txt#sqlserver-memory)
- [Performance](https://docs.cloud.google.com/sql/docs/sqlserver/use-system-insights.md.txt#sqlserver-performance)
- [Replication](https://docs.cloud.google.com/sql/docs/sqlserver/use-system-insights.md.txt#sqlserver-replication)
- [Other](https://docs.cloud.google.com/sql/docs/sqlserver/use-system-insights.md.txt#sqlserver-other)
### Resource utilization
| Metric name and type | Description |
|---|---|
| CPU utilization `database/cpu/utilization` | The current CPU utilization represented as a percentage of the reserved CPU that's currently in use. |
| Memory usage `database/memory/usage` | The RAM usage in bytes. |
| Total memory usage `database/memory/total_usage` | The total RAM usage in bytes. |
| Bytes used `database/disk/bytes_used` | The data utilization in bytes. |
| Disk quota `database/disk/quota` | The maximum data disk size in bytes. |
| Disk storage by type `database/disk/bytes_used_by_data_type` | The breakdown of instance disk usage by data types, including `Data`, `pitr_transaction_log_backups`, `Logs`, `error_logs`, `memory_dumps`, and `Other`. This metric helps you understand your storage costs. For more information about storage usage charges, see [Storage and networking pricing](https://cloud.google.com/sql/pricing#storage-networking-prices). Cloud SQL uses transaction log backups for [point-in-time recovery (PITR)](https://docs.cloud.google.com/sql/docs/sqlserver/backup-recovery/restore.md.txt#tips-pitr). When transaction logs for PITR are stored on disk, these logs use storage space (reported under `pitr_transaction_log_backups`) and are deleted automatically with their associated automatic backups after the retention period set for [`transactionLogRetentionDays`](https://docs.cloud.google.com/sql/docs/sqlserver/admin-api/rest/v1/instances.md.txt#BackupConfiguration.FIELDS.transaction_log_retention_days) is met. `transactionLogRetentionDays` is the number of days for which Cloud SQL retains transaction logs for PITR, from `1` to `35` for Cloud SQL Enterprise Plus edition and `1` to `7` for Cloud SQL Enterprise edition. For instances that store transaction logs in Cloud Storage, the logs are stored in the same region as the primary instance and don't consume instance disk space. To avoid unexpected storage issues while using PITR when logs are stored on disk, we recommend that you enable [automatic storage increases](https://docs.cloud.google.com/sql/docs/sqlserver/instance-settings.md.txt#automatic-storage-increase-2ndgen). |
| Disk read I/O `database/disk/read_ops_count` | The change in count of data disk read I/O operations since the previous reported metric. Sampled every 60 seconds. |
| Disk write I/O `database/disk/write_ops_count` | The change in count of data disk write I/O operations since the previous reported metric. Sampled every 60 seconds. |
| Received bytes `database/network/received_bytes_count` | The change in count of bytes received through the network since the previous reported metric. Sampled every 60 seconds. |
| Sent bytes `database/network/sent_bytes_count` | The change in count of bytes sent through the network since the previous reported metric. Sampled every 60 seconds. |
### Memory
| Metric name and type | Description |
|---|---|
| Buffer cache hit ratio `database/sqlserver/memory/buffer_cache_hit_ratio` | The current percentage of pages found in the buffer cache without having to read from disk. The ratio is the total number of cache hits divided by the total number of cache lookups. |
| Memory grants pending `database/sqlserver/memory/memory_grants_pending` | The current number of processes waiting for a workspace memory grant. |
| Free list stalls `database/sqlserver/memory/free_list_stall_count` | The total number of requests that waited for a free page. |
| Pages Swapped In Count `database/swap/pages_swapped_in_count` | The total count of pages swapped in of disk since the system was booted. |
| Pages Swapped Out Count `database/swap/pages_swapped_out_count` | The total count of pages swapped out of disk since the system was booted. |
| Checkpoint pages `database/sqlserver/memory/checkpoint_page_count` | The total number of pages flushed to disk by a checkpoint or other operation that requires all dirty pages to be flushed. |
| Lazy writes `database/sqlserver/memory/lazy_write_count` | The total number of buffers written by the buffer manager's lazy writer. The lazy writer is a system process that flushes out batches of dirty, aged buffers (buffers that contain changes that must be written back to disk before the buffer can be reused for a different page) and makes them available to user processes. |
| Page life expectancy `database/sqlserver/memory/page_life_expectancy` | The current number of seconds a page will stay in the buffer pool without references. |
| Page operations `database/sqlserver/memory/page_operation_count` | The total number of physical database page reads or writes. This statistic counts physical page reads or writes across all databases. |
| Page splits `database/sqlserver/transaction/page_split_count` | The total number of page splits that occur as the result of overflowing index pages. |
| Engine memory `database/sqlserver/memory/committed_kb` `database/sqlserver/memory/committed_target_kb` | The memory committed in the SQL Server memory manager, in kilobytes (KB). **Committed** (`committed_kb`) is the amount of memory committed by the memory manager, excluding reserved memory. **Committed Target** (`committed_target_kb`) is the amount of memory that the memory manager can consume. If **Committed Target** is larger than **Committed** , then the memory manager tries to obtain more memory. If **Committed Target** is smaller than **Committed**, then the memory manager tries to shrink the amount of committed memory. |
### Performance
| Metric name and type | Description |
|---|---|
| Deadlocks `database/sqlserver/transaction/deadlock_count` | The total number of lock requests that resulted in a deadlock. |
| Transactions started `database/sqlserver/transaction/transaction_count` | The total number of transactions started. |
| Batch requests `database/sqlserver/transaction/batch_request_count` | The total number of Transact-SQL command batches received. |
| SQL compilations `database/sqlserver/transaction/sql_compilation_count` | The total number of SQL compilations. |
| SQL recompilations `database/sqlserver/transaction/sql_recompilation_count` | The total number of SQL recompilations. |
| Processes blocked `database/sqlserver/connections/processes_blocked` | The current number of blocked processes. |
| Lock wait time `database/sqlserver/transactions/lock_wait_time` | The total time lock requests were waiting for locks. |
| Lock waits `database/sqlserver/transactions/lock_wait_count` | The total number of lock requests that required the caller to wait. |
| Wait time `database/sqlserver/wait_time` | The amount of time spent waiting, per second. By default, the dashboard groups this metric by wait category. You can also group it by wait type. |
| Wait count `database/sqlserver/wait_count` | The number of waits per second. By default, the dashboard groups this metric by wait category. You can also group it by wait type. |
| Average batch execution time `database/sqlserver/transactions/batch_requests_elapsed_time` `database/sqlserver/transactions/batch_requests_elapsed_time_count` | The average time, in milliseconds, to run Transact-SQL command batches. This value is calculated by dividing the total elapsed time of completed batch requests by the number of completed batch requests. |
| Average batch execution CPU time `database/sqlserver/transactions/batch_requests_cpu_time` `database/sqlserver/transactions/batch_requests_cpu_time_count` | The average CPU time, in milliseconds, to run Transact-SQL command batches. This value is calculated by dividing the total CPU time of completed batch requests by the number of completed batch requests. |
### Replication
| Metric name and type | Description |
|---|---|
| Replication visibility delay `per_database/sqlserver/replication/delay` | The time difference, in seconds, between the most recent transaction committed on the primary instance and the commit time of the most recent transaction redone on the read replica. *Note: This metric appears on the dashboard only if the instance is a primary instance with read replicas or read pools, or if the instance is a read replica or in a read pool.* |
| Estimated data loss window `per_database/sqlserver/replication/seconds_behind_master` | The number of seconds since the [hardening](https://learn.microsoft.com/en-us/azure/well-architected/security/harden-resources) of the earliest hardened [log sequence number (LSN)](https://learn.microsoft.com/en-us/sql/relational-databases/sql-server-transaction-log-architecture-and-management-guide?view=sql-server-ver17) on the primary instance that is yet to be hardened on the read replica. When performing a failover or promoting a replica, choose the replica with the lowest value for this metric to minimize data loss. *Note: This metric appears on the dashboard only if the instance is a primary instance with read replicas or read pools, or if the instance is a read replica or in a read pool.* |
| Redo queue size `per_database/sqlserver/replication/redo_queue_size` | The number of log records in the log files of the read replica that aren't yet redone. *Note: This metric appears on the dashboard only if the instance is a primary instance with read replicas or read pools, or if the instance is a read replica or in a read pool.* |
| Logsend queue size `per_database/sqlserver/replication/logsend_queue_size` | Total size of log records in the log files of the primary database that haven't been sent to the read replica. *Note: This metric appears on the dashboard only if the instance is a primary instance with read replicas or read pools, or if the instance is a read replica or in a read pool.* |
### Other
| Metric name and type | Description |
|---|---|
| Cloud SQL connections `database/network/connections` | The number of connections to databases on the Cloud SQL instance. |
| Login attempts `database/sqlserver/connections/login_attempt_count` | The total number of login attempts since the last restart of SQL Server service. This does not include pooled connections. |
| Logouts `database/sqlserver/connections/logout_count` | The total number of logout operations since the last restart of SQL Server service. |
| Connection resets `database/sqlserver/connections/connection_reset_count` | The total number of logins started from the connection pool since the last restart of SQL Server service. |
| Log entries `log_entry_count` | The number of log entries, either written directly or routed to this project via project-sink, that are stored in at least one log bucket. By default, log entries are stored for 30 days. Excluded logs are not counted. |
| Full scans `database/sqlserver/transactions/full_scan_count` | The total number of unrestricted full scans. These can be either base-table or full-index scans. |
For more information, see [Cloud SQL metrics](https://docs.cloud.google.com/sql/docs/sqlserver/admin-api/metrics.md.txt).
## Events timeline
The dashboard provides the details of the following events:
| Event name | Description | Operation type |
|---|---|---|
| `Instance restart` | Restarts the Cloud SQL instance | `RESTART` |
| `Instance failover` | Initiates a manual failover of a high availability (HA) primary instance to a standby instance, which becomes the primary instance. | `FAILOVER` |
| `Instance maintenance` | Indicates that the instance is currently in maintenance. Maintenance typically causes the instance to be unavailable for 1 to 3 minutes. | `MAINTENANCE` |
| `Instance backup` | Performs an instance backup. | `BACKUP_VOLUME` |
| `Instance update` | Updates the settings of a Cloud SQL instance. | `UPDATE` |
| `Promote replica` | Promotes a Cloud SQL replica instance. | `PROMOTE_REPLICA` |
| `Start replica` | Starts replication on a Cloud SQL read replica instance. | `START_REPLICA` |
| `Stop replica` | Stops replication on a Cloud SQL read replica instance. | `STOP_REPLICA` |
## What's next
- [About instance settings](https://docs.cloud.google.com/sql/docs/sqlserver/instance-settings.md.txt)
- [Cloud SQL metrics](https://docs.cloud.google.com/sql/docs/sqlserver/admin-api/metrics.md.txt)
- [REST Resource: instances](https://docs.cloud.google.com/sql/docs/sqlserver/admin-api/rest/v1beta4/instances.md.txt)