This document explains how to set up, customize, and test alerts for service
health events.
Personalized Service Health integrates with Cloud Monitoring log alerts so you
can configure and receive alerts. You can create notifications for the following
conditions:
- When new incidents are reported.
- When existing incidents are updated, such as when Google Cloud Support sends a new message.
- When incidents for specific Google Cloud products or locations such as regions are created or updated.
- When specific details of existing incidents are updated, such as state and relevance.
Since these notifications use log alerts, each notification is associated
with a Monitoring incident. Each notification includes links to
the incident's page and a direct link to the Service Health dashboard.
Learn more about
[investigating incidents](https://cloud.google.com/monitoring/alerts/log-based-incidents#details-page).
Once you have configured an alert, you will receive a notification each time
your alerting policy conditions are met. These notifications are subject to
[Monitoring limits](https://cloud.google.com/monitoring/quotas#alerting_uptime_limits);
an example is 20 alerts per policy per day per project.
The following sections show how to configure a log alerting policy and provide
examples for common alert scenarios. Log alerts rely on
[notification channels](https://cloud.google.com/monitoring/support/notification-options),
which support a variety of integrations including email, SMS, Pub/Sub,
webhooks, Slack, and PagerDuty.
To route an alert to a destination other than the options
listed earlier, consider using a webhook. For example, you can configure a
webhook to ServiceNow. For more information, see
[Configure webhook in Google Cloud](https://docs.servicenow.com/bundle/tokyo-it-service-management/page/product/site-reliability-ops/task/sro-configure-google-cloud.html)
in the ServiceNow documentation.
## Alert notification formats
Alert notification formats vary by [notification channel](https://cloud.google.com/monitoring/support/notification-options).
### Email
If you configure the alert to send an email, when the alerting condition is met,
a message using the address
alerting-noreply@google.com will be delivered to the email address of your
choosing.
### Slack
If you configure your custom notification to post to Slack, a message from the
Cloud Monitoring application will appear in the channel you selected when the
event occurs.
## Set up an alerting policy
An alert uses an alerting policy, which describes the circumstances under which
you want to be alerted and how you want to be notified.
You can configure alerting policies within the Service Health dashboard
or using the Google Cloud CLI.
Alerting policies require a Cloud Monitoring notification channel, which
defines where an alert is sent. If you don't have a notification channel, you
can create one in the [Google Cloud console](https://cloud.google.com/monitoring/support/notification-options)
or using the [Monitoring API](https://cloud.google.com/monitoring/alerts/using-channels-api#api-create-channels).
### Within the Service Health dashboard
See the [quickstart](https://docs.cloud.google.com/service-health/docs/configure-alerts-dashboard.md.txt).
### Using the gcloud CLI
To set up an alerting policy using the gcloud CLI:
1. Get your notification channel ID.
a. [List the notification channel IDs](https://cloud.google.com/monitoring/alerts/using-channels-api#api-list-channels).
gcloud config set project PROJECT_ID
gcloud beta monitoring channels list
b. Look for entries with `projects/PROJECT_ID/notificationChannels/`.
These entries are the notification channel IDs.
2. Create a `policy.json` file with the following content:
- ALERT_NAME appears on the notification. Example: "Google Cloud SQL
incident"
- ALERT_CONDITION defines when to alert.
- When defining conditions, use the values found at [Google Cloud products](https://docs.cloud.google.com/service-health/docs/supported-products-locations.md.txt) and [locations](https://docs.cloud.google.com/service-health/docs/supported-products-locations.md.txt#locations).
- Example alert conditions:
|---|---|
| Alert condition | ALERT_CONDITION value |
| Receive alerts for any Cloud SQL event | `jsonPayload.impactedProductIds =~ \"hV87iK5DcEXKgWU2kDri\"` |
| Receive alerts for any event occurring in zone `us-central1-a` | `jsonPayload.impactedLocations =~ \"us-central1-a\"` |
See more [examples of alerting conditions](https://docs.cloud.google.com/service-health/docs/example-alerting-policies.md.txt#example-alert-conditions).
- NOTIFICATION_CHANNEL is the notification channel ID, which you
fetched using the list command in the previous step. Example:
`projects/PROJECT_ID/notificationChannels/885798905074`.
The following snippet shows an example of the `policy.json` file.
```json
{
"displayName": "ALERT_NAME",
"combiner": "OR",
"conditions": [ {
"displayName": "Log match condition",
"conditionMatchedLog": {
"filter": "ALERT_CONDITION",
} } ],
"notificationChannels": [ "NOTIFICATION_CHANNEL" ],
}
```
3. Create the Cloud Monitoring policy.
gcloud config set project PROJECT_ID
gcloud monitoring policies create --policy-from-file="policy.json"
## Customize the content of the alert
You can set the fields inside the notification through the following fields in
the JSON file:
- `labelExtractors`: The properties to include in the header of the notification. To customize these properties, see the [LabelExtractors guide](https://docs.cloud.google.com/logging/docs/reference/v2/rest/v2/projects.metrics.md.txt#LogMetric.FIELDS.value_extractor).
- `content`: The formatting of the email notification. You can use [markdown variable substitution](https://cloud.google.com/monitoring/alerts/doc-variables), which lets you use `labelExtractors` as variables. To customize these variables, see this [guide](https://cloud.google.com/monitoring/api/ref_v3/rest/v3/projects.alertPolicies#documentation).
See [example alerting policies and conditions](https://docs.cloud.google.com/service-health/docs/example-alerting-policies.md.txt) for
ways to customize your alerts.
## Test your alert
To test the alert, you'll use a sample test log using Cloud Logging. The test
log shows the alert logic you previously configured.
### Using the Google Cloud console
Do the following:
1. Go to the [reference page for the entries:write method](https://docs.cloud.google.com/logging/docs/reference/v2/rest/v2/entries/write.md.txt?apix=true&apix_params=%7B%22resource%22:%7B%22entries%22:%5B%7B%22logName%22:%22projects/%5BPROJECT_ID%5D/logs/servicehealth.googleapis.com%252Factivity%22,%22resource%22:%7B%22type%22:%22servicehealth.googleapis.com/Event%22,%22labels%22:%7B%22resource_container%22:%22%5BPROJECT_ID%5D%22,%22location%22:%22global%22,%22event_id%22:%22U4AqrjwFQYi5fFBmyAX-Gg%22%7D%7D,%22labels%22:%7B%22servicehealth.googleapis.com/new_event%22:%22true%22,%22servicehealth.googleapis.com/updated_fields%22:%22%5B%5D%22%7D,%22jsonPayload%22:%7B%22@type%22:%22type.googleapis.com/google.cloud.servicehealth.logging.v1.EventLog%22,%22category%22:%22INCIDENT%22,%22title%22:%22EXAMPLE...+NOT+REAL+INCIDENT%22,%22description%22:%22EXAMPLE+FOR+TESTING,+NOT+REAL+INCIDENT.+We+are+experiencing+an+issue+with+Google+Cloud+infrastructure+components+at+us-east1,+australia-southeast2.+Our+engineering+team+continues+to+investigate+the+issue.+We+apologize+to+all+who+are+affected+by+the+disruption.%22,%22updateTime%22:%222023-11-14T22:26:40Z%22,%22endTime%22:%222023-11-14T22:13:20Z%22,%22impactedLocations%22:%22%5B'us-east1','australia-southeast2'%5D%22,%22impactedProducts%22:%22%5B'CloudSQL'%5D%22,%22nextUpdateTime%22:%222023-11-14T22:40:00Z%22,%22startTime%22:%222020-09-13T12:26:40Z%22,%22state%22:%22ACTIVE%22,%22detailedState%22:%22CONFIRMED%22,%22relevance%22:%22RELATED%22%7D%7D%5D%7D%7D), which lets you write log entries to Cloud Logging. A window that lets you try the method appears.
2. In the request body, change PROJECT_ID to your own project.
3. Change any `jsonPayload` fields in the request body, depending on the alert
condition you're testing. You can also check the
[event_log.proto](https://github.com/googleapis/googleapis/blob/master/google/cloud/servicehealth/logging/v1/event_log.proto)
schema and tweak the values in the log to test specific scenarios that
you are interested in.
```json
{
"entries": [
{
"logName": "projects/PROJECT_ID/logs/servicehealth.googleapis.com%2Factivity",
"resource": {
"type": "servicehealth.googleapis.com/Event",
"labels": {
"resource_container": "PROJECT_ID",
"location": "global",
"event_id": "U4AqrjwFQYi5fFBmyAX-Gg"
}
},
"labels": {
"servicehealth.googleapis.com/new_event": "true",
"servicehealth.googleapis.com/updated_fields": "[]"
},
"jsonPayload": {
"@type": "type.googleapis.com/google.cloud.servicehealth.logging.v1.EventLog",
"category": "INCIDENT",
"title": "EXAMPLE... NOT REAL INCIDENT",
"description": "EXAMPLE FOR TESTING, NOT REAL INCIDENT. We are experiencing an issue with Google Cloud infrastructure components at us-east1, australia-southeast2. Our engineering team continues to investigate the issue. We apologize to all who are affected by the disruption.",
"updateTime": "2022-07-15T22:26:40Z",
"endTime": "2022-07-16T22:13:20Z",
"impactedLocations": "['us-east1', 'australia-southeast2']",
"impactedProducts": "['CloudSQL']",
"impactedProductIds": "['hV87iK5DcEXKgWU2kDri']",
"startTime": "2022-07-13T12:26:40Z",
"nextUpdateTime": "2022-07-13T16:26:40Z",
"state": "ACTIVE",
"detailedState": "CONFIRMED",
"relevance": "RELATED"
}
}
]
}
```
4. Click **Execute**. A window where Google APIs Explorer requests access to
your account appears.
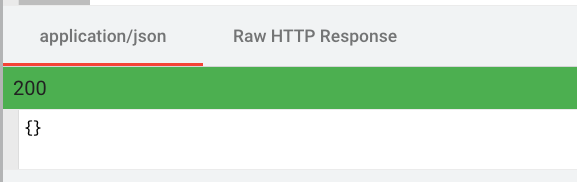
5. Allow Google APIs Explorer access. The window with the request body shows
the following screenshot, which indicates success.
6. Wait a few minutes, then verify that the alert fired.
1. In the Google Cloud console, go to the **Cloud Monitoring** \>
**Incidents** page.
[Go to Incidents](https://console.cloud.google.com/monitoring/alerting/incidents)
2. Check if you received an alert on the notification channel used by the
alerting policy.
If you need to test the alert again, wait at least 5 minutes before doing
so.
### Using gcloud
You can also create a test log entry by calling the Cloud Logging API using
the gcloud command.
1. (Optional) Check your current project.
gcloud config list
2. Set your current project.
gcloud_name config set project PROJECT_ID
3. [Write the test log entry](https://docs.cloud.google.com/sdk/gcloud/reference/logging/write.md.txt).
gcloud logging write --payload-type=json
LOG_NAME
'{ "category": "INCIDENT", "relevance": "IMPACTED", "@type": "type.googleapis.com/google.cloud.servicehealth.logging.v1.EventLog", "description": "This is a test log entry"}'
4. Wait a few minutes, then verify that the alert fired.