This planning guide focuses solely on the *SAP HANA monitoring metrics collection* feature
of Google Cloud's Agent for SAP. For information about the agent and all its
features, see
[Google Cloud's Agent for SAP planning guide](https://docs.cloud.google.com/sap/docs/agent-for-sap/latest/planning.md.txt).
On Linux, Google Cloud's Agent for SAP can help you monitor your SAP HANA instances
and the underlying infrastructure. This is delivered through the collection of
[SAP HANA monitoring metrics](https://docs.cloud.google.com/sap/docs/agent-for-sap/latest/planning.md.txt#sap_hana_monitoring_metrics),
which you can enable after installing the agent on your Compute Engine
instances.
> [!NOTE]
> **Note:** The collection of SAP HANA monitoring metrics is supported only on Linux. It is not supported on Windows.
When you enable the collection of the SAP HANA monitoring metrics, the agent
queries your SAP HANA instances and sends the collected metrics to
[Cloud Monitoring](https://cloud.google.com/monitoring).
You can visualize the collected metrics using dashboards in
Monitoring. You can also set up alerts in
Monitoring based on metric thresholds. For information about
creating dashboards and alerts, see
[Cloud Monitoring documentation](https://docs.cloud.google.com/monitoring/docs/how-to).
For information about how to configure Google Cloud's Agent for SAP to collect
the SAP HANA monitoring metrics, see
[Configure SAP HANA Monitoring metrics collection](https://docs.cloud.google.com/sap/docs/agent-for-sap/latest/configure-sap-hana-monitoring.md.txt).
The SAP HANA monitoring metrics that Google Cloud's Agent for SAP collects and
sends to Monitoring are classified by
Monitoring as
[*chargeable metrics*](https://cloud.google.com/stackdriver/pricing#metrics-chargeable)
and priced by ingested volume.
The sampling interval of your queries, which determines how frequently
the agent queries your SAP HANA instances for metrics, affects
the volume of metrics that get sent to Monitoring. SAP HANA monitoring metrics are slow-changing metrics that, once enabled, are
collected every 5 minutes by default.
For more information about Monitoring pricing, see
[Google Cloud Observability pricing](https://cloud.google.com/stackdriver/pricing#monitoring-costs).
For more information about query-sampling intervals, see
[Sample interval for queries](https://docs.cloud.google.com/sap/docs/agent-for-sap/latest/monitoring-sap-hana.md.txt#sample_intervals).
### Sample cost estimate
To see a sample cost estimate for the collection of the SAP HANA monitoring
metrics using Google Cloud's Agent for SAP, see
[Pricing example for metrics charged by bytes ingested](https://docs.cloud.google.com/sap/docs/agent-for-sap/latest/planning.md.txt#pricing_example_for_metrics_charged_by_bytes_ingested).
## About queries
For collecting the SAP HANA monitoring metrics, Google Cloud's Agent for SAP runs
SQL queries on SAP HANA instances. The syntax for these queries are defined by
SAP in
[SAP HANA SQL and System Views Reference](https://help.sap.com/viewer/4fe29514fd584807ac9f2a04f6754767/2.0.02).
Google Cloud's Agent for SAP supports the following types of queries:
- [Default queries](https://docs.cloud.google.com/sap/docs/agent-for-sap/latest/monitoring-sap-hana.md.txt#default_queries)
- [Custom queries](https://docs.cloud.google.com/sap/docs/agent-for-sap/latest/monitoring-sap-hana.md.txt#custom_queries)
### Default queries
The default queries are built-in queries that gather the most commonly used
SAP HANA metrics.
The frequency of the default queries is determined by the global
*`sample_interval_sec`* parameter set at the beginning of the
`hana_monitoring_configuration` section in the agent's configuration file.
By default this value is set to 300 seconds (5 minutes). You can modify this
global default. Unlike for custom queries, you cannot set a
sample interval for an individual default query.
Although you can't modify the default queries, you can
disable any of the default queries that you don't need. For instructions to
disable a default query, see
[Disable a SQL query](https://docs.cloud.google.com/sap/docs/agent-for-sap/latest/configure-sap-hana-monitoring.md.txt#disable_a_sql_query).
For more information about the default queries, the metrics that they
collect, and the underlying SQL statements that they use, see
[Default query reference](https://docs.cloud.google.com/sap/docs/agent-for-sap/latest/monitoring-sap-hana.md.txt#default_query_reference).
### Custom queries
To help you get greater insights into your SAP HANA instances,
Google Cloud's Agent for SAP lets you define and run *custom queries*.
You define *custom queries* in the `queries` section,
which is specified under the `hana_monitoring_configuration` section of the
agent's configuration file.
For each custom query, you can specify a `sample_interval_sec` parameter
that overrides the default `sample_interval_sec` parameter. For more information, see
[Sample interval for queries](https://docs.cloud.google.com/sap/docs/agent-for-sap/latest/monitoring-sap-hana.md.txt#sample_intervals).
The [example custom queries](https://docs.cloud.google.com/sap/docs/agent-for-sap/latest/monitoring-sap-hana.md.txt#example_custom_queries) presented in this document
can help you write your own queries. For more information about creating custom
queries, see
[Defining custom queries](https://docs.cloud.google.com/sap/docs/agent-for-sap/latest/monitoring-sap-hana.md.txt#defining_custom_queries).
### Sample interval for queries
For SAP HANA monitoring metrics collection using Google Cloud's Agent for SAP, you
can define a global *`sample interval_sec`* for all queries and an individual
sample interval for each [custom query](https://docs.cloud.google.com/sap/docs/agent-for-sap/latest/monitoring-sap-hana.md.txt#custom_queries). A sample interval
determines the frequency at which the agent queries your SAP HANA instances for
metrics.
The default sample interval for all queries is 300 seconds (5 minutes). You can
adjust the default sample interval by specifying a different value on
the `sample_interval_sec` parameter at the beginning of the
`hana_monitoring_configuration` section of the agent's configuration file.
You can override the default sample interval for an individual custom
query by specifying the `sample_interval_sec` parameter in the definition of
that custom query.
> [!NOTE]
> **Note:** Cloud Monitoring bills for metrics by ingested volume, so a short sample interval that results in frequent queries could potentially increase the cost of your custom metrics. For more information, see [Google Cloud Observability pricing](https://cloud.google.com/stackdriver/pricing#monitoring-costs).
## Installation architecture
You can install Google Cloud's Agent for SAP on a Compute Engine instance.
You can install Google Cloud's Agent for SAP either on the same host as SAP
HANA instance or on a different host.
The agent can also monitor SAP HANA instances that are running on on-premises
hosts or on hosts on another cloud platform, as long as the hosts have access to
Google Cloud APIs with an appropriately configured service account.
### Remote collection from a central Compute Engine instance
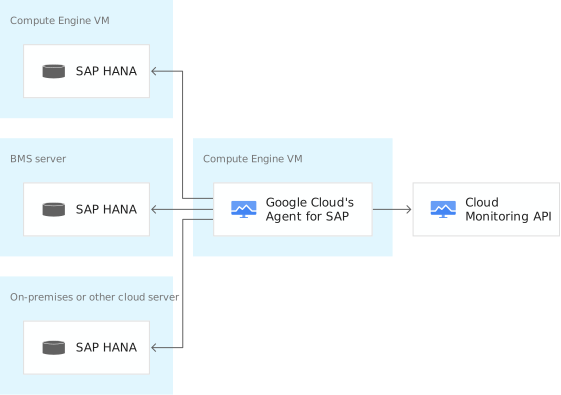
The following diagram shows the installation architecture, in which the agent is
installed on a different Compute Engine instance than the
Compute Engine instances running the SAP HANA instances.
### Local collection on Compute Engine instance
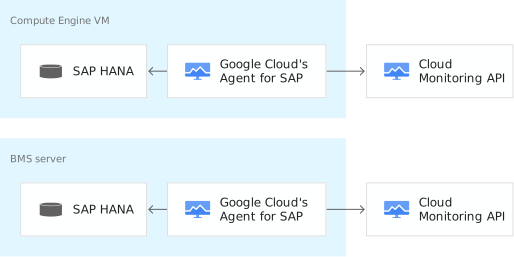
If firewall rules restrict access to your environment, then you can install the
agent with the SAP HANA instance on the same Compute Engine instance.
The following diagram shows the installation architecture, in which the agent
is installed individually on a Compute Engine instance.
### Hybrid collection architecture
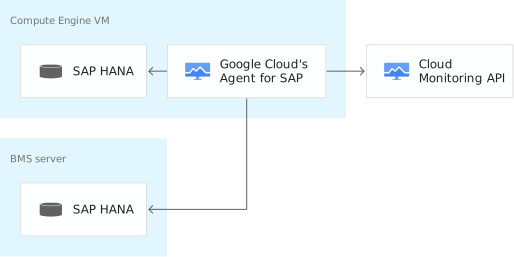
You can install the agent on the Compute Engine instance that hosts your
SAP HANA instance, and configure the agent to also monitor an SAP HANA instance
that runs on another compute instance.
If you are monitoring SAP HANA instances in multiple Google Cloud projects,
then you need to install at least one instance of Google Cloud's Agent for SAP
in each Google Cloud project that contains an SAP HANA instance that you are
monitoring.
### High-availability configuration for the agent
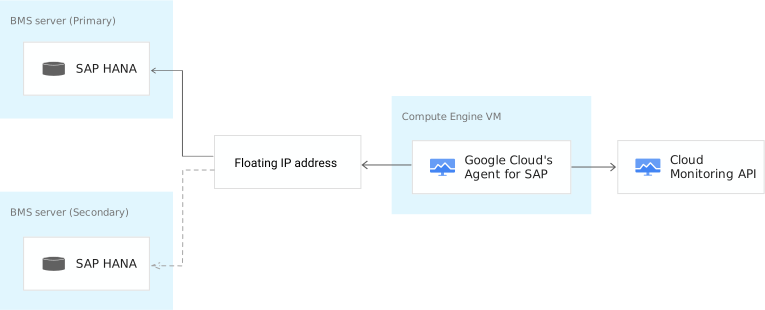
If you are monitoring SAP HANA instances in a high-availability cluster, then
you must install Google Cloud's Agent for SAP on a host that is not a node in that
cluster, so that the agent is not impacted by failover events.
In the agent's configuration file, we recommend that you configure the
monitoring against the floating IP address. With this configuration, the agent
collects metrics only from the currently-active node.
## SSL/TLS Support
If an SAP HANA instance uses the Transport Layer Secure (TLS) or Secure
Sockets Layer (SSL) protocol to secure communication between the SAP HANA
database and the clients that use the SAP HANA SQL interface, then you must
enable the TLS/SSL support in Google Cloud's Agent for SAP. To do so, you must
specify the following parameters for all such SAP HANA instances in
the configuration file of Google Cloud's Agent for SAP:
- Specify the parameter `enable_ssl` and set its value to `true`.
- Specify the parameter `host_name_in_certificate` and set the hostname, as specified in the TLS/SSL certificate, as its value.
- Specify the parameter `tls_root_ca_file` and set the path, where the TLS/SSL certificate is stored, as its value.
If SAP HANA is also configured to validate certificates, you can configure
the agent to support certificate validation and specify paths and passwords
for a keystore and trustore.
For a description of the agent configuration parameters related to SSL, see
[Configuration parameters](https://docs.cloud.google.com/sap/docs/agent-for-sap/latest/configure-sap-hana-monitoring.md.txt#configuration_parameters).
## Monitoring for multi-tenant and HA systems
From version 3.7, Google Cloud's Agent for SAP supports enhanced monitoring for
SAP HANA systems that have multiple tenant databases and SAP HANA systems that
are deployed in high-availability (HA) clusters.
- For multi-tenant SAP HANA systems, you can set up tenant-specific monitoring.
You do this by editing the agent's configuration file, and for each defined
SAP HANA instance, you specify the queries that you want to run on that
instance. By default, the agent runs all queries on all the SAP HANA instances
that you've defined in the agent's configuration file.
For information about how to set up tenant-specific monitoring for a
multi-tenant SAP HANA database, see
[Set up tenant-specific monitoring for a multi-tenant SAP HANA database](https://docs.cloud.google.com/sap/docs/agent-for-sap/latest/configure-sap-hana-monitoring.md.txt#set-up-tenant-specific-monitoring).
- For SAP HANA HA systems deployed with the
[Active/Active (Read Enabled)](https://help.sap.com/docs/SAP_HANA_PLATFORM/6b94445c94ae495c83a19646e7c3fd56/fe5fc53706a34048bf4a3a93a5d7c866.html)
configuration, you can specify if the queries defined in your agent's
configuration file are to be run on the primary node, the secondary node, or
both. This lets you balance the query load on your nodes. For example, you can
run some queries exclusively only on the secondary node and thereby not add to
the primary node's task load. The default behavior is that the agent runs the
queries on the primary node in your SAP HANA HA system.
For information about how to set up node-specific monitoring for an SAP HANA
HA system, see
[Set up node-specific monitoring for an SAP HANA HA system](https://docs.cloud.google.com/sap/docs/agent-for-sap/latest/configure-sap-hana-monitoring.md.txt#set-up-node-specific-monitoring).
## Defining custom queries
Google Cloud's Agent for SAP lets you define and run
[custom queries](https://docs.cloud.google.com/sap/docs/agent-for-sap/latest/monitoring-sap-hana.md.txt#custom_queries).
A custom query includes the following details:
- The parameters that describe the query, and the parameter values.
- A SQL statement to fetch data from your SAP HANA instances.
- One or more metrics that the SQL statement returns.
For information about query parameters, see
[Configuration parameters](https://docs.cloud.google.com/sap/docs/agent-for-sap/latest/configure-sap-hana-monitoring.md.txt#configuration_parameters).
For a full list of the system views that SAP HANA makes available for querying,
see the
[SAP HANA SQL and System Views Reference](https://help.sap.com/viewer/4fe29514fd584807ac9f2a04f6754767/2.0.02).
> [!NOTE]
> **Note:** A metric of type `METRIC_CUMULATIVE` is sent to Monitoring only from the second time that Google Cloud's Agent for SAP runs the corresponding query.
When you create a custom query, keep in mind that Monitoring
works best for summary or aggregate data and is not intended to store
high-cardinality data points. Use SQL aggregate functions such as
`SUM`, `AVG`, `COUNT`, `MIN`, or `MAX`, to limit the number of records returned.
Because Google Cloud's Agent for SAP treats the columns in a query as an ordered
list, you need to make sure to adhere to the following guidelines while defining
a custom query:
- The SQL statement must use all the columns that you've included in the query definition.
- The column order in the SQL statement must match the column order in the query definition.
- You've enabled the custom query by specifying `enabled: true` within a query block as mentioned in the [example custom query](https://docs.cloud.google.com/sap/docs/agent-for-sap/latest/monitoring-sap-hana.md.txt#example_custom_queries).
For example, you can see the query definition of the
[example custom query](https://docs.cloud.google.com/sap/docs/agent-for-sap/latest/monitoring-sap-hana.md.txt#example_custom_queries) named
`custom_memory_utilization`. Its query definition includes the columns
`mem_used` and `resident_mem_used`, in that order. This column order matches
the column order in the SQL statement specified for the parameter `sql`.
To view more examples of custom queries, see
[Example custom queries](https://docs.cloud.google.com/sap/docs/agent-for-sap/latest/monitoring-sap-hana.md.txt#example_custom_queries).
### Example custom queries
The following example shows two custom queries. The example queries
are intended for you to use as models to create your own custom queries.
```json
{
"name": "custom_memory_utilization",
"enabled": true,
"sql": "SELECT IFNULL(SUM(TOTAL_MEMORY_USED_SIZE), 0) AS mem_used, IFNULL(SUM(PHYSICAL_MEMORY_SIZE), 0) AS resident_mem_used FROM M_SERVICE_MEMORY;",
"columns": [
{
"name": "mem_used",
"metric_type": "METRIC_GAUGE",
"value_type": "VALUE_INT64"
},
{
"name": "resident_mem_used",
"metric_type": "METRIC_GAUGE",
"value_type": "VALUE_INT64"
}
]
}
{
"name": "custom_total_memory_usage",
"enabled": true,
"sql": "SELECT IFNULL(SUM(MEMORY_SIZE_IN_TOTAL), 0) AS table_mem_used FROM M_CS_TABLES;",
"columns": [
{
"name": "table_mem_used",
"metric_type": "METRIC_GAUGE",
"value_type": "VALUE_INT64"
}
]
}
```
### Error handling for custom queries
Google Cloud's Agent for SAP does not validate the SQL in your custom queries before
submitting the queries to your SAP HANA instances.
If a custom query fails with either a SQL exception or if the configured
columns in a query don't match the results that are returned by SAP HANA,
then the agent writes an error to the log. In both cases, the agent continues
to run the custom query and write error messages to the log until there are
two consecutive failures, after which the agent stops running that query. To
resume running of such a custom query, you need to
[restart the agent](https://docs.cloud.google.com/sap/docs/agent-for-sap/latest/operations.md.txt#agent4sap-restart).
For information about the required SQL syntax for custom queries,
see
[SAP HANA SQL and System Views Reference](https://help.sap.com/viewer/4fe29514fd584807ac9f2a04f6754767/2.0.02).
## SAP HANA monitoring metrics
The following table describes the built-in or default SAP HANA monitoring metrics that
Google Cloud's Agent for SAP can collect. The metric strings in this table
must be prefixed with `workload.googleapis.com/`. This prefix has been omitted
from the entries in the following table.
> [!NOTE]
> **Note:** A metric of type `METRIC_CUMULATIVE` is sent to Monitoring only from the second time that Google Cloud's Agent for SAP runs the corresponding query.
| **Metric** | **Metric type** | **Description** |
|---|---|---|
| `sap/hanamonitoring/column/memory/total_size` | `METRIC_GAUGE` | Specifies the sum of the `MEMORY_SIZE_IN_MAIN` and `MEMORY_SIZE_IN_DELTA` columns from SAP HANA. This metric is collected by the default query [`column_queries`](https://docs.cloud.google.com/sap/docs/agent-for-sap/latest/monitoring-sap-hana.md.txt#column_queries), which uses the SAP HANA system view `M_CS_ALL_COLUMNS`. |
| `sap/hanamonitoring/component/memory/total_used_size` | `METRIC_GAUGE` | Specifies service-specific memory usage by logical component from SAP HANA. This metric is collected by the default query [`component_queries`](https://docs.cloud.google.com/sap/docs/agent-for-sap/latest/monitoring-sap-hana.md.txt#component_queries), which uses the SAP HANA system view `M_SERVICE_COMPONENT_MEMORY`. |
| `sap/hanamonitoring/system/connection/total` | `METRIC_GAUGE` | Specifies the number of idle and running connections of the system. This metric is collected by the default query [`connection_query`](https://docs.cloud.google.com/sap/docs/agent-for-sap/latest/monitoring-sap-hana.md.txt#connection_query), which uses the SAP HANA system view `M_CONNECTIONS`. |
| `sap/hanamonitoring/host/cpu/usage_time` | `METRIC_CUMULATIVE` | Specifies the CPU time spent in milliseconds. This metric is collected by the default query [`cpu_queries`](https://docs.cloud.google.com/sap/docs/agent-for-sap/latest/monitoring-sap-hana.md.txt#cpu_queries), which uses the SAP HANA system view `M_HOST_RESOURCE_UTILIZATION`. |
| `sap/hanamonitoring/system/alert/total` | `METRIC_GAUGE` | Specifies the number of current alerts from the system statistics: "1", "2", "3", "4", or "5". This metric is collected by the default query [`alert_query`](https://docs.cloud.google.com/sap/docs/agent-for-sap/latest/monitoring-sap-hana.md.txt#alert_query), which uses the SAP HANA system view `STATISTICS_CURRENT_ALERTS` of the `_SYS_STATISTICS` schema. |
| `sap/hanamonitoring/host/memory/total_size` | `METRIC_GAUGE` | Specifies the physical memory on the host. This metric is collected by the default query [`host_queries`](https://docs.cloud.google.com/sap/docs/agent-for-sap/latest/monitoring-sap-hana.md.txt#host_queries), which uses the SAP HANA system view `M_HOST_RESOURCE_UTILIZATION`. |
| `sap/hanamonitoring/host/memory/total_used_size` | `METRIC_GAUGE` | Specifies the used physical memory on the host. This metric is collected by the default query [`host_queries`](https://docs.cloud.google.com/sap/docs/agent-for-sap/latest/monitoring-sap-hana.md.txt#host_queries), which uses the SAP HANA system view `M_HOST_RESOURCE_UTILIZATION`. |
| `sap/hanamonitoring/host/swap_space/total_size` | `METRIC_GAUGE` | Specifies the total swap memory on the host. This metric is collected by the default query [`host_queries`](https://docs.cloud.google.com/sap/docs/agent-for-sap/latest/monitoring-sap-hana.md.txt#host_queries), which uses the SAP HANA system view `M_HOST_RESOURCE_UTILIZATION`. |
| `sap/hanamonitoring/host/swap_space/total_used_size` | `METRIC_GAUGE` | Specifies the used swap memory on the host. This metric is collected by the default query [`host_queries`](https://docs.cloud.google.com/sap/docs/agent-for-sap/latest/monitoring-sap-hana.md.txt#host_queries), which uses the SAP HANA system view `M_HOST_RESOURCE_UTILIZATION`. |
| `sap/hanamonitoring/host/instance_memory/total_used_size` | `METRIC_GAUGE` | Specifies the amount of memory from the memory pool that is currently in actual use by SAP HANA processes. This metric is collected by the default query [`host_queries`](https://docs.cloud.google.com/sap/docs/agent-for-sap/latest/monitoring-sap-hana.md.txt#host_queries), which uses the SAP HANA system view `M_HOST_RESOURCE_UTILIZATION`. |
| `sap/hanamonitoring/host/instance_memory/total_peak_used_size` | `METRIC_GAUGE` | Specifies the peak memory from the memory pool that was in use by SAP HANA processes since start of the instance (sample based value). This metric is collected by the default query [`host_queries`](https://docs.cloud.google.com/sap/docs/agent-for-sap/latest/monitoring-sap-hana.md.txt#host_queries), which uses the SAP HANA system view `M_HOST_RESOURCE_UTILIZATION`. |
| `sap/hanamonitoring/host/instance_memory/total_allocated_size` | `METRIC_GAUGE` | Specifies the size of the memory pool for all SAP HANA processes. This metric is collected by the default query [`host_queries`](https://docs.cloud.google.com/sap/docs/agent-for-sap/latest/monitoring-sap-hana.md.txt#host_queries), which uses the SAP HANA system view `M_HOST_RESOURCE_UTILIZATION`. |
| `sap/hanamonitoring/host/instance_code/total_size` | `METRIC_GAUGE` | Specifies code size, including shared libraries of SAP HANA processes. This metric is collected by the default query [`host_queries`](https://docs.cloud.google.com/sap/docs/agent-for-sap/latest/monitoring-sap-hana.md.txt#host_queries), which uses the SAP HANA system view `M_HOST_RESOURCE_UTILIZATION`. |
| `sap/hanamonitoring/host/instance_shared_memory/total_allocated_size` | `METRIC_GAUGE` | Specifies the shared memory size of SAP HANA processes. This metric is collected by the default query [`host_queries`](https://docs.cloud.google.com/sap/docs/agent-for-sap/latest/monitoring-sap-hana.md.txt#host_queries), which uses the SAP HANA system view `M_HOST_RESOURCE_UTILIZATION`. |
| `sap/hanamonitoring/system/replication_data_latency/total_time` | `METRIC_GAUGE` | Specifies the data replication latency of the SAP HANA high-availability system. This metric is not fetched if your SAP HANA deployment runs only a single node. This metric is collected by the default query [`replication_query`](https://docs.cloud.google.com/sap/docs/agent-for-sap/latest/monitoring-sap-hana.md.txt#replication_query), which uses the SAP HANA system view `M_SERVICE_REPLICATION`. |
| `sap/hanamonitoring/rowstore/memory/total_size` | `METRIC_GAUGE` | Specifies the rowstore memory size, consisting of both the fixed and variable parts. This metric is collected by the default query [`rowstore_query`](https://docs.cloud.google.com/sap/docs/agent-for-sap/latest/monitoring-sap-hana.md.txt#rowstore_query), which uses the SAP HANA system view `M_RS_TABLES`. |
| `sap/hanamonitoring/schema/memory/total_size` | `METRIC_GAUGE` | Specifies the total memory size as the sum of memory size in the main, delta, and history parts. This metric is collected by the default query [`schema_type_queries`](https://docs.cloud.google.com/sap/docs/agent-for-sap/latest/monitoring-sap-hana.md.txt#schema_type_queries), which uses the SAP HANA system view `M_CS_TABLES`. |
| `sap/hanamonitoring/schema/record/total` | `METRIC_GAUGE` | Specifies the record count. This metric is collected by the default query [`schema_type_queries`](https://docs.cloud.google.com/sap/docs/agent-for-sap/latest/monitoring-sap-hana.md.txt#schema_type_queries), which uses the SAP HANA system view `M_CS_TABLES`. |
| `sap/hanamonitoring/schema/memory/estimated_max_total_size` | `METRIC_GAUGE` | Specifies the estimated maximum memory consumption, in total, for the fully loaded table. Data for open transactions is not included. This metric is collected by the default query [`schema_queries`](https://docs.cloud.google.com/sap/docs/agent-for-sap/latest/monitoring-sap-hana.md.txt#schema_queries), which uses the SAP HANA system view `M_CS_TABLES`. |
| `sap/hanamonitoring/schema/record/last_compressed_total` | `METRIC_GAUGE` | Specifies the number of entries in main during the last optimize compression run. This metric is collected by the default query [`schema_queries`](https://docs.cloud.google.com/sap/docs/agent-for-sap/latest/monitoring-sap-hana.md.txt#schema_queries), which uses the SAP HANA system view `M_CS_TABLES`. |
| `sap/hanamonitoring/schema/read/total_count` | `METRIC_CUMULATIVE` | Specifies the number of read accesses on the table or partition. This is not the number of `SELECT` statements against this table. A `SELECT` statement might involve several read accesses. This metric is collected by the default query [`schema_queries`](https://docs.cloud.google.com/sap/docs/agent-for-sap/latest/monitoring-sap-hana.md.txt#schema_queries), which uses the SAP HANA system view `M_CS_TABLES`. |
| `sap/hanamonitoring/schema/write/total_count` | `METRIC_CUMULATIVE` | Specifies the number of write accesses on the table or partition. This is not the number of DML and DDL statements against this table. A DML or DDL statement might involve several write accesses. This metric is collected by the default query [`schema_queries`](https://docs.cloud.google.com/sap/docs/agent-for-sap/latest/monitoring-sap-hana.md.txt#schema_queries), which uses the SAP HANA system view `M_CS_TABLES`. |
| `sap/hanamonitoring/schema/merge/total_count` | `METRIC_CUMULATIVE` | Specifies the number of delta merges done on the table or partition. This metric is collected by the default query [`schema_queries`](https://docs.cloud.google.com/sap/docs/agent-for-sap/latest/monitoring-sap-hana.md.txt#schema_queries), which uses the SAP HANA system view `M_CS_TABLES`. |
| `sap/hanamonitoring/service/memory/total_used_size` | `METRIC_GAUGE` | Specifies the amount of memory in use from the memory pool. This metric is collected by the default query [`service_queries`](https://docs.cloud.google.com/sap/docs/agent-for-sap/latest/monitoring-sap-hana.md.txt#service_queries), which uses the SAP HANA system view `M_SERVICE_MEMORY`. |
| `sap/hanamonitoring/service/logical_memory/total_size` | `METRIC_GAUGE` | Specifies the virtual memory size from the operating system perspective. This metric is collected by the default query [`service_queries`](https://docs.cloud.google.com/sap/docs/agent-for-sap/latest/monitoring-sap-hana.md.txt#service_queries), which uses the SAP HANA system view `M_SERVICE_MEMORY`. |
| `sap/hanamonitoring/service/physical_memory/total_size` | `METRIC_GAUGE` | Specifies the physical resident memory size from the operating system perspective. This metric is collected by the default query [`service_queries`](https://docs.cloud.google.com/sap/docs/agent-for-sap/latest/monitoring-sap-hana.md.txt#service_queries), which uses the SAP HANA system view `M_SERVICE_MEMORY`. |
| `sap/hanamonitoring/service/code/total_size` | `METRIC_GAUGE` | Specifies the code size, including shared libraries. This metric is collected by the default query [`service_queries`](https://docs.cloud.google.com/sap/docs/agent-for-sap/latest/monitoring-sap-hana.md.txt#service_queries), which uses the SAP HANA system view `M_SERVICE_MEMORY`. |
| `sap/hanamonitoring/service/stack/total_size` | `METRIC_GAUGE` | Specifies the stack size. This metric is collected by the default query [`service_queries`](https://docs.cloud.google.com/sap/docs/agent-for-sap/latest/monitoring-sap-hana.md.txt#service_queries), which uses the SAP HANA system view `M_SERVICE_MEMORY`. |
| `sap/hanamonitoring/service/heap_memory/total_allocated_size` | `METRIC_GAUGE` | Specifies the heap part of the memory pool. This metric is collected by the default query [`service_queries`](https://docs.cloud.google.com/sap/docs/agent-for-sap/latest/monitoring-sap-hana.md.txt#service_queries), which uses the SAP HANA system view `M_SERVICE_MEMORY`. |
| `sap/hanamonitoring/service/heap_memory/total_used_size` | `METRIC_GAUGE` | Specifies the amount of pool heap memory that is in use. This metric is collected by the default query [`service_queries`](https://docs.cloud.google.com/sap/docs/agent-for-sap/latest/monitoring-sap-hana.md.txt#service_queries), which uses the SAP HANA system view `M_SERVICE_MEMORY`. |
| `sap/hanamonitoring/service/shared_memory/total_allocated_size` | `METRIC_GAUGE` | Specifies the shared memory part of the memory pool. This metric is collected by the default query [`service_queries`](https://docs.cloud.google.com/sap/docs/agent-for-sap/latest/monitoring-sap-hana.md.txt#service_queries), which uses the SAP HANA system view `M_SERVICE_MEMORY`. |
| `sap/hanamonitoring/service/shared_memory/total_used_size` | `METRIC_GAUGE` | Specifies the amount of pool shared memory that is in use. This metric is collected by the default query [`service_queries`](https://docs.cloud.google.com/sap/docs/agent-for-sap/latest/monitoring-sap-hana.md.txt#service_queries), which uses the SAP HANA system view `M_SERVICE_MEMORY`. |
| `sap/hanamonitoring/service/compactor/total_allocated_size` | `METRIC_GAUGE` | Specifies the part of the memory pool that can potentially (if unpinned) be freed during a memory shortage. This metric is collected by the default query [`service_queries`](https://docs.cloud.google.com/sap/docs/agent-for-sap/latest/monitoring-sap-hana.md.txt#service_queries), which uses the SAP HANA system view `M_SERVICE_MEMORY`. |
| `sap/hanamonitoring/service/compactors/total_freeable_size` | `METRIC_GAUGE` | Specifies the memory that can be freed during a memory shortage. This metric is collected by the default query [`service_queries`](https://docs.cloud.google.com/sap/docs/agent-for-sap/latest/monitoring-sap-hana.md.txt#service_queries), which uses the SAP HANA system view `M_SERVICE_MEMORY`. |
| `sap/hanamonitoring/service/memory/allocation_limit` | `METRIC_GAUGE` | Specifies the maximum memory pool size (configurable value). This metric is collected by the default query [`service_queries`](https://docs.cloud.google.com/sap/docs/agent-for-sap/latest/monitoring-sap-hana.md.txt#service_queries), which uses the SAP HANA system view `M_SERVICE_MEMORY`. |
| `sap/hanamonitoring/service/memory/effective_allocation_limit` | `METRIC_GAUGE` | Specifies the effective maximum memory pool size, considering the pool sizes of other processes (computed value). This metric is collected by the default query [`service_queries`](https://docs.cloud.google.com/sap/docs/agent-for-sap/latest/monitoring-sap-hana.md.txt#service_queries), which uses the SAP HANA system view `M_SERVICE_MEMORY`. |
| `sap/hanamonitoring/system/transaction/total_count` | `METRIC_CUMULATIVE` | Specifies the number of update, commit, and rollback transactions. This metric is collected by the default query [`transaction_query`](https://docs.cloud.google.com/sap/docs/agent-for-sap/latest/monitoring-sap-hana.md.txt#transaction_query), which uses the SAP HANA system view `M_WORKLOAD`. |
| `sap/hanamonitoring/transactions/blocked` | `METRIC_GAUGE` | Specifies the number of blocked transactions in the database, grouped by database name, host, lock type, and service name. This metric is supported from version 3.5 of the agent. This metric is collected by the default query [`blocked_transaction_query`](https://docs.cloud.google.com/sap/docs/agent-for-sap/latest/monitoring-sap-hana.md.txt#blocked_transaction_query), which uses the SAP HANA system views `M_DATABASES`, `M_SERVICES`, and `M_BLOCKED_TRANSACTIONS`. |
| `sap/hanamonitoring/backups/data` | `METRIC_GAUGE` | Numeric response code that indicates the state of the last complete data backup. - `0`: Data backup executed unsuccessfully. - `1`: Data backup executed successfully. This metric includes the following labels: - `backup_id`, which specifies the ID of the last complete data backup. - `entry_type_name`, which specifies the type of last complete data backup. For example: `entry_type_name: complete data backup`. This metric is supported from version 3.5 of the agent. This metric is collected by the default query [`data_backup_state_query`](https://docs.cloud.google.com/sap/docs/agent-for-sap/latest/monitoring-sap-hana.md.txt#data_backup_state_query), which uses the SAP HANA system view `M_BACKUP_CATALOG`. |
| `sap/hanamonitoring/backups/snapshot` | `METRIC_GAUGE` | Numeric response code that indicates the state of the last complete disk snapshot based data backup. - `0`: Data backup executed unsuccessfully. - `1`: Data backup executed successfully. This metric is supported from version 3.6 of the agent. This metric includes the following labels: - `backup_id`, which specifies the ID of the last complete disk snapshot based data backup. - `entry_type_name`, which specifies the type of last complete disk snapshot based data backup. For example: `entry_type_name: complete data snapshot`. |
| `sap/hanamonitoring/backups/log` | `METRIC_GAUGE` | Specifies the state of the last 20 log backups. This metric is supported from version 3.5 of the agent. This metric is collected by the default query [`log_backup_state_query`](https://docs.cloud.google.com/sap/docs/agent-for-sap/latest/monitoring-sap-hana.md.txt#log_backup_state_query), which uses the SAP HANA system view `M_BACKUP_CATALOG`. |
| `sap/hanamonitoring/memory/unloads` | `METRIC_GAUGE` | Specifies the total number of table unloads that occurred due to low memory. This metric is supported from version 3.5 of the agent. This metric is collected by the default query [`memory_unloads_query`](https://docs.cloud.google.com/sap/docs/agent-for-sap/latest/monitoring-sap-hana.md.txt#memory_unloads_query), which uses the SAP HANA system view `M_CS_UNLOADS`. |
| `sap/hanamonitoring/disk/writetime` | `METRIC_GAUGE` | Specifies the average write time for SAP HANA data and log volumes. This metric is supported from version 3.5 of the agent. This metric is collected by the default query [`avg_write_time_queries`](https://docs.cloud.google.com/sap/docs/agent-for-sap/latest/monitoring-sap-hana.md.txt#avg_write_time_queries), which uses the SAP HANA system views `M_VOLUMES` and `M_VOLUME_IO_DETAILED_STATISTICS`. |
| `sap/hanamonitoring/disk/readtime` | `METRIC_GAUGE` | Specifies the average read time for SAP HANA data volumes. This metric is supported from version 3.5 of the agent. This metric is collected by the default query [`avg_read_time_queries`](https://docs.cloud.google.com/sap/docs/agent-for-sap/latest/monitoring-sap-hana.md.txt#avg_read_time_queries), which uses the SAP HANA system views `M_VOLUMES` and `M_VOLUME_IO_DETAILED_STATISTICS`. |
| `sap/hanamonitoring/backups/data/catalog` | `METRIC_GAUGE` | Specifies the creation duration (seconds), size (MB), throughput (MBps), backup state, backup comment (a column in SAP HANA), and backup path for the 10 most recent SAP HANA data backups. This metric is supported from version 3.7 of the agent. This metric is collected by the default query [`data_backup_catalog_queries`](https://docs.cloud.google.com/sap/docs/agent-for-sap/latest/monitoring-sap-hana.md.txt#data_backup_catalog_queries), which uses the SAP HANA system views `M_BACKUP_CATALOG` and `M_BACKUP_CATALOG_FILES`. |
| `sap/hanamonitoring/backups/log/catalog` | `METRIC_GAUGE` | Specifies the creation duration (seconds), size (MB), throughput (MBps), backup state, backup comment (a column in SAP HANA), and backup path for the 20 most recent SAP HANA log backups. This metric is supported from version 3.7 of the agent. This metric is collected by the default query [`log_backup_catalog_queries`](https://docs.cloud.google.com/sap/docs/agent-for-sap/latest/monitoring-sap-hana.md.txt#log_backup_catalog_queries), which uses the SAP HANA system views `M_BACKUP_CATALOG` and `M_BACKUP_CATALOG_FILES`. |
| `sap/hanamonitoring/backups/data/duration_s` | `METRIC_LABEL` | Specifies the creation duration (seconds) for the latest SAP HANA data backup. This metric is supported from version 3.7 of the agent. This metric is collected by the default query [`latest_data_backup_queries`](https://docs.cloud.google.com/sap/docs/agent-for-sap/latest/monitoring-sap-hana.md.txt#latest_data_backup_queries), which uses the SAP HANA system views `M_BACKUP_CATALOG` and `M_BACKUP_CATALOG_FILES`. |
| `sap/hanamonitoring/backups/data/size_mb` | `METRIC_LABEL` | Specifies the size (MB) of the latest SAP HANA data backup. This metric is supported from version 3.7 of the agent. This metric is collected by the default query [`latest_data_backup_queries`](https://docs.cloud.google.com/sap/docs/agent-for-sap/latest/monitoring-sap-hana.md.txt#latest_data_backup_queries), which uses the SAP HANA system views `M_BACKUP_CATALOG` and `M_BACKUP_CATALOG_FILES`. |
| `sap/hanamonitoring/backups/data/throughput_mb_s` | `METRIC_LABEL` | Specifies the throughput (MBps) that was experienced while creating the latest SAP HANA data backup. This metric is supported from version 3.7 of the agent. This metric is collected by the default query [`latest_data_backup_queries`](https://docs.cloud.google.com/sap/docs/agent-for-sap/latest/monitoring-sap-hana.md.txt#latest_data_backup_queries), which uses the SAP HANA system views `M_BACKUP_CATALOG` and `M_BACKUP_CATALOG_FILES`. |
| `sap/hanamonitoring/backups/log/duration_s` | `METRIC_LABEL` | Specifies the creation duration (seconds) for the latest SAP HANA log backup. This metric is supported from version 3.7 of the agent. This metric is collected by the default query [`latest_log_backup_queries`](https://docs.cloud.google.com/sap/docs/agent-for-sap/latest/monitoring-sap-hana.md.txt#latest_log_backup_queries), which uses the SAP HANA system views `M_BACKUP_CATALOG` and `M_BACKUP_CATALOG_FILES`. |
| `sap/hanamonitoring/backups/log/size_mb` | `METRIC_LABEL` | Specifies the size (MB) of the latest SAP HANA log backup. This metric is supported from version 3.7 of the agent. This metric is collected by the default query [`latest_log_backup_queries`](https://docs.cloud.google.com/sap/docs/agent-for-sap/latest/monitoring-sap-hana.md.txt#latest_log_backup_queries), which uses the SAP HANA system views `M_BACKUP_CATALOG` and `M_BACKUP_CATALOG_FILES`. |
| `sap/hanamonitoring/backups/log/throughput_mb_s` | `METRIC_LABEL` | Specifies the throughput (MBps) that was experienced while creating the latest SAP HANA log backup. This metric is supported from version 3.7 of the agent. This metric is collected by the default query [`latest_log_backup_queries`](https://docs.cloud.google.com/sap/docs/agent-for-sap/latest/monitoring-sap-hana.md.txt#latest_log_backup_queries), which uses the SAP HANA system views `M_BACKUP_CATALOG` and `M_BACKUP_CATALOG_FILES`. |
| `sap/hanamonitoring/backups/catalog/size_mb` | `METRIC_LABEL` | Specifies the size (MB) of the SAP HANA backup catalog. This metric is supported from version 3.7 of the agent. This metric is collected by the default query [`backup_catalog_size_queries`](https://docs.cloud.google.com/sap/docs/agent-for-sap/latest/monitoring-sap-hana.md.txt#backup_catalog_size_queries), which uses the SAP HANA system views `M_BACKUP_CATALOG` and `M_BACKUP_CATALOG_FILES`. |
| `sap/hanamonitoring/backups/catalog/retention_days` | `METRIC_GAUGE` | Specifies the number of days since the oldest entry was created in the SAP HANA backup catalog. This metric is supported from version 3.7 of the agent. This metric is collected by the default query [`oldest_backup_catalog_date_queries`](https://docs.cloud.google.com/sap/docs/agent-for-sap/latest/monitoring-sap-hana.md.txt#oldest_backup_catalog_date_queries), which uses the SAP HANA system view `M_BACKUP_CATALOG`. |
| `sap/hanamonitoring/QUERY_NAME/time_taken_ms` | `METRIC_GAUGE` | Specifies the query response time in milliseconds. When you enable the configuration property `hana_monitoring_configuration.send_query_response_time`, then this metric is emitted for all SAP HANA monitoring metrics that the agent is configured to collect. This metric includes the following labels: - `sid`: the SAP system identifier (SID) of your SAP HANA system. - `instance_name`: the name of your SAP HANA instance, which you specify in the agent's configuration file for `hana_monitoring_configuration.hana_instances.name`. This metric is supported from version 3.7 of the agent. |
| `sap/hanamonitoring/fast_restart_enabled` | `METRIC_GAUGE` | Specifies whether or not the [SAP HANA Fast Restart Option](https://help.sap.com/docs/SAP_HANA_PLATFORM/%206b94445c94ae495c83a19646e7c3fd56/ce158d28135147f099b761f8b1ee43fc.html) is enabled. Supported values are `TRUE` and `FALSE`. This metric is collected by the default query [`fast_restart_enabled_queries`](https://docs.cloud.google.com/sap/docs/agent-for-sap/latest/monitoring-sap-hana.md.txt#fast_restart_enabled_queries), which uses the SAP HANA system view `M_PERSISTENT_MEMORY_VOLUMES`. This metric is supported from version 3.8 of the agent. |
| `sap/hanamonitoring/logshipping_max_retention_size` | `METRIC_GAUGE` | Specifies the value assigned to the `logshipping_max_retention_size` parameter in your SAP HANA replication configuration. This metric includes a label named `logshipping_max_retention_size_source`, which identifies the file from which this parameter's value is sourced. The label value is either `global.ini` or `indexserver.ini`. This metric is collected from the primary SAP HANA instance by the default query [`logshipping_max_retention_size_queries`](https://docs.cloud.google.com/sap/docs/agent-for-sap/latest/monitoring-sap-hana.md.txt#logshipping_max_retention_size_queries), which uses the SAP HANA system view `M_INIFILE_CONTENTS`. This metric is supported from version 3.8 of the agent. |
## Viewing metrics in Monitoring
Google Cloud provides custom dashboards that help you visualize the
SAP HANA monitoring metrics collected by Google Cloud's Agent for SAP. See the
`dashboards/google-cloud-agent-for-sap` directory in the
[GoogleCloudPlatform/monitoring-dashboard-samples](https://github.com/GoogleCloudPlatform/monitoring-dashboard-samples/tree/master/dashboards/google-cloud-agent-for-sap)
repository on GitHub.
For information about these dashboards, including installation instructions, see
[View the collected metrics](https://docs.cloud.google.com/sap/docs/agent-for-sap/latest/configure-sap-hana-monitoring.md.txt#agent4sap_metrics_dashboards).
For information about finding metrics data in Monitoring and
configuring alert notifications, see
[Metrics in Monitoring](https://docs.cloud.google.com/sap/docs/agent-for-sap/latest/planning.md.txt#metrics_monitoring).
## Default query reference
The built-in default queries of the Google Cloud's Agent for SAP return
the following information from SAP HANA.
If you don't need the metrics provided by a particular built-in or default
query, then you can disable it. For information about how to disable a query,
see
[Disable a SQL query](https://docs.cloud.google.com/sap/docs/agent-for-sap/latest/configure-sap-hana-monitoring.md.txt#disable_a_sql_query).
#### `column_queries`
The built-in query `column_queries` returns information about the
usage of memory by columns from SAP HANA `M_CS_ALL_COLUMNS` system view.
The query sends the following metrics to Monitoring:
| Metric name | Metric | Description |
|---|---|---|
| Column memory size | `column/memory/total_size` | Specifies the sum of the `MEMORY_SIZE_IN_MAIN` and `MEMORY_SIZE_IN_DELTA` columns. |
#### `component_queries`
The built-in query `component_queries` returns service-specific memory
usage by logical component from SAP HANA. The query uses the SAP HANA
`M_SERVICE_COMPONENT_MEMORY` system view.
The query sends the following metrics to Monitoring:
| Metric name | Metric | Description |
|---|---|---|
| Component memory used | `component/memory/total_used_size` | Specifies the amount of memory that is currently used for the logical component. |
#### `connection_query`
The built-in query `connection_query` returns the number of running
and idle connections from SAP HANA by using the SAP HANA `M_CONNECTIONS`
system view.
The query sends the following metrics to Monitoring:
| Metric name | Metric | Description |
|---|---|---|
| System connections | `system/connection/total` | Specifies the number of idle and running connections of the system. |
#### `cpu_queries`
The built-in query `cpu_queries` returns cpu usage information from
SAP HANA by using the SAP HANA `M_HOST_RESOURCE_UTILIZATION` system view.
The query sends the following metrics to Monitoring:
| Metric name | Metric | Description |
|---|---|---|
| CPU usage time | `host/cpu/usage_time` | Specifies the CPU time spent. |
#### `alert_query`
The built-in query `alert_query` returns the number and rating of
current alerts from the SAP HANA Statistics Server by using the
SAP HANA `STATISTICS_CURRENT_ALERTS` view of the `_SYS_STATISTICS` schema.
The query sends the following metrics to Monitoring:
| Metric name | Metric | Description |
|---|---|---|
| Alerts count | `system/alert/total` | Specifies the number of current alerts from the system statistics: "1", "2", "3", "4", or "5". |
#### `host_queries`
The built-in query `host_queries` returns memory usage by the host
from SAP HANA. The query uses the SAP HANA `M_HOST_RESOURCE_UTILIZATION`
system view.
The query sends the following metrics to Monitoring:
| Metric name | Metric | Description |
|---|---|---|
| Host memory size | `host/memory/total_size` | Specifies the total physical memory on the host. |
| Host memory used | `host/memory/total_used_size` | Specifies the used physical memory on the host. |
| Swap space size | `host/swap_space/total_size` | Specifies the total swap memory on the host. |
| Swap space used | `host/swap_space/total_used_size` | Specifies the used swap memory on the host. |
| Instance memory used | `host/instance_memory/total_used_size` | Specifies the amount of memory from the memory pool that is currently in actual use by SAP HANA processes. |
| Peak instance memory used | `host/instance_memory/total_peak_used_size` | Specifies the peak memory from the memory pool that was in use by SAP HANA processes since start of the instance (sample based value). |
| Instance memory allocated | `host/instance_memory/total_allocated_size` | Specifies the size of the memory pool for all SAP HANA processes. |
| Instance code size | `host/instance_code/total_size` | Specifies the code size, including shared libraries of SAP HANA processes. |
| Instance shared memory allocated | `host/instance_shared_memory/total_allocated_size` | Specifies the shared memory size of SAP HANA processes. |
#### `replication_query`
The built-in query `replication_query` returns replication latency
information from SAP HANA running a high-availability cluster. This query uses
the SAP HANA system view `M_SERVICE_REPLICATION`. If your SAP HANA deployment
runs only a single node, then this query does not return any metric.
The query sends the following metrics to Monitoring:
| Metric name | Metric | Description |
|---|---|---|
| Replication data latency | `system/replication_data_latency/total_time` | Specifies the data replication latency of the system. |
#### `rowstore_query`
The built-in query `rowstore_query` returns the size of the rowstore
from SAP HANA by using the SAP HANA `M_RS_TABLES` system view.
The query sends the following metrics to Monitoring:
| Metric name | Metric | Description |
|---|---|---|
| Rowstore memory size | `rowstore/memory/total_size` | Specifies the rowstore memory size consisting of both the fixed and variable parts. |
#### `schema_type_queries`
The built-in query `schema_type_queries` returns memory usage and
record count information from SAP HANA by using the SAP HANA
`M_CS_TABLES` system view.
The query sends the following metrics to Monitoring:
| Metric name | Metric | Description |
|---|---|---|
| Schema memory size | `schema/memory/total_size` | Specifies the total memory size as the sum of memory size in the main, delta, and history parts. |
| Schema record count | `schema/record/total` | Specifies the record count. |
#### `schema_queries`
The built-in query `schema_queries` returns schema usage information
from SAP HANA by using the SAP HANA `M_CS_TABLES` system view.
The query sends the following metrics to Monitoring:
| Metric name | Metric | Description |
|---|---|---|
| Schema estimated max memory size | `schema/memory/estimated_max_total_size` | Specifies the estimated maximum memory consumption, in total, for the fully loaded table (data for open transactions is not included). |
| Schema last compressed records count | `schema/record/last_compressed_total` | Specifies the number of entries in main during the last optimize compression run. |
| Schema read count | `schema/read/total_count` | Specifies the number of read accesses on the table or partition. This is not the number of SELECT statements against this table. A SELECT statement may involve several read accesses. |
| Schema write count | `schema/write/total_count` | Specifies the number of write accesses on the table or partition. This is not the number of DML and DDL statements against this table. A DML or DDL statement may involve several write accesses. |
| Schema merge count | `schema/merge/total_count` | Specifies the number of delta merges done on the table or partition. |
#### `service_queries`
The built-in query `service_queries` returns information from SAP HANA
about the memory used by services. The query uses the SAP HANA
`M_SERVICE_MEMORY` system view.
The query sends the following metrics to Monitoring:
| Metric name | Metric | Description |
|---|---|---|
| Service memory used | `service/memory/total_used_size` | Specifies the amount of memory in use from the memory pool. |
| Service logical memory size | `service/logical_memory/total_size` | Specifies the virtual memory size from the operating system perspective. |
| Service physical memory size | `service/physical_memory/total_size` | Specifies the physical resident memory size from the operating system perspective. |
| Service code size | `service/code/total_size` | Specifies the code size, including shared libraries. |
| Service stack size | `service/stack/total_size` | Specifies the stack size. |
| Service heap memory allocated | `service/heap_memory/total_allocated_size` | Specifies the heap part of the memory pool. |
| Service heap memory used | `service/heap_memory/total_used_size` | Specifies the amount of pool heap memory that is in use. |
| Service shared memory allocated | `service/shared_memory/total_allocated_size` | Specifies the shared memory part of the memory pool. |
| Service shared memory used | `service/shared_memory/total_used_size` | Specifies the amount of pool shared memory that is in use. |
| Service compactors allocated size | `service/compactor/total_allocated_size` | Specifies the part of the memory pool that can potentially (if unpinned) be freed during a memory shortage. |
| Service compactors freeable size | `service/compactors/total_freeable_size` | Specifies the memory that can be freed during a memory shortage. |
| Service memory allocation limit | `service/memory/allocation_limit` | Specifies the maximum memory pool size (configurable value). |
| Service memory effective allocation limit | `service/memory/effective_allocation_limit` | Specifies the effective maximum memory pool size, considering the pool sizes of other processes (computed value). |
#### `transaction_query`
The built-in query `transaction_query` returns the total number of
transactions (update, commit, and rollback) from SAP HANA by using the
SAP HANA `M_WORKLOAD` system view.
The query sends the following metrics to Monitoring:
| Metric name | Metric | Description |
|---|---|---|
| System transactions | `system/transaction/total_count` | Specifies the number of update, commit, and rollback transactions. |
#### `blocked_transaction_query`
The built-in query `blocked_transaction_query` returns the total number of
blocked transactions from SAP HANA by using the SAP HANA
`M_DATABASES`, `M_SERVICES`, and `M_BLOCKED_TRANSACTIONS` system views.
This query is supported from version 3.5 of the agent.
The query sends the following metrics to Monitoring:
| Metric name | Metric | Description |
|---|---|---|
| Blocked transactions | `transactions/blocked` | Specifies the number of blocked transactions. |
#### `data_backup_state_query`
The built-in query `data_backup_state_query` returns the recent state of
the last complete data backup from SAP HANA by using the
SAP HANA `M_BACKUP_CATALOG` system view.
This query is supported from version 3.5 of the agent.
The query sends the following metrics to Monitoring:
| Metric name | Metric | Description |
|---|---|---|
| Data Backup State | `backups/data` | Specifies the recent state of the last complete data backup. |
#### `log_backup_state_query`
The built-in query `log_backup_state_query` returns the total number of
blocked transactions from SAP HANA by using the
SAP HANA `M_BACKUP_CATALOG` system view.
This query is supported from version 3.5 of the agent.
The query sends the following metrics to Monitoring:
| Metric name | Metric | Description |
|---|---|---|
| Log Backup State | `backups/log` | Specifies the state of the last 20 log backups. |
#### `data_backup_catalog_queries`
The built-in query `data_backup_catalog_queries` returns information about the
10 most recent SAP HANA data backups by using the SAP HANA `M_BACKUP_CATALOG`
and `M_BACKUP_CATALOG_FILES` system views.
This query is supported from version 3.7 of the agent.
The query sends the following metrics to Monitoring:
| Metric name | Metric | Description |
|---|---|---|
| Data Backup Catalog | `backups/data/catalog` | Specifies the creation duration (seconds), size (MB), throughput (MBps), backup state, backup comment (a column in SAP HANA), and backup path for the 10 most recent SAP HANA data backups. |
#### `log_backup_catalog_queries`
The built-in query `log_backup_catalog_queries` returns information about the 10
most recent SAP HANA log backups by using the SAP HANA `M_BACKUP_CATALOG` and
`M_BACKUP_CATALOG_FILES` system views.
This query is supported from version 3.7 of the agent.
The query sends the following metrics to Monitoring:
| Metric name | Metric | Description |
|---|---|---|
| Log Backup Catalog | `backups/log/catalog` | Specifies the creation duration (seconds), size (MB), throughput (MBps), backup state, backup comment (a column in SAP HANA), and backup path for the 10 most recent SAP HANA log backups. |
#### `latest_data_backup_queries`
The built-in query `latest_data_backup_queries` returns information about the
latest data backup from SAP HANA by using the SAP HANA `M_BACKUP_CATALOG` and
`M_BACKUP_CATALOG_FILES` system views.
This query is supported from version 3.7 of the agent.
The query sends the following metrics to Monitoring:
| Metric name | Metric | Description |
|---|---|---|
| Latest Data Backup Duration | `backups/data/duration_s` | Specifies the creation duration (seconds) for the latest SAP HANA data backup. |
| Latest Data Backup Size | `backups/data/size_mb` | Specifies the size (MB) of the latest SAP HANA data backup. |
| Latest Data Backup Throughput | `backups/data/throughput_mb_s` | Specifies the throughput (MBps) that was experienced while creating the latest SAP HANA data backup. |
#### `latest_log_backup_queries`
The built-in query `latest_log_backup_queries` returns information about the
latest log backup from SAP HANA by using the SAP HANA `M_BACKUP_CATALOG` and
`M_BACKUP_CATALOG_FILES` system views.
This query is supported from version 3.7 of the agent.
The query sends the following metrics to Monitoring:
| Metric name | Metric | Description |
|---|---|---|
| Latest Log Backup Duration | `backups/log/duration_s` | Specifies the creation duration (seconds) for the latest SAP HANA log backup. |
| Latest Log Backup Size | `backups/log/size_mb` | Specifies the size (MB) of the latest SAP HANA log backup. |
| Latest Log Backup Throughput | `backups/log/throughput_mb_s` | Specifies the throughput (MBps) that was experienced while creating the latest SAP HANA log backup. |
#### `backup_catalog_size_queries`
The built-in query `backup_catalog_size_queries` returns the size of the SAP
HANA backup catalog by using the SAP HANA `M_BACKUP_CATALOG` and
`M_BACKUP_CATALOG_FILES` system views.
This query is supported from version 3.7 of the agent.
The query sends the following metrics to Monitoring:
| Metric name | Metric | Description |
|---|---|---|
| Backup Catalog Size | `backups/catalog/size_mb` | Specifies the size (MB) of the SAP HANA backup catalog. |
#### `oldest_backup_catalog_date_queries`
The built-in query `oldest_backup_catalog_date_queries` returns the number of
days since the oldest entry in the SAP HANA backup catalog. It uses the SAP HANA
`M_BACKUP_CATALOG` system view.
This query is supported from version 3.7 of the agent.
The query sends the following metrics to Monitoring:
| Metric name | Metric | Description |
|---|---|---|
| Oldest Backup Catalog Entry Date | `backups/catalog/retention_days` | Specifies the number of days since the oldest entry was created in the SAP HANA backup catalog. |
#### `memory_unloads_query`
The built-in query `memory_unloads_query` returns the total number of
table unloads that occur in SAP HANA due to low memory. It uses the
SAP HANA `M_CS_UNLOADS` system view.
This query is supported from version 3.5 of the agent.
The query sends the following metrics to Monitoring:
| Metric name | Metric | Description |
|---|---|---|
| Memory Unloads | `memory/unloads` | Specifies the total number of table unloads that occur due to low memory. |
#### `avg_write_time_queries`
The built-in query `avg_write_time_queries` returns the average write time
for data and log volumes from SAP HANA by using the
SAP HANA `M_VOLUMES` and `M_VOLUME_IO_DETAILED_STATISTICS` system views.
This query is supported from version 3.5 of the agent.
The query sends the following metrics to Monitoring:
| Metric name | Metric | Description |
|---|---|---|
| Average Write Time | `disk/writetime` | Specifies the average write time for data and log volumes. |
#### `avg_read_time_queries`
The built-in query `avg_read_time_queries` returns the average read time
for data volumes from SAP HANA by using the SAP HANA
`M_VOLUMES` and `M_VOLUME_IO_DETAILED_STATISTICS` system views.
This query is supported from version 3.5 of the agent.
The query sends the following metrics to Monitoring:
| Metric name | Metric | Description |
|---|---|---|
| Average Read Time | `disk/readtime` | Specifies the average read time for data volumes. |
#### `data_snapshot_state_queries`
The built-in query `data_snapshot_state_queries` returns the state of
the last complete disk snapshot based data backup from SAP HANA by using the
SAP HANA `M_BACKUP_CATALOG` system view.
This query is supported from version 3.6 of the agent.
This query sends the following metrics to Monitoring:
| Metric name | Metric | Description |
|---|---|---|
| Data Snapshot Backup State | `backups/snapshot` | Specifies the state of the last complete disk snapshot based data backup. |
### `fast_restart_enabled_queries`
The built-in query `fast_restart_enabled_queries` returns whether or not the
[SAP HANA Fast Restart Option](https://help.sap.com/docs/SAP_HANA_PLATFORM/%206b94445c94ae495c83a19646e7c3fd56/ce158d28135147f099b761f8b1ee43fc.html)
is enabled, by using the SAP HANA `M_PERSISTENT_MEMORY_VOLUMES` system view.
This query is supported from version 3.8 of the agent.
This query sends the following metrics to Monitoring:
| Metric name | Metric | Description |
|---|---|---|
| Fast Restart Enabled | `fast_restart_enabled` | Specifies whether or not the SAP HANA Fast Restart option is enabled. Supported values are `TRUE` and `FALSE`. |
### `logshipping_max_retention_size_queries`
The built-in query `logshipping_max_retention_size_queries` returns information
about the value assigned to the `logshipping_max_retention_size`
parameter in your SAP HANA replication configuration. This query uses the SAP
HANA `M_INIFILE_CONTENTS` system view.
This query is supported from version 3.8 of the agent.
This query sends the following metrics to Monitoring:
| Metric name | Metric | Description |
|---|---|---|
| Log Shipping Max Retention Size | `logshipping_max_retention_size` | Specifies the value assigned to the `logshipping_max_retention_size` parameter in your SAP HANA replication configuration. This metric includes a label named `logshipping_max_retention_size_source`, which identifies the file from which this parameter's value is sourced. The label value is either `global.ini` or `indexserver.ini`. |