# Collect Apache web server metrics with the Ops Agent
Learn how to collect and monitor metrics from an Apache web server installed
on a Compute Engine virtual machine (VM) instance by using the Ops Agent:
1. Create a Compute Engine VM instance and install the [Ops Agent](https://docs.cloud.google.com/logging/docs/agent/ops-agent).
2. Install an Apache web server.
3. Configure the Ops Agent for the Apache web server.
4. Generate traffic to the Apache web server.
5. View metrics on the predefined Apache dashboard.
6. Create an alerting policy.
7. Test the alerting policy.
8. Clean up.
*** ** * ** ***
To follow step-by-step guidance for this task directly in the
Google Cloud console, click **Guide me**:
[Guide me](https://console.cloud.google.com/welcome?walkthrough_id=monitoring--monitoring_quickstart_compute)
*** ** * ** ***
## Before you begin
1. Security constraints defined by your organization might prevent you from completing the
following steps. For troubleshooting information, see
[Develop applications in a constrained Google Cloud environment](https://docs.cloud.google.com/resource-manager/docs/organization-policy/develop-apps-constrained-environment).
### Required roles
To get the permissions that
you need to create a Compute Engine instance, install Apache, and to view metric data,
ask your administrator to grant you the
following IAM roles on your project:
- [Compute Instance Admin (v1)](https://docs.cloud.google.com/iam/docs/roles-permissions/compute#compute.instanceAdmin.v1) (`roles/compute.instanceAdmin.v1`)
- [Monitoring Editor](https://docs.cloud.google.com/iam/docs/roles-permissions/monitoring#monitoring.editor) (`roles/monitoring.editor`)
- [OSPolicyAssignment Admin](https://docs.cloud.google.com/iam/docs/roles-permissions/osconfig#osconfig.osPolicyAssignmentAdmin) (`roles/osconfig.osPolicyAssignmentAdmin`)
- [Service Account User](https://docs.cloud.google.com/iam/docs/roles-permissions/iam#iam.serviceAccountUser) (`roles/iam.serviceAccountUser`)
- [Service Usage Admin](https://docs.cloud.google.com/iam/docs/roles-permissions/serviceusage#serviceusage.serviceUsageAdmin) (`roles/serviceusage.serviceUsageAdmin`)
For more information about granting roles, see [Manage access to projects, folders, and organizations](https://docs.cloud.google.com/iam/docs/granting-changing-revoking-access).
You might also be able to get
the required permissions through [custom
roles](https://docs.cloud.google.com/iam/docs/creating-custom-roles) or other [predefined
roles](https://docs.cloud.google.com/iam/docs/roles-overview#predefined).
## Create a VM instance
1. In the Google Cloud console, go to the **VM instances** page:
[Go to **VM instances**](https://console.cloud.google.com/compute/instances)
If you use the search bar to find this page, then select the result whose subheading is
**Compute Engine**.
2. Create a VM by clicking **Create instance**. Configure your instance by using the options in the navigation menu.
3. In the **Machine configuration** option, do the following:
1. In the **Name** field, enter a descriptive name.
2. In the **Machine type** preset drop-down, select **Shared-core \> e2-small**.
4. Verify that the **OS and storage** option displays **Debian GNU/Linux** . If not, click the **OS and storage** option and click **Change** . In the **Boot disk** dialog, set **Version** to **Debian GNU/Linux**.
5. In the **Networking** option, for **Firewall** , select both **Allow HTTP traffic** and **Allow HTTPS traffic**.
6. Verify that the **Observability** option displays **Install Ops Agent** . If not, click the **Observability** option and select **Install Ops Agent for Monitoring and
Logging**.
7. Click **Create**.
## Install an Apache web server
To install an Apache web server on your Compute Engine VM instance, do
the following:
1. On the **VM instances** page, locate your new VM,
go to the **Connect** column,
and then click **SSH**.
Having trouble connecting? Refer to
[Troubleshooting SSH](https://cloud.google.com/compute/docs/troubleshooting/troubleshooting-ssh).
2. To update the package lists, copy the following command to your clipboard,
paste the command into the SSH terminal, and then press enter:
sudo apt-get update
3. After you see the message "Reading package lists... Done", in the
SSH terminal, run the following command to install an Apache2 web server:
sudo apt-get install apache2 php7.0
When asked to continue the installation, enter `Y`. If the
install command fails, then use `sudo apt-get install apache2 php`.
4. When your command prompt returns, go to the **VM instances** page and copy
the VM's external IP address into the following URL:
http://EXTERNAL_IP
5. To connect to your Apache web server, open a new browser tab, and then
enter the URL from the previous step.
When the web server is successfully installed, the browser tab displays the
Apache2 Debian default page.

## Collect Apache web server logs and metrics
In these steps, you configure the [Ops Agent](https://docs.cloud.google.com/logging/docs/agent/ops-agent) to collect logs and metrics from your Apache web server:
1. Go to the SSH terminal for your VM instance. If you don't have a terminal open,
then do the following:
1. In the Google Cloud console, go to the **VM instances** page:
[Go to **VM instances**](https://console.cloud.google.com/compute/instances)
If you use the search bar to find this page, then select the result whose subheading is
**Compute Engine**.
2. Locate your new VM and then click **SSH** .
2. Copy the following command, then paste it into the terminal for your instance, and then
press enter:
# Configures Ops Agent to collect telemetry from the app. You must restart the agent for the configuration to take effect.
set -e
# Check if the file exists
if [ ! -f /etc/google-cloud-ops-agent/config.yaml ]; then
# Create the file if it doesn't exist.
sudo mkdir -p /etc/google-cloud-ops-agent
sudo touch /etc/google-cloud-ops-agent/config.yaml
fi
# Create a back up of the existing file so existing configurations are not lost.
sudo cp /etc/google-cloud-ops-agent/config.yaml /etc/google-cloud-ops-agent/config.yaml.bak
# Configure the Ops Agent.
sudo tee /etc/google-cloud-ops-agent/config.yaml > /dev/null << EOF
metrics:
receivers:
apache:
type: apache
service:
pipelines:
apache:
receivers:
- apache
logging:
receivers:
apache_access:
type: apache_access
apache_error:
type: apache_error
service:
pipelines:
apache:
receivers:
- apache_access
- apache_error
EOF
The previous command creates the configuration to collect and ingest logs
and metrics from the Apache web server. For more information, see
[Configure
the Ops Agent for Apache web server](https://docs.cloud.google.com/monitoring/agent/ops-agent/third-party/apache).
3. Restart the Ops Agent:
1. To restart the agent, run the following command on your instance:
```
sudo systemctl restart google-cloud-ops-agent
```
2. To confirm that the agent restarted, run the following command and verify that the components "Metrics Agent" and "Logging Agent" started:
```
sudo systemctl status "google-cloud-ops-agent*"
```
## Generate traffic
To generate traffic to your Apache web server, do the following:
1. Go to the SSH terminal for your VM instance.
If you don't have a terminal open, then do the following:
1. In the Google Cloud console, go to the **VM instances** page:
[Go to **VM instances**](https://console.cloud.google.com/compute/instances)
If you use the search bar to find this page, then select the result whose subheading is
**Compute Engine**.
2. Locate your new VM and then click **SSH** .
2. In the SSH terminal, run the following command, which generates requests
to your Apache web server:
timeout 120 bash -c -- 'while true; do curl localhost; sleep $((RANDOM % 4)) ; done'
3. Wait two minutes for the command prompt to return or for the terminal to close. While the command is running, HTML text is shown in the terminal.
## View Apache metrics
To view the **Apache Overview** dashboard, which is automatically created,
do the following:
1. In the Google Cloud console, go to the **Dashboards** page:
[Go to **Dashboards**](https://console.cloud.google.com/monitoring/dashboards)
If you use the search bar to find this page, then select the result whose subheading is
**Monitoring**.
2. In the **My Dashboards** pane, select
the **Apache Overview** dashboard from the list.
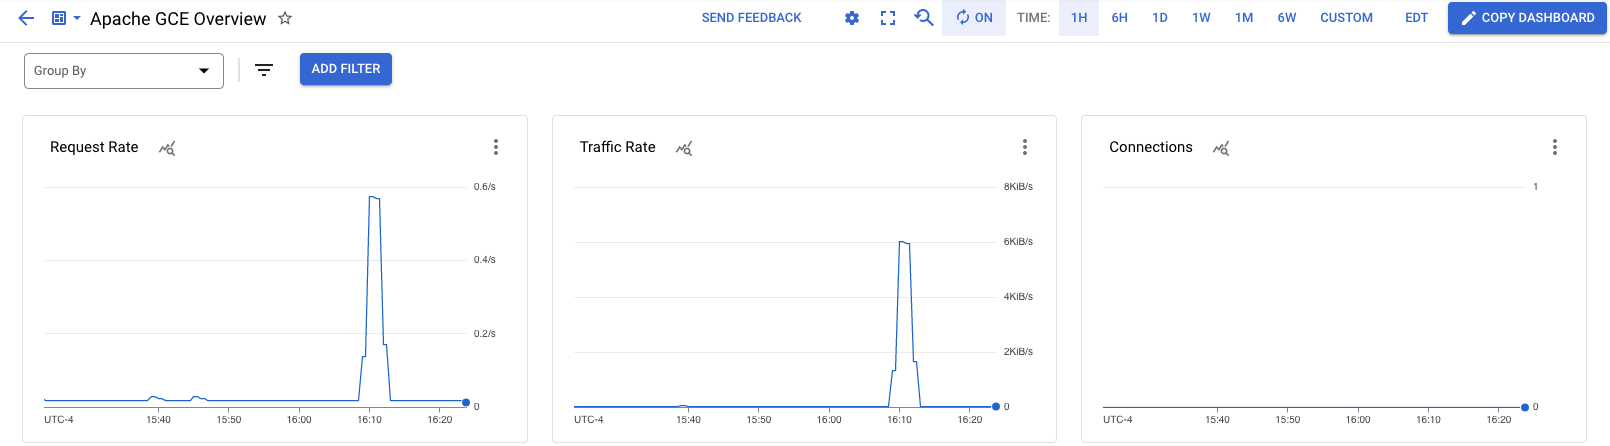
You've configured the Ops Agent to collect logs and metrics from your Apache
web server, and you've viewed the metrics. The next step is to
create an alerting policy so that you're notified when load on your
Apache web server exceeds a threshold.
## Create an email notification channel
Before you create an alerting policy, configure the notification channels that you want the alerting policy to use. Cloud Monitoring supports many different types of notification channels, including email, Slack, PagerDuty, and Pub/Sub. For more information, see [Create and manage notification channels](https://docs.cloud.google.com/monitoring/support/notification-options). To get notifications by e-mail, do the following:
1. In the Google Cloud console, go to the
**Alerting** page:
[Go to **Alerting**](https://console.cloud.google.com/monitoring/alerting)
If you use the search bar to find this page, then select the result whose subheading is
**Monitoring**.
2. In the toolbar, click **Edit Notification Channels**.
3. On the **Notification channels** page, scroll to **Email**, and then click **Add new**.
4. Enter your email address, a display name such as `My email`, and then click **Save**.
## Create an alerting policy
In this section, you create an alerting policy so that you are notified
when the traffic to your Apache web server exceeds a defined threshold:
1. In the Google Cloud console, go to the
**Alerting** page:
[Go to **Alerting**](https://console.cloud.google.com/monitoring/alerting)
If you use the search bar to find this page, then select the result whose subheading is
**Monitoring**.
2. Click **Create policy**.
3. Select the time series to be monitored:
1. Click **Select a metric** and select **VM instance**.
2. In the **Active metric categories** list, select **Apache**.
3. In the **Active metrics** list, select **workload/apache.traffic**.
4. Click **Apply**.
The chart for Apache traffic is shown.
4. Advance to the **Configure trigger** fields, and then
set the **Threshold value** field to `1500`.
The chart displays the threshold as a dashed line. Ensure that the
dashed line is much less than the peak traffic level.
5. Advance to the **Notifications and name** fields, and then use the
**Notification channels** menu to select your email address.
6. For the policy name, enter `Apache traffic above threshold`.
7. Advance to the **Review alert** fields, review the
alerting policy, and then click **Create policy**.
## Test the alerting policy
To test the alerting policy, generate traffic that exceeds the threshold:
1. Go to the SSH terminal for your VM instance.
If you don't have a terminal open, then do the following:
1. In the Google Cloud console, go to the **VM instances** page:
[Go to **VM instances**](https://console.cloud.google.com/compute/instances)
If you use the search bar to find this page, then select the result whose subheading is
**Compute Engine**.
2. Locate your new VM and then click **SSH** .
2. In the SSH terminal, run the following command, which generates requests
to your Apache web server:
timeout 120 bash -c -- 'while true; do curl localhost; sleep $((RANDOM % 4)) ; done'
3. Wait two minutes for the command prompt to return or for the terminal to close. While the command is running, HTML text is shown in the terminal.
4. When the command prompt returns, check your email for a message whose
subject line begins with `[ALERT]`.
If you don't see an email, then examine the chart on the alerting policy to
verify that the traffic level exceeded the threshold. You might need to run
the previous command again. Otherwise, wait a minute or two for the email
to arrive.
The notification provides a summary of the alerting policy and a link to
an incident. Each *incident* contains a record of the failure, and these
are typically helpful when troubleshooting.

You've configured the Ops Agent to collect logs and metrics from your
Apache web server, but you've only viewed metrics. For information
about how to view Apache web server logs, see the quickstart
[View Apache web server logs](https://docs.cloud.google.com/logging/docs/logging-gce-quickstart#view_logs).
## Clean up
To avoid incurring charges to your Google Cloud account for
the resources used on this page, follow these steps.
If you created a new project and you no longer need the project, then
[delete the project](https://console.cloud.google.com/cloud-resource-manager).
If you used an existing project, then do the following:
1. If you created a VM, then delete it:
1. In the Google Cloud console, go to the **VM instances** page.
[Go to VM instances](https://console.cloud.google.com/compute/instances)
2. Select the checkbox for the instance that you want to delete.
3. To delete the instance, click **More actions** , click **Delete**, and then follow the instructions.
2. Delete the alerting policy that you created:
1. In the Google Cloud console, go to the
**Alerting** page:
[Go to **Alerting**](https://console.cloud.google.com/monitoring/alerting)
If you use the search bar to find this page, then select the result whose subheading is
**Monitoring**.
2. Select the alerting policy that you created, and then click **Delete**.
## What's next
- To learn about the Ops Agent and supported integrations, see:
- [Ops Agent overview](https://docs.cloud.google.com/monitoring/agent/ops-agent).
- [Monitor third-party applications](https://docs.cloud.google.com/monitoring/agent/ops-agent/third-party)
- To learn how to test whether a URL is responding to requests and to
simulate a failure, see the quickstart
[Get notified if your application stops responding](https://docs.cloud.google.com/monitoring/monitoring-uptime).
- To view logs from your Apache web server, see the quickstart
[Cloud Logging for Compute Engine VMs](https://docs.cloud.google.com/logging/docs/logging-gce-quickstart).
- To learn about charting and viewing performance data, see
[Dashboards overview](https://docs.cloud.google.com/monitoring/dashboards).
- For a list of metrics supported by Google Cloud, see
[Metrics list](https://docs.cloud.google.com/monitoring/api/metrics).
- To create your own Monitoring metrics,
see [Custom metrics](https://docs.cloud.google.com/monitoring/custom-metrics).