Configuring Google Cloud Observability for Application Monitoring lets you view and analyze logs,
metrics, and traces from your [App Hub](https://docs.cloud.google.com/app-hub/docs/overview)
applications in a single interface, even when your telemetry is stored across
multiple Google Cloud projects. To set up Google Cloud Observability, you configure the
observability scope---which includes the default log scope,
metrics scope, and default trace scope---and grant
IAM roles. This setup applies whether you register an existing
application with App Hub or deploy applications by using
[Application Design Center](https://docs.cloud.google.com/application-design-center/docs/overview).
To display application-associated alerts on your Application Monitoring
dashboards, you can also
[associate your alerting policies with your App Hub application](https://docs.cloud.google.com/monitoring/docs/setup-application-monitoring#alert).
If you run workloads on Google Kubernetes Engine and want Application Monitoring dashboards to
display HTTP traffic, latency, and error rate golden signals, see
[Instrument an application for Application Monitoring](https://docs.cloud.google.com/monitoring/docs/instrument-for-application-monitoring).
## Before you begin
- Identify the project whose observability scope you will configure.
This project is one of the following:
- An App Hub host project.
- An App Hub management project for your single-project boundary.
- An App Hub management project for your app-enabled folder.
In this document, when the type of management project isn't specified,
the configuration task applies to all management projects.
- Make sure that you have the necessary Identity and Access Management (IAM) roles
to configure the observability scope. The required IAM
roles depend upon whether you plan to create an
[aggregated sink](https://docs.cloud.google.com/logging/docs/export/aggregated_sinks), which lets you
centralize the storage of log data.
### Configure sink and scopes
To get the permissions that
you need to configure observability scopes and create an aggregated log sink,
ask your administrator to grant you the
[Organization Administrator](https://docs.cloud.google.com/iam/docs/roles-permissions/resourcemanager#resourcemanager.organizationAdmin) (`roles/resourcemanager.organizationAdmin`) IAM role on your organization.
For more information about granting roles, see [Manage access to projects, folders, and organizations](https://docs.cloud.google.com/iam/docs/granting-changing-revoking-access).
You might also be able to get
the required permissions through [custom
roles](https://docs.cloud.google.com/iam/docs/creating-custom-roles) or other [predefined
roles](https://docs.cloud.google.com/iam/docs/roles-overview#predefined).
### Only configure scopes
To get the permissions that
you need to configure the observability scope,
ask your administrator to grant you the
following IAM roles:
- [Observability Editor](https://docs.cloud.google.com/iam/docs/roles-permissions/observability#observability.editor) (`roles/observability.editor`) on your [App Hub](https://docs.cloud.google.com/app-hub/docs/overview) host project or management project
- [Logs Configuration Writer](https://docs.cloud.google.com/iam/docs/roles-permissions/logging#logging.configWriter) (`roles/logging.configWriter`) on your [App Hub](https://docs.cloud.google.com/app-hub/docs/overview) host project or management project
- [Monitoring admin](https://docs.cloud.google.com/iam/docs/roles-permissions/monitoring#monitoring.admin) (`roles/monitoring.admin`) on your [App Hub](https://docs.cloud.google.com/app-hub/docs/overview) host project or management project and on each project that you want to add to the metrics scope
- [Cloud Trace User](https://docs.cloud.google.com/iam/docs/roles-permissions/cloudtrace#cloudtrace.user) (`roles/cloudtrace.user`) on your [App Hub](https://docs.cloud.google.com/app-hub/docs/overview) host project or management project
- [App Hub viewer](https://docs.cloud.google.com/iam/docs/roles-permissions/apphub#apphub.viewer) (`roles/apphub.viewer`) on your [App Hub](https://docs.cloud.google.com/app-hub/docs/overview) host project or management project
For more information about granting roles, see [Manage access to projects, folders, and organizations](https://docs.cloud.google.com/iam/docs/granting-changing-revoking-access).
You might also be able to get
the required permissions through [custom
roles](https://docs.cloud.google.com/iam/docs/creating-custom-roles) or other [predefined
roles](https://docs.cloud.google.com/iam/docs/roles-overview#predefined).
## Configure the observability scope
The observability scope controls how explorer and dashboard pages search for
the data to display. Each Google Cloud project contains a single
[observability scope](https://docs.cloud.google.com/stackdriver/docs/observability/scopes).
You don't directly configure a project's observability scope. Instead,
for your project, you configure the following:
- The default log scope
Configure this scope so that when you open the
**Logs Explorer** page or view dashboards, your
application's log data is displayed. Make sure this scope lists the
projects and log views that store your application's log data.
- The metrics scope
Configure this scope so that your charts, for example, those you create
by using the **Metrics Explorer** page, and alerting policies can
display or monitor your application's metric data. Make sure this
scope lists the projects that store your application's metric data.
- The default trace scope
Configure this scope so that when you open the
**Trace Explorer** page, your application's trace data is displayed.
Make sure this scope lists the projects that store your application's
trace data.
The remainder of this section provides guidance about how to configure these
scopes.
### Configure and set the default log scope
Do one of the following:
- If you have an organization-level
[aggregated sink](https://docs.cloud.google.com/logging/docs/export/aggregated_sinks)
that routes all log data in your organization to a centralized log bucket,
then we recommend the following:
1. [Create a log view](https://docs.cloud.google.com/logging/docs/logs-views) on the centralized
log bucket for your application logs.
2. In your
[App Hub](https://docs.cloud.google.com/app-hub/docs/overview) host project or
management project,
[create a log scope](https://docs.cloud.google.com/logging/docs/log-scope/create-and-manage)
and add your log view, and then set this scope as the
default log scope.
- If you are using an app-enabled folder and if you don't have an
organization-level aggregated sink or nested folders, then we recommend
the following:
1. Create an
[intercepting aggregated sink for your app-enabled folder](https://docs.cloud.google.com/logging/docs/export/aggregated_sinks),
and route those logs to the
`_Default` log bucket of the management project for your app-enabled folder.
2. In the management project for your app-enabled folder,
make sure that the log scope named `_Default` is set as the
[default log scope](https://docs.cloud.google.com/logging/docs/log-scope/create-and-manage#set-default).
The scope named `_Default` lists the `_AllLogs` view on the project's
`_Default` log bucket, which is the centralized
storage location for your application.
- If you aren't using an aggregated sink, then for
your
[App Hub](https://docs.cloud.google.com/app-hub/docs/overview) host project or
management project, configure the
[default log scope](https://docs.cloud.google.com/logging/docs/log-scope/create-and-manage#set-default)
to list the storage locations of your application's log data.
We recommend that you add log views on the log buckets
that store your log data.
For example, suppose you have configured an app-enabled folder and that
you aren't using an aggregated sink. Then, you might do the following:
1. In the management project for your app-enabled folder, you create a log scope.
2. You add to the log scope one log view for each project in
your folder, including the management project.
The view you add is the `_AllLogs` view on the project's `_Default`
log bucket. This view includes all logs in the `_Default` log bucket,
and the `_Default` log bucket stores your application log data.
After you complete this step, the log scope might have
entries like the following:
_Default/_AllLogs my-folder-mp
_Default/_AllLogs project-in-my-folder
_Default/_AllLogs another-project-in-my-folder
3. You save your log scope and set it as the
default log scope.
### Configure the metrics scope
Make sure that the metrics scope for
your
[App Hub](https://docs.cloud.google.com/app-hub/docs/overview) host project or
management project
lists all projects that store your application's metric data:
- For app-enabled folders, Google Cloud Observability attempts to
synchronize the list of projects in your app-enabled folder with the list
of projects in the metrics scope. For example, if you add a
project to the app-enabled folder, then a command is issued to
add that project to the metrics scope.
When the number of projects in your app-enabled folder doesn't exceed your
metrics scope quota, which defaults to 375
projects per metrics scope, then Google Cloud Observability can keep the list of
projects in the metrics scope synchronized with the list of projects in
your app-enabled folder. For example, suppose the quota is
375 projects per metrics scope. If
your app-enabled folder contains 100 projects, then the metrics scope
lists all projects in your app-enabled folder. If you add projects to your
app-enabled folder, then they are also added to the
metrics scope.
When the number of projects in your app-enabled folder exceeds your
metrics scope quota, then the list of projects in the metrics scope
won't include all projects in your app-enabled folder. For example,
suppose the quota is 375 projects per metrics scope and suppose your
app-enabled folder contains 380 projects. After 375 projects are added
to the metrics scope, quota is exhausted and the attempts to add the
remaining 5 projects fail. As a result, some application data isn't
available to the management project for your app-enabled folder.
We recommend that you review your usage of your metrics scope quota
and determine whether you need to request a quota update or manually
modify the metrics scope. For information about these steps, see
[Metrics scopes for app-enabled folders](https://docs.cloud.google.com/monitoring/settings/metrics-scope-app-enabled-folders).
- For App Hub host projects and for
management projects for single-project boundaries, you must
[configure the metrics scope](https://docs.cloud.google.com/monitoring/settings/multiple-projects).
If you change the set of projects that store your metric data, then you must
also update the metrics scope of your host project.
### Configure and set the default trace scope
Do the following:
1. For each project that will store your application's trace data, we recommend
that you enable the Observability API:
**Roles required to enable APIs**
To enable APIs, you need the `serviceusage.services.enable` permission. If you
created the project, then you likely already have this permission through the
Owner role (`roles/owner`). Otherwise, you can get this permission through the
Service Usage Admin role (`roles/serviceusage.serviceUsageAdmin`).
[Learn how to grant roles](https://docs.cloud.google.com/iam/docs/granting-changing-revoking-access).
[Enable the API](https://console.cloud.google.com/apis/enableflow?apiid=observability.googleapis.com)
2. In your
[App Hub](https://docs.cloud.google.com/app-hub/docs/overview) host project or
management project,
[create a trace scope](https://docs.cloud.google.com/trace/docs/trace-scope/create-and-manage)
and add projects that store your application's trace data. If you are
using an app-enabled folder, then add the projects in that folder.
3. Set your custom trace scope as the
[default trace scope](https://docs.cloud.google.com/trace/docs/trace-scope/create-and-manage#set-default).
The topology graph can only show trace data from projects in the same
organization as your host project or your management project.
## Associate an alerting policy with an App Hub application
To view your alerting policies from the context of Application Monitoring, you must
associate them with a service or workload by adding
application-specific labels to the alerting policy. These user-defined labels
are also included in any alerts created for a policy.
To learn more about labels, see
[Annotate alerts with labels](https://docs.cloud.google.com/monitoring/alerts/labels).
For a list of App Hub labels, see
[View application telemetry](https://docs.cloud.google.com/monitoring/docs/application-monitoring).
To associate an alerting policy with a workload or service by using
the Google Cloud console, do the following:
1. In the Google Cloud console, go to the
**Alerting** page:
[Go to **Alerting**](https://console.cloud.google.com/monitoring/alerting)
If you use the search bar to find this page, then select the result whose subheading is
**Monitoring**.
2. In the toolbar of the Google Cloud console, select your [App Hub](https://docs.cloud.google.com/app-hub/docs/overview) host project or management project.
3. Find the alerting policy, click **View more** , select **Edit** , and then go to the **Notifications and name** section.
4. In the **Application labels** section, select your application and
then select your service or workload:
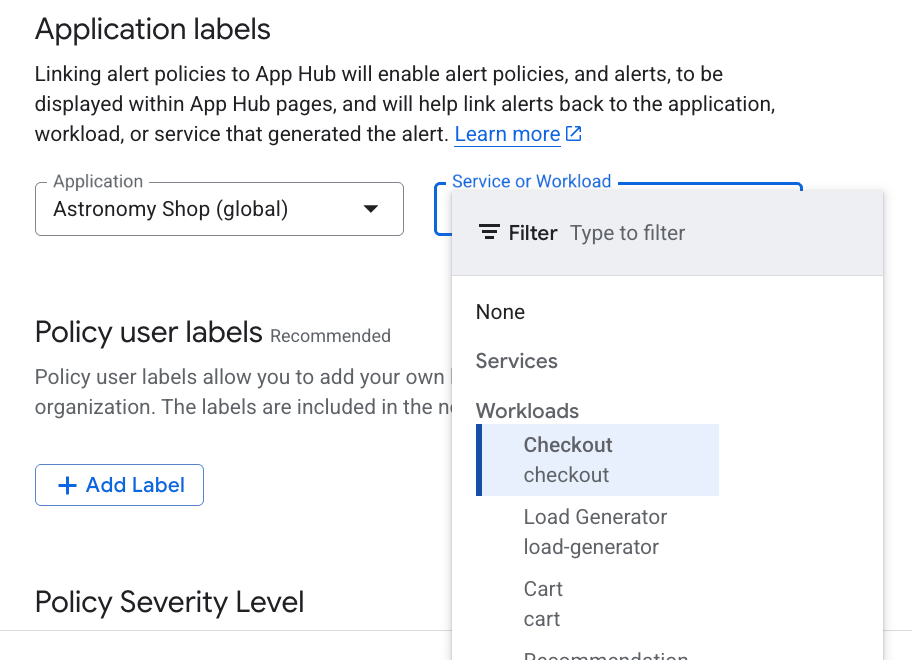
5. Click **Save policy**.
After you complete these steps, labels with the following keys are attached to
your alerting policy. These labels identify your application and your service or
workload:
- `apphub_application_location`
- `apphub_application_id`
- `apphub_service_id` or `apphub_workload_id`
You can also add user labels to an alerting policy by using the
Google Cloud CLI, Terraform, or the Cloud Monitoring API.
However, you must use the label keys shown in the previous example.
For more information, see the following:
- [Manage alerting policies by API](https://docs.cloud.google.com/monitoring/alerts/using-alerting-api#api-update-policy).
- [Manage alerting policies with Terraform](https://docs.cloud.google.com/monitoring/alerts/manage-alerts-terraform).
## Grant access
IAM manages access to your log, metric, and trace
data. This section summarizes roles that you might want to grant to
principals:
- [Logs View Accessor](https://docs.cloud.google.com/iam/docs/roles-permissions/logging#logging.viewAccessor)
(`roles/logging.viewAccessor`) on the log views listed in the default
log scope of your
[App Hub](https://docs.cloud.google.com/app-hub/docs/overview) host project or
management project.
To learn more about granting access to a log view, see
[Control access to a log view](https://docs.cloud.google.com/logging/docs/logs-views#about-iam-policies).
- [Logs Viewer](https://docs.cloud.google.com/iam/docs/roles-permissions/logging#logging.viewer)
(`roles/logging.viewer`) on your
[App Hub](https://docs.cloud.google.com/app-hub/docs/overview) host project or
management project
and on any other projects listed in its default log scope. This role
grants access to most log entries in the `_Default` log bucket.
For more information, see [Logging roles](https://docs.cloud.google.com/logging/docs/access-control#considerations).
- [Monitoring Editor](https://docs.cloud.google.com/iam/docs/roles-permissions/monitoring#monitoring.editor) role
(`roles/monitoring.editor`) on your
[App Hub](https://docs.cloud.google.com/app-hub/docs/overview) host project or
management project.
For principals who don't need to create alerting policies, consider
granting the
[Monitoring Viewer](https://docs.cloud.google.com/iam/docs/roles-permissions/monitoring#monitoring.editor) role
(`roles/monitoring.viewer`).
- [Cloud Trace User](https://docs.cloud.google.com/iam/docs/roles-permissions/cloudtrace#cloudtrace.user)
(`roles/cloudtrace.user`) on your
[App Hub](https://docs.cloud.google.com/app-hub/docs/overview) host project or
management project and
on the projects listed in its default trace scope.
- [App Hub viewer](https://docs.cloud.google.com/iam/docs/roles-permissions/apphub#apphub.viewer)
(`roles/apphub.viewer`) on your
[App Hub](https://docs.cloud.google.com/app-hub/docs/overview) host project or
management project.
## What's next
- [View application telemetry](https://docs.cloud.google.com/monitoring/docs/application-monitoring).
- [View application topology](https://docs.cloud.google.com/monitoring/docs/application-topology).
- [Instrument an application for Application Monitoring](https://docs.cloud.google.com/monitoring/docs/instrument-for-application-monitoring).
- [Application Monitoring supported infrastructure](https://docs.cloud.google.com/monitoring/docs/application-monitoring-services).