You can use Application Monitoring to monitor the health, performance, and cost of the AI
resources used by your App Hub-registered applications, services, and
workloads. Application Monitoring queries trace data containing application-specific
labels and events that follow the [OpenTelemetry GenAI semantic conventions](https://github.com/open-telemetry/semantic-conventions/tree/v1.37.0/docs/gen-ai)
to generate aggregated and granular metrics such as error rate, latency, and
token usage.
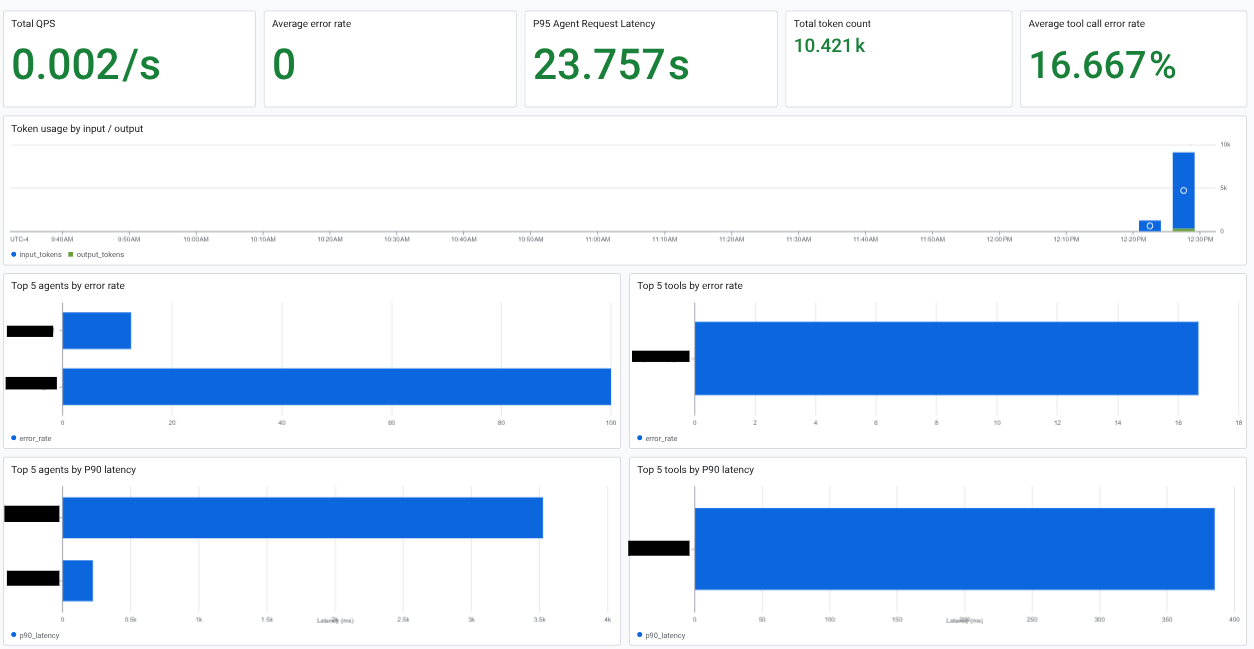
The following dashboard shows AI resource information for a registered
application:
## Before you begin
The procedures in this document require a Google Cloud project with active AI
resources to analyze. They also require that your AI resources are associated
with applications, services, and workloads that are registered with
App Hub. Application Monitoring needs telemetry and trace data to produce
meaningful results.
### Configure roles and APIs, and set up Application Monitoring
1. Complete the steps defined in [Investigate applications, services, and workloads: Before you begin](https://docs.cloud.google.com/monitoring/docs/application-monitoring#before_you_begin).
2.
Enable the Observability, Cloud Trace, and Telemetry APIs, if any are not already enabled.
**Roles required to enable APIs**
To enable APIs, you need the `serviceusage.services.enable` permission. If you
created the project, then you likely already have this permission through the
Owner role (`roles/owner`). Otherwise, you can get this permission through the
Service Usage Admin role (`roles/serviceusage.serviceUsageAdmin`).
[Learn how to grant roles](https://docs.cloud.google.com/iam/docs/granting-changing-revoking-access).
[Enable the APIs](https://console.cloud.google.com/apis/enableflow?apiid=observability.googleapis.com,cloudtrace.googleapis.com,telemetry.googleapis.com)
3.
To get the permissions that
you need to view AI resource usage information,
ask your administrator to grant you the
following IAM roles:
- [Observability Viewer](https://docs.cloud.google.com/iam/docs/roles-permissions/observability#observability.viewer) (`roles/observability.viewer`) on your project
- [Observability View Accessor](https://docs.cloud.google.com/iam/docs/roles-permissions/observability#observability.viewaccessor) (`roles/observability.viewaccessor`) on the observability views that you want to query. You can restrict this grant to a specific view.
For more information about granting roles, see [Manage access to projects, folders, and organizations](https://docs.cloud.google.com/iam/docs/granting-changing-revoking-access).
You might also be able to get
the required permissions through [custom
roles](https://docs.cloud.google.com/iam/docs/creating-custom-roles) or other [predefined
roles](https://docs.cloud.google.com/iam/docs/roles-overview#predefined).
### Develop and register applications, services, and workloads
To display data for AI resources that your applications, services, and workloads
use, your trace data must contain application-specific labels and events that
follow the [OpenTelemetry GenAI semantic conventions](https://github.com/open-telemetry/semantic-conventions/tree/v1.37.0/docs/gen-ai). You can get these
labels by completing the following steps:
1. Register your application and its services and workloads with App Hub.
2. Use the [Agent Development Kit (ADK) framework](https://google.github.io/adk-docs/) or instrument your application with OpenTelemetry and send your trace data to the Telemetry API. For instrumentation samples, see [Instrument ADK applications with OpenTelemetry](https://docs.cloud.google.com/stackdriver/docs/instrumentation/ai-agent-adk) and [Overview of collector-based instrumentation samples](https://docs.cloud.google.com/stackdriver/docs/instrumentation/setup/sample-overview).
## View AI resources for an application
To view AI resources associated with an application, do the following:
1. In the Google Cloud console, go to the **Application monitoring** page:
[Go to **Application monitoring**](https://console.cloud.google.com/monitoring/applications)
If you use the search bar to find this page, then select the result whose subheading is
**Monitoring**.
2. In the toolbar of the Google Cloud console, select
your
[App Hub](https://docs.cloud.google.com/app-hub/docs/overview) host project or
management project.
3. Select the **Applications** tab, and then select the application from the
list.
4. Select the **Dashboards** tab.
5. In the dashboard's **Table of contents** , select **AI resources**.
The system creates the **AI resources** entry when you have at least one
AI agent associated with your application that is active. If you don't
have any agents or all agents are inactive, the option isn't listed.
The dashboard goes to the **AI resources** section, which displays information
such as the following:
- Total queries per second and token count.
- Average error rate, latency, and tool-call error rate.
- Token usage.
- Error rates and latency for agents.
## View AI resources for a service or workload
To view AI resources associated with a service or workload, do the following:
1. Open the dashboard for the service or workload:
1. In the Google Cloud console, go to the **Application monitoring** page:
[Go to **Application monitoring**](https://console.cloud.google.com/monitoring/applications)
If you use the search bar to find this page, then select the result whose subheading is
**Monitoring**.
2. Select the **Services and Workloads** tab and then select the service or
workload.
The dashboard for the service or workload opens. The **Table of contents**
lists the sections in the dashboard, which might depend on the type of
AI resource.
2. To go to the section of the dashboard with information about your
AI resources, use the dashboard's **Table of contents**:
- **Agent**: Available for agents. This section displays information
about sessions, agent invocations, and token usage.
- **Tools**: Available for agents. This section displays information
about tool calls, including error rate, call count, and P95 latency.
- **Models**: Available for some agents. This section displays information
about the number of model calls made by the agent, error rate, and
token usage.
## Explore telemetry
SQL queries against your trace data determine the data displayed on AI-resource
charts. These queries filter trace data by
[application-specific labels](https://docs.cloud.google.com/monitoring/docs/application-monitoring-labels)
and generative AI events that follow the
[OpenTelemetry GenAI semantic conventions](https://github.com/open-telemetry/semantic-conventions/tree/v1.37.0/docs/gen-ai).
To view the query for a chart, in the toolbar of the chart,
select **More chart options** , and then select
**Explore in Observability Analytics**.
The **Observability Analytics** opens and displays the SQL query that generates data for the
chart. You have the following options:
- Inspect the query and then return to Application Monitoring.
- Run the query.
- Modify the query and then run the modified query.
- Create a chart that displays the query result.
- Save a chart that displays the query result to a custom dashboard.
To learn more, see the following documents:
- [Telemetry storage overview: Trace data](https://docs.cloud.google.com/stackdriver/docs/observability/storage-overview#trace-data-storage)
- [Observability Analytics](https://docs.cloud.google.com/stackdriver/docs/observability/analytics)