Text, section-header, and group widgets on a custom dashboard in
Cloud Monitoring let you document troubleshooting steps and organize
large collections of charts. You can use Markdown text widgets to display
links and operational guidance, and section headers to generate a navigable
table of contents. To reduce visual clutter and improve dashboard load times,
you can group widgets into collapsible, drop-down, or tab groups.
This document describes how to add these widgets by using the
Google Cloud console. For information about using the Cloud Monitoring API, see
[Create and manage dashboards by API](https://docs.cloud.google.com/monitoring/dashboards/api-dashboard).
## Before you begin
Complete the following in the Google Cloud project where you want to create and
modify custom dashboards:
-
To get the permissions that
you need to create and modify custom dashboards by using the Google Cloud console,
ask your administrator to grant you the
[Monitoring Editor](https://docs.cloud.google.com/iam/docs/roles-permissions/monitoring#monitoring.editor) (`roles/monitoring.editor`) IAM role on your project.
For more information about granting roles, see [Manage access to projects, folders, and organizations](https://docs.cloud.google.com/iam/docs/granting-changing-revoking-access).
You might also be able to get
the required permissions through [custom
roles](https://docs.cloud.google.com/iam/docs/creating-custom-roles) or other [predefined
roles](https://docs.cloud.google.com/iam/docs/roles-overview#predefined).
For more information about roles, see
[Control access with Identity and Access Management](https://docs.cloud.google.com/monitoring/access-control).
- You can put up to 100 widgets on a dashboard.
## Add text to a dashboard
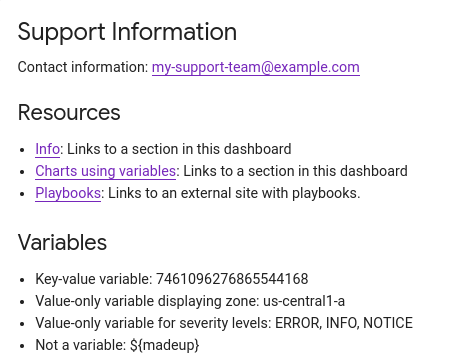
The following screenshot illustrates a text widget:
The information in this section is for the Google Cloud console.
For information about using the Cloud Monitoring API,
see [Dashboard with a `Text` widget](https://docs.cloud.google.com/monitoring/dashboards/api-examples#dashboard_with_a_text_widget).
To add a text widget to a dashboard, do the following:
1. In the Google Cloud console, go to the **Dashboards** page:
[Go to **Dashboards**](https://console.cloud.google.com/monitoring/dashboards)
If you use the search bar to find this page, then select the result whose subheading is
**Monitoring**.
2. In the toolbar of the Google Cloud console, select your Google Cloud project. For [App Hub](https://docs.cloud.google.com/app-hub/docs/overview) configurations, select the App Hub host project or management project.
3. Select a dashboard or click **Create dashboard**.
4. In the toolbar, click **Add widget**.
5. In the **Add widget** dialog, go to the **Layout** section, and then select **Text**.
6. Add a title.
7. In the **Content** pane, enter the text you want displayed.
For formatting information, see
[Markdown syntax](https://docs.cloud.google.com/monitoring/dashboards/text-and-grouping#supported-markdown).
8. Optional: Use the fields in the **Display** pane to customize your content.
For example, you might want to configure the
[visibility](https://docs.cloud.google.com/monitoring/dashboards/filter-permanent#set-visibility) of the widget.
9. To apply your changes to the dashboard, in the toolbar,
click **Apply** . To discard your changes, click **Cancel**.
10. To save your modified dashboard, in the toolbar, click **Save**.
### Markdown syntax
This section describes most of the Markdown syntax that is supported by
the text widget. HTML tags aren't supported.
- Headers
A line starting with a hash, `#`, indicates a header.
You can use multiple hash signs for different levels of headers.
For example, for a top-level header use a single hash, `# Header`.
For a second-level header, use two hashes, `## Second-level header`.
- Paragraphs
To create a new paragraph, use a blank line.
- Emphasis
- Italic: Use `*italic*` or `_italic_`.
- Bold: Use `**bold**` or `__bold__`.
- Bold and Italic: Use `***bold and italic***`.
- Fixed font: Use backticks, `` `fixed font` ``.
- Links: Format as `[link text](path)`.
You can use any value for the `link text`. The value for `path` must
reference an HTML anchor in the dashboard or be a URL to an external
page.
- To link to another section in the dashboard, set `path` to the
section's anchor. The anchor for a section
is the section title, converted to lowercase with words separated by
a hyphen. For example, to link to a section with
the title "Charts using variables", set the `path` to
`#charts-using-variables`.
- To link to an external resource, set `path` to the URL. For example,
to link to `example.com`, set `path` to `https://example.com/`.
- Lists: You can create ordered or unordered lists, and you can nest lists.
- For ordered lists, prefix each list item with `1.`. When the text is
rendered, the elements are numbered sequentially. For example:
1. Ordered list item 1
1. Ordered list item 2
- For unordered lists, prefix each list item with a plus `(+)`,
dash `(-)`, or asterisk `(*)`. For example:
+ Unordered list item 1
+ Unordered list item 2
- To nest lists, indent the nested list. For example:
1. Item 1
+ Nested unordered-list item 1
+ Nested unordered-list item 2
1. Item 2
1. Nested ordered-list item 1
1. Nested ordered-list item 2
- [Variables](https://docs.cloud.google.com/monitoring/dashboards/filter-permanent): Format as `${VARIABLE_NAME}`.
The text widget renders only the value or values of the variable.
For example, if you have a label-based variable where the key is `zone`
and the value is `us-west1`, then the text widget displays `us-west1`.
When the value of a variable is the wildcard `(*)`, the text widget
displays `all`.
Unrecognized variables are displayed as written and aren't rendered.
- Escaping characters
Some characters, like plus signs `(+)`, are converted into list elements.
If you want to display these types of characters literally, then use a
backslash to escape the character, `\+`.
## Organize dashboard widgets
Custom dashboards let you specify the position of the charts,
alerting policies, and other widgets. However, you can improve the
usability of a dashboard that has many widgets by creating sections in your
dashboard or by grouping widgets:
- To create indexed sections in your dashboard, use the
section-header widget. When you add this widget to your dashboard,
a table of contents is created and a horizontal divider is added to the
dashboard. The table of contents lets you navigate to a specific section of
the dashboard. Each section widget contains an anchor. When you are
troubleshooting, you might want to share the section URL with a teammate.
To copy the section URL, right-click **Link to heading** ,
and then select **Copy link address**.
- To reduce the time to load a dashboard, use group widgets. There
are three types of group widgets: collapsible, drop-down, and tab.
Group widgets contain a collection of widgets,
and they improve performance by retrieving data at a lower priority for
collection members that aren't displayed. The collapsible group widget
displays every member of the collection when it is expanded;
otherwise, all members are hidden. In contrast, the drop-down group and
tab group widgets display only one member of the collection.
The difference between these widgets is whether you select
the member to display by using a menu or a tab.
To use the widgets described in this section, your custom dashboard must
use mosaic mode, which is the default layout. If you change the layout to
that of a grid, then these widgets aren't available.
For most widgets, you can configure their
[visibility](https://docs.cloud.google.com/monitoring/dashboards/filter-permanent#set-visibility). However, organizational widgets
are always visible.
The remainder of this section describes how to add and configure widgets
that you can use to organize your dashboards. For information about
modifying these widgets, see
[Modify a widget's configuration](https://docs.cloud.google.com/monitoring/charts/manage-widgets#editing).
### Add a section-header widget
For information about using the Cloud Monitoring API to create
a section-header widget, see
[Dashboard with a `SectionHeader` widget](https://docs.cloud.google.com/monitoring/dashboards/api-examples#dashboard_with_section).
To add a section-header widget by using the Google Cloud console,
do the following:
1. In the Google Cloud console, go to the **Dashboards** page:
[Go to **Dashboards**](https://console.cloud.google.com/monitoring/dashboards)
If you use the search bar to find this page, then select the result whose subheading is
**Monitoring**.
2. In the toolbar of the Google Cloud console, select your Google Cloud project. For [App Hub](https://docs.cloud.google.com/app-hub/docs/overview) configurations, select the App Hub host project or management project.
3. In the **Add widget** dialog, go to the **Layout** section, and then select **Section header** widget.
4. On the widget, click **Edit section**, and complete the
dialog:
- The value of the **Section name** field is displayed in the table of contents.
- The value for the **Subheading** field is displayed on the dashboard.
- If you select **Add a divider to the Table of Contents**, then a horizontal line is added after the entry in the table of contents.
### Add collapsible group widgets
For information about using the Cloud Monitoring API to create
a collapsible group widget, see
[Dashboard with a `CollapsibleGroup` widget](https://docs.cloud.google.com/monitoring/dashboards/api-examples#dashboard_with_cgroup).
To add a collapsible group widget by using the Google Cloud console,
do the following:
1. In the Google Cloud console, go to the **Dashboards** page:
[Go to **Dashboards**](https://console.cloud.google.com/monitoring/dashboards)
If you use the search bar to find this page, then select the result whose subheading is
**Monitoring**.
2. In the toolbar of the Google Cloud console, select your Google Cloud project. For [App Hub](https://docs.cloud.google.com/app-hub/docs/overview) configurations, select the App Hub host project or management project.
3. In the **Add widget** dialog, go to the **Layout** section, and then select **Collapsible Group**.
4. To add a widget to the group, drag the widget to the group.
After you add widgets to the group, you can use your pointer to resize and
reposition those widgets.
5. To add a descriptive title to the group, place your pointer on the widget
to activate the toolbar, and then click **Edit group**.
6. Optional: To force the group to be collapsed by default,
place your pointer on the widget to activate the toolbar, and then
click **Collapse group**.
When a collapsible group widget is collapsed,
Monitoring retrieves the data for the widgets in the
group at a lower priority than for other widgets. As a result, your
dashboard loads more quickly.
### Add drop-down group or tab group widgets
> [!NOTE]
> **Note:** At most 10 charts can be added to a drop-down group widget or to a tab group widget.
Drop-down group and tab group widgets contain a collection of other widgets,
but they only display one member of the collection. The difference between
these widgets is how you select which member of the collection is displayed.
Drop-down groups provide a menu, while tab groups provide tabs on the toolbar.
For information about using the Cloud Monitoring API to create these widgets,
see [Dashboard with a `SingleViewGroup` widget](https://docs.cloud.google.com/monitoring/dashboards/api-examples#dashboard_with_svgroup).
To add these widgets to a dashboard, do the following:
1. In the Google Cloud console, go to the **Dashboards** page:
[Go to **Dashboards**](https://console.cloud.google.com/monitoring/dashboards)
If you use the search bar to find this page, then select the result whose subheading is
**Monitoring**.
2. In the toolbar of the Google Cloud console, select your Google Cloud project. For [App Hub](https://docs.cloud.google.com/app-hub/docs/overview) configurations, select the App Hub host project or management project.
3. If necessary, create the widgets that you want to add to the group widget.
4. In the **Add widget** dialog, go to the **Layout** section, and then
select **Dropdown group** or **Tab group**.
A widget of the selected type is added to your dashboard.
5. To add widgets like a line chart to a group widget, drag them into
the group widget or edit the group widget and perform an add operation.
> [!NOTE]
> **Note:** Not all widget types can be added to a group widget.
For example, to add widgets to a tab group widget by editing the group,
do the following:
1. In the toolbar of the widget, select **Edit tab group** , and then select **Edit group**.
2. Optional: Enter a title for the group.
3. Click **Add widget** , and then make a selection from the
**Add widget** menu.
The **Add widget** menu lists the widgets that can be added to the
group.
4. Repeat the previous step for each widget that you want to add to the
tab group widget.
5. Use the **Lower** and
**Higher** buttons to order the widgets in the
group widget.
6. Click **Apply**.
The dashboard is refreshed and only one of the widgets that were added
to the group widget is visible.
The toolbar for the displayed widget lets you edit the displayed
widget or perform other actions.
6. To save your modified dashboard, in the toolbar, click **Save**.
## What's next
You can also add widgets to your custom dashboards that display the following:
- [Metric data](https://docs.cloud.google.com/monitoring/charts)
- [Log entries](https://docs.cloud.google.com/monitoring/charts/view-logs)
- [Trace data](https://docs.cloud.google.com/monitoring/dashboards/display-traces-on-dashboards)
- [Display alerts and charts for alerting policies](https://docs.cloud.google.com/monitoring/dashboards/alerts-and-incidents)
For information about exploring charted data and filtering your dashboards,
see the following documents:
- [Explore charted data](https://docs.cloud.google.com/monitoring/charts/working-with-charts)
- [Add temporary filters to a custom dashboard](https://docs.cloud.google.com/monitoring/charts/filter-dashboard)
- [Create and manage variables and pinned filters](https://docs.cloud.google.com/monitoring/dashboards/filter-permanent)