> [!NOTE]
>
>
> This feature is
>
> subject to the "Pre-GA Offerings Terms" in the General Service Terms section of the
> [Service Specific
> Terms](https://docs.cloud.google.com/terms/service-terms#1).
>
> Pre-GA features are available "as is" and might have limited support.
>
> For more information, see the
> [launch stage descriptions](https://cloud.google.com/products/#product-launch-stages).
Displaying trace data on a custom dashboard lets you correlate span
latencies and rates with your system metrics and application logs. You can
add trace heatmaps, charts, and span tables by inserting a trace widget,
saving a view from the **Trace Explorer** page, or using the
Cloud Monitoring API.
## Visualizing trace data
The **Trace Explorer** page provides a pre-configured suite of
visualizations for troubleshooting. By default, it displays a heatmap
of span latencies and lists of individual or grouped spans. For more
information, see [Find and explore traces](https://docs.cloud.google.com/trace/docs/finding-traces).
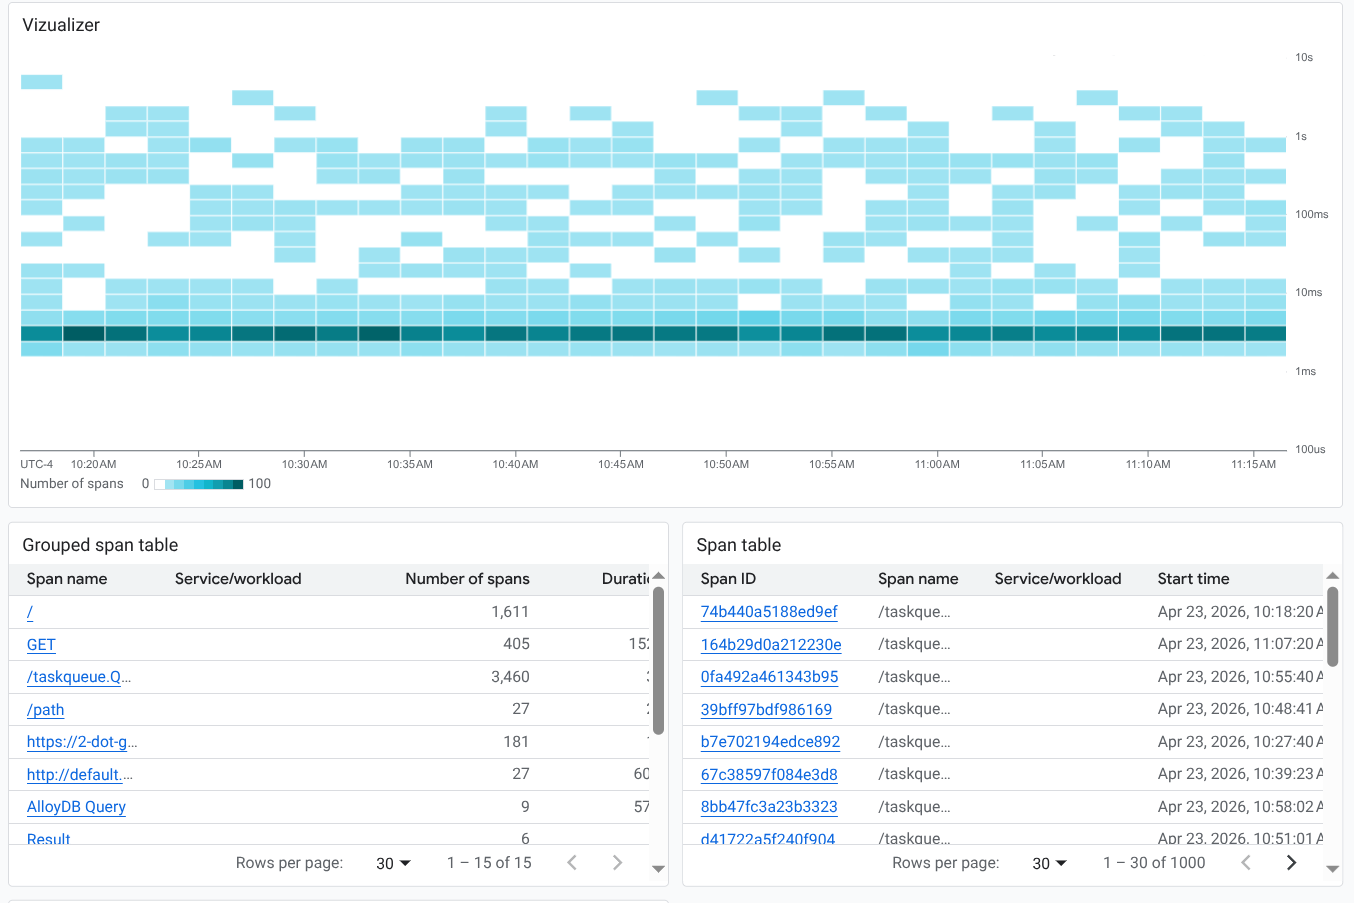
Because custom dashboards are modular, you can build a persistent version of
this comprehensive view by combining individual trace widgets. For example,
you can add a heatmap widget alongside separate tables for grouped and
individual spans. Recreating this layout on a dashboard lets you monitor
all aspects of your trace data in a single shared view with your other
telemetry:
By default, trace widgets display data from the resources in your
[default trace scope](https://docs.cloud.google.com/trace/docs/trace-scope/create-and-manage).
However, you can modify the scope of individual widgets to search different
projects or focus on specific resource groups.
When you edit a trace widget, an integrated version of the
**Trace Explorer** opens. This editor lets you add filters and modify
configuration options, just as you would when performing
investigations, before applying the persistent changes to your dashboard tiles.
## Before you begin
To get the permissions that
you need to display trace data on a custom dashboard,
ask your administrator to grant you the
following IAM roles:
- [Monitoring Editor](https://docs.cloud.google.com/iam/docs/roles-permissions/monitoring#monitoring.editor) (`roles/monitoring.editor`) on on your project.
- [Cloud Trace User](https://docs.cloud.google.com/iam/docs/roles-permissions/cloudtrace#cloudtrace.user) (`roles/cloudtrace.user`) on on each project whose trace entries you want to view.
For more information about granting roles, see [Manage access to projects, folders, and organizations](https://docs.cloud.google.com/iam/docs/granting-changing-revoking-access).
You might also be able to get
the required permissions through [custom
roles](https://docs.cloud.google.com/iam/docs/creating-custom-roles) or other [predefined
roles](https://docs.cloud.google.com/iam/docs/roles-overview#predefined).
You can put up to 100 widgets on a dashboard.
## Use the save option on the **Trace Explorer** page
The **Trace Explorer** offers several visualizations of your trace data.
You can add these visualizations to a dashboard to create a similar view.
To save data from the **Trace Explorer** to a custom dashboard, do the
following:
1. In the Google Cloud console, go to the

**Trace explorer** page:
[Go to **Trace explorer**](https://console.cloud.google.com/traces/explorer)
You can also find this page by using the search bar.
2. In the toolbar, select **Save to dashboard**.
3. Select the display style. You have the following options:
- **Visualizer**: Add a heatmap to your dashboard.
- **Span table**: Add a table of individual spans to your dashboard.
- **Grouped span table**: Add a table of grouped spans to your dashboard.
4. Select or create a dashboard.
5. Click **Save to dashboard**.
## Add a trace widget to a custom dashboard
This section describes how to display trace data on a custom dashboard. These
instructions use the Google Cloud console and assume that you're editing a
dashboard. For information about using the Cloud Monitoring API, see
[Dashboard displaying trace data](https://docs.cloud.google.com/monitoring/dashboards/api-examples#dashboard-with-trace-data).
To display trace data on a custom dashboard, do the following:
1. Open a custom dashboard:
1. In the Google Cloud console, go to the **Dashboards** page:
[Go to **Dashboards**](https://console.cloud.google.com/monitoring/dashboards)
If you use the search bar to find this page, then select the result whose subheading is
**Monitoring**.
2. In the toolbar of the Google Cloud console, select your Google Cloud project. For [App Hub](https://docs.cloud.google.com/app-hub/docs/overview) configurations, select the App Hub host project or management project.
3. Select a dashboard or click **Create dashboard**.
If you create a dashboard, then use the **Scope** menu to configure
which resources are searched for trace data. By default, the system
searches the resources in the
default [trace scope](https://docs.cloud.google.com/trace/docs/trace-scope/create-and-manage)
for trace data.
2. In the toolbar, click **Add widget**.
3. In the **Add widget** dialog, go to the **Data** section and select
**Trace**.
4. Configure the **Trace** widget. You can change the default view and title,
and add filters.
- To change the view, in the toolbar, expand the **Chart view** menu and
select a view:
- To add a heatmap (default), select **Span duration (heatmap)**.
- To display the rate of spans, select **Span rate (line chart)**.
- To display latency data, select **Span duration (percentile)**.
- To list spans in tabular format, select **Span rate (line chart)** or **Span duration (percentile)** , and use the **Widget type** menu to display a table. Selectors let you display grouped or ungrouped data.
- To restrict which traces are shown, add filters.
- To update the title, enter the new title in the **Widget title** field.
5. To apply your changes to the dashboard, in the toolbar,
click **Apply** . To discard your changes, click **Cancel**.
6. To save your modified dashboard, in the toolbar, click **Save**.
## Modify or edit a widget that displays trace data
To modify a widget, hold the pointer over the widget to
activate the toolbar, and then click **Edit widget**.
An editor opens. From this view, you can add or remove
filters and modify any configuration options. You can then save your changes to
your dashboard or discard them.
## Limitations
- Dashboard-level filters don't apply to trace widgets.
- You can't apply a variable to the query for a trace widget.
## What's next
- [Add text and groupings to a dashboard](https://docs.cloud.google.com/monitoring/dashboards/text-and-grouping).
- [Modify a widget's configuration](https://docs.cloud.google.com/monitoring/charts/manage-widgets#editing).