Metrics Explorer lets you build temporary charts to quickly visualize and
analyze the metric data collected by your Google Cloud project---such as the CPU
utilization of a virtual machine (VM)---without setting up a dashboard. You can
chart a single metric type, compare multiple metrics, or open existing
dashboard charts in Metrics Explorer to test different query and display
settings. When you build a chart that you want to keep, you can share it or
save it to a [custom dashboard](https://docs.cloud.google.com/monitoring/charts/dashboards).
## Before you begin
To get the permissions that
you need to create charts with Metrics Explorer,
ask your administrator to grant you the
[Monitoring Viewer](https://docs.cloud.google.com/iam/docs/roles-permissions/monitoring#monitoring.viewer) (`roles/monitoring.viewer`) IAM role on your project.
For more information about granting roles, see [Manage access to projects, folders, and organizations](https://docs.cloud.google.com/iam/docs/granting-changing-revoking-access).
You might also be able to get
the required permissions through [custom
roles](https://docs.cloud.google.com/iam/docs/creating-custom-roles) or other [predefined
roles](https://docs.cloud.google.com/iam/docs/roles-overview#predefined).
## Chart a single metric type
By default, when you create a chart, the display style is set to line chart.
This style of chart is appropriate for most metric data. You can change the
chart style by using the **Widget type** menu. The following is an example of
a chart for a single metric type:
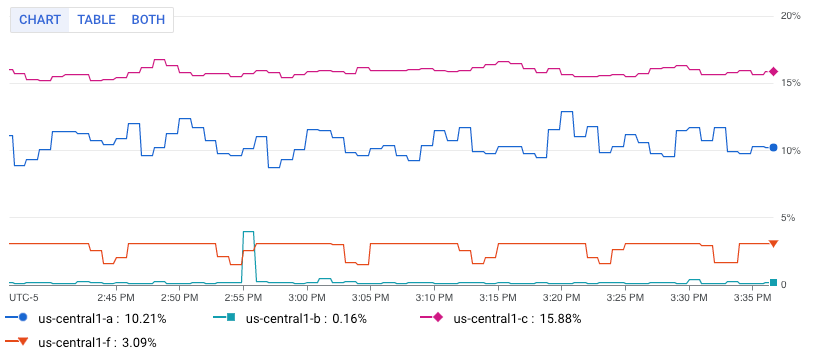
The image shows multiple lines. Each line displays the average CPU utilization
for all VMs in a specific zone.
> [!NOTE]
> **Note:** Some charts on dashboards contain options that let you open the chart in Metrics Explorer. For these charts, you can use Metrics Explorer to view the chart with different settings or to copy the chart to a different dashboard.
To configure a chart to display a single metric, do the following:
1. In the Google Cloud console, go to the
**Metrics explorer** page:
[Go to **Metrics explorer**](https://console.cloud.google.com/monitoring/metrics-explorer)
If you use the search bar to find this page, then select the result whose subheading is
**Monitoring**.
2. In the toolbar of the Google Cloud console, select your Google Cloud project. For [App Hub](https://docs.cloud.google.com/app-hub/docs/overview) configurations, select the App Hub host project or management project.
3. Specify the data to display on the chart. You can use a
menu-driven interface or PromQL, or you can enter a
Monitoring filter:
### Menu-driven interface
1. Select the time series data that you want to view:
1. In the **Metric** element, expand the **Select a metric** menu.
The **Select a metric** menu contains features that help you find
the metric types available:
- To find a specific metric type, use the **Filter bar** . For example, if you by enter `util`, then you restrict the menu to show entries that include `util`. Entries are shown when they pass a case-insensitive "contains" test.
- To show all metric types, even those without data, click **Active**. By default, the menus only show metric types with data.
For example, you might make the following choices:
1. In the **Active resources** menu, select **VM instance**.
2. In the **Active metric categories** menu, select **uptime_check**.
3. In the **Active metrics** menu, select **Request latency**.
4. Click **Apply**.
2. Optional: To specify a subset of data to display, in the **Filter** element, select **Add filter** , and then complete the dialog. For example, you can view data for one zone by applying a filter. You can add multiple filters. For more information, see [Filter charted data](https://docs.cloud.google.com/monitoring/charts/metrics-selector#filter-option).
For more information, see [Select the data to chart](https://docs.cloud.google.com/monitoring/charts/metrics-selector).
2. Combine and align time series:
- To display every time series, in the **Aggregation** element, set the first menu to **Unaggregated** and the second menu to **None**.
- To combine time series, in the **Aggregation** element, do the following:
1. Expand the first menu and select a function.
The chart is refreshed and displays a single time series. For
example, if you select **Mean**, then the displayed time series is
the average of all time series.
2. To combine time series that have the same label values,
expand the second menu, and then select one or more labels.
The chart is refreshed and shows one time series for each unique
combination of label values. For example, to display on time series
per zone, set the second menu to **zone**.
When the second menu is set to **None**, the chart displays one
time series.
- Optional: To configure the spacing between data points, click **Add query element** , select **Min Interval**, and then enter a value.
For more information about grouping and alignment, see
[Choose how to display charted data](https://docs.cloud.google.com/monitoring/charts/metrics-selector#select_display).
3. Optional: To display only the time series with the highest or lowest values, use the **Sort \& Limit** element.
### PromQL
1. In the toolbar of the query-builder pane, select the button whose name is **PromQL**.
2. Enter your query into the query editor. For example, to chart the average
CPU utilization of the VM instances in your Google Cloud project, use the
following query:
```
avg(compute_googleapis_com:instance_cpu_utilization)
```
For more information about using PromQL, see
[PromQL in Cloud Monitoring](https://docs.cloud.google.com/monitoring/promql).
### Monitoring filter
1. In the **Metric** element, click **Help** , and then
select **Direct Filter Mode**.
The **Metric** and **Filter** elements are deleted, and a **Filters**
element that lets you enter text, is created.
If you selected a resource type, metric,
or filters before switching to **Direct Filter Mode** mode, then
those settings are shown in the field of the **Filters** element.
2. Enter a Monitoring filter in the field of the **Filters** element.
3. Combine and align time series:
- To display every time series, in the **Aggregation** element, set the first menu to **Unaggregated** and the second menu to **None**.
- To combine time series, in the **Aggregation** element, do the following:
1. Expand the first menu and select a function.
The chart is refreshed and displays a single time series. For
example, if you select **Mean**, then the displayed time series is
the average of all time series.
2. To combine time series that have the same label values,
expand the second menu, and then select one or more labels.
The chart is refreshed and shows one time series for each unique
combination of label values. For example, to display on time series
per zone, set the second menu to **zone**.
When the second menu is set to **None**, the chart displays one
time series.
- Optional: To configure the spacing between data points, click **Add query element** , select **Min Interval**, and then enter a value.
For more information about grouping and alignment, see
[Choose how to display charted data](https://docs.cloud.google.com/monitoring/charts/metrics-selector#select_display).
## Advanced configuration options
This section describes the options available to you to customize your widget:
- [Break down your chart by labels](https://docs.cloud.google.com/monitoring/charts/metrics-explorer#breakdown)
- [Change the visualization](https://docs.cloud.google.com/monitoring/charts/metrics-explorer#visualization)
- [Change the chart's appearance](https://docs.cloud.google.com/monitoring/charts/metrics-explorer#appearance)
- [Chart multiple metric types](https://docs.cloud.google.com/monitoring/charts/metrics-explorer#chart-multiple-metrics)
- [Chart a ratio of metrics](https://docs.cloud.google.com/monitoring/charts/metrics-explorer#chart-ratio)
### Break down your chart by labels
By default, Metrics Explorer displays one chart that shows the
metric data you selected.
When you are investigating an issue, the breakdown feature can help you
determine whether specific resource types or locations are the cause.
To view your selected metric type broken down by labels, select
**Show breakdown**.
To learn about this feature, see
[Break down a chart by labels](https://docs.cloud.google.com/monitoring/charts/breakdown-chart-by-labels).
### Change the visualization
By default, Metrics Explorer displays your selected metric data as a
line chart. This style of chart is appropriate for most, but not all,
metric types.
Update the chart settings based on your selected metric type:
- For quota metric types, use the following settings:
- In the toolbar, set the time control to be at least one week. Quota metrics typically report one sample per day.
- In the **Display** pane, expand the **Widget type** menu and then select **Stacked bar chart**.
- For metric types that have a [Distribution](https://docs.cloud.google.com/monitoring/charts/distribution-apiref) value type, ensure that the **Widget type** menu is set to **Heatmap chart** . For more information, see [About distribution-valued metrics](https://docs.cloud.google.com/monitoring/charts/charting-distribution-metrics).
- For other metric types, use the **Widget type** menu to display how the data is shown. The **Widget type** menu lists all available widget types; however, some widgets might not be enabled. Consider a chart that displays multiple time series, and assume that each measured value is a double:
- **Line chart** , **Stacked bar chart** , and **Stacked area
chart** widgets are listed as **Compatible**. You can select any of these types.
- The **Heatmap** widget is disabled because these widgets can only display distribution-valued data.
### Change the chart's appearance
By default, Metrics Explorer displays time series using color mode. Each
time series is assigned a unique color and the background is white. However,
you can modify this appearance.
Optional: To change how a chart or table displays the selected data, use the
options in the **Display** pane:
- Chart options:
- [**Analysis mode** menu](https://docs.cloud.google.com/monitoring/charts/chart-view-options#chart-modes): Select between line charts, x-ray, and statics.
- [**Compare to Past** menu](https://docs.cloud.google.com/monitoring/charts/working-with-charts#comparetopast-option): Overlay current data with past data.
- [**Threshold Line** menu](https://docs.cloud.google.com/monitoring/charts/working-with-legends#descr_template): Add a reference threshold.
- [**Legend Alias** menu](https://docs.cloud.google.com/monitoring/charts/working-with-legends#descr_template): Configure the name of a legend column.
- [**Y-axis assignment** , **Y-axis labels** , and **Y-axis scale** menus](https://docs.cloud.google.com/monitoring/charts/chart-view-options#logscale-option): Configure configure Y-axis assignment, labels, or scale.
- Table options:
- [**Value option** menu](https://docs.cloud.google.com/monitoring/charts#display-latest-or-aggregated): Select between the latest value and an aggregated value.
- [**Visible columns** menu](https://docs.cloud.google.com/monitoring/charts#configure-visible-columns): Select which columns are shown.
- [**Column formatting** menu](https://docs.cloud.google.com/monitoring/charts#configure-columns): Configure column names, alignment of data in a column, units, and whether cells are color-coded.
- [**Metric view** menu](https://docs.cloud.google.com/monitoring/charts#reference-value): Select whether the value is show by itself or shown relative to a range of values.
- [**Legend Alias** menu](https://docs.cloud.google.com/monitoring/charts/working-with-legends#descr_template): Configure the name of a legend column.
### Chart multiple metric types
This feature is available only when you use the menu-driven interface. It
isn't available when you use PromQL or Monitoring filters.
In some situations, you might want to display time series from different
metric types on the same chart. For example, to compare the read and write
loads on a VM, configure a chart to display the number of bytes
read and the number of bytes written.
To chart multiple metrics, you must use the menu-driven interface. The other
interfaces don't support charting multiple metrics.
To display multiple metrics on a chart, do the following:
1. In the Google Cloud console, go to the
**Metrics explorer** page:
[Go to **Metrics explorer**](https://console.cloud.google.com/monitoring/metrics-explorer)
If you use the search bar to find this page, then select the result whose subheading is
**Monitoring**.
2. In the toolbar of the Google Cloud console, select your Google Cloud project. For [App Hub](https://docs.cloud.google.com/app-hub/docs/overview) configurations, select the App Hub host project or management project.
3. Specify the data to display on the chart.
1. In the **Metric** element, select the
first metric type whose data you want to view.
For information about these steps, see
[Chart a single metric type](https://docs.cloud.google.com/monitoring/charts/metrics-explorer#find-me).
The query for this selection has the **A** identifier.
2. For each additional metric type, do the following:
1. Select **Add query** . A new query is added. For example, a query with the label **B** might be added.
2. For the new query, in the **Metric** element, select a resource type and metric type. You can also add filters, combine time series, and sort and limit the number of displayed time series.
The following screenshot illustrates the Metrics Explorer display when
there are two metric types charted:

3. Optional: In the **Display** pane,
expand the **Y-axis** menu and configure which Y-axis is used for
each metric type.
### Chart a ratio of metrics
This feature is available only when you use the menu-driven interface or when
you use PromQL. It isn't available when you use
Monitoring filters.
Monitoring the number of errors reported might be useful; however, it is
more likely that you need to monitor the rate of errors. That is, you
want to know how many errors occurred as measured against the total
number of responses. To meet this requirement, you can configure a chart
to display the ratio of two metrics. For references to examples and for
information about anomalies that can occur when you chart ratios of metrics,
see [Ratios of metrics](https://docs.cloud.google.com/monitoring/charts/metric-ratios).
To display a ratio of metrics on a chart, do the following:
1. In the Google Cloud console, go to the
**Metrics explorer** page:
[Go to **Metrics explorer**](https://console.cloud.google.com/monitoring/metrics-explorer)
If you use the search bar to find this page, then select the result whose subheading is
**Monitoring**.
2. In the toolbar of the Google Cloud console, select your Google Cloud project. For [App Hub](https://docs.cloud.google.com/app-hub/docs/overview) configurations, select the App Hub host project or management project.
3. Specify the data to appear on the chart:
### Menu-driven interface
1. Configure the numerator:
1. In the **Metric** element, use the menus to select a resource type and metric type. For information about these steps, see [Chart a single metric type](https://docs.cloud.google.com/monitoring/charts/metrics-explorer#find-me).
2. Update the aggregation fields. By default, Metrics Explorer averages all time series.
3. Optional: Update the fixed length of time for points within a time series to be combined. To modify this field, click **Add query element** , select **Min Interval**, and complete the dialog.
2. Select **Add query** and then configure the denominator:
1. For the new query, in the **Metric** element, select a resource type and metric type.
Select a metric type whose metric kind is the same as the numerator.
For example, if the numerator metric is a `GAUGE` metric,
then select a `GAUGE` metric for the denominator.
2. Update the aggregation fields.
We recommend that the labels for the denominator metric type match the values
set for the numerator metric type. For example, you might select the
`zone` label for the numerator and denominator.
You aren't required to use the same set of labels for both metric types;
however, you can only select labels that are common to both metric types.
3. Click **Add query element** , select **Min Interval**, and ensure this field is set to the value that is used by the numerator.
3. In the toolbar of the query pane, select **Create ratio**, and then
complete the dialog.
After you create the ratio, three queries are shown:
- **A/B Ratio** identifies the ratio query.
- **A** identifies the query for the numerator.
- **B** identifies the query for the denominator.
The following example illustrates a ratio that compares the sum of
the bytes written to disk per zone, to the total number of bytes
written to disk:

4. Optional: To switch the numerator and denominator metrics, in the
**Ratio** element, expand the menu, and then make a selection.
### PromQL
1. In the toolbar of the query-builder pane, select the button whose name is **PromQL**.
2. Enter your query into the query editor. For example, to chart the ratio of
average latency of your `my_summary_latency_seconds` metric, use the
following query:
```
sum without (instance)(rate(my_summary_latency_seconds_sum[5m])) /
sum without (instance)(rate(my_summary_latency_seconds_count[5m]))
```
For more information about using PromQL,
see [PromQL in Cloud Monitoring](https://docs.cloud.google.com/monitoring/promql).
## Save a chart
After you configure a chart, you might want to save that chart for future
reference or save the data the chart displays. This section describes
these options.
### Save a link to a chart
To keep a reference to the chart configuration, save the chart URL.
Because the chart URL encodes the chart configuration, when you paste this
URL into a browser, the chart you configured is displayed.
To obtain the chart's URL, click **Link** in the chart
toolbar.
### Add your chart to a custom dashboard
Metrics Explorer lets you create a chart that you can use to explore a
metric. However, the charts created by this tool aren't persistent. When you
navigate away from the Metrics Explorer page, the chart is discarded.
To save a chart you've configured with Metrics Explorer for future
reference, add the chart to a custom dashboard or save the chart's URL:
- To add your chart to a custom dashboard, do one of the following:
- If you use the Google Cloud console to manage your custom dashboards,
then select **Save as** in the Metrics Explorer toolbar,
select **Dashboard chart**, and then complete the dialog. You can save
the chart to an existing
custom dashboard or you can create a dashboard.
- If you use the Cloud Monitoring API to manage your custom dashboards,
then update the JSON file that defines the dashboard and its widgets.
The JSON for each widget includes the query the system uses to fetch
the data to display.
To access the JSON representation,
click **JSON Editor** in the chart toolbar.
For detailed information
about using the API to manage your custom dashboards, see
[Create and manage dashboards by API](https://docs.cloud.google.com/monitoring/dashboards/api-dashboard).
### Save the data displayed by the chart
To save the data displayed by the chart to your local system, click
**Download CSV**.
## Create an alerting policy from your chart
You can create an alerting policy to monitor the data you've charted. To create
an alerting policy, do the following:
1. In the toolbar, click **Save as** and select **Alert policy**.
The alerting policy dialog opens with the metric-selection fields populated.
Your alerting policy is configured to notify you when the value of the
monitored data becomes larger than the threshold.
2. Complete the following and then save your policy:
- In the **Configure trigger** section, update the threshold.
- Add notification channels.
- Enter a name for your alerting policy.
## What's next
- [Break down a chart by labels](https://docs.cloud.google.com/monitoring/charts/breakdown-chart-by-labels):
When investigating an issue, use the Metrics Explorer breakdown feature
to determine whether specific resource types or locations are the cause.
Metrics Explorer can break a chart into a series of tiles, each
displaying time-series data for a specific label key. This view helps you
identify spikes, dips, or trends that aggregation might otherwise hide.
- [Explore charted data](https://docs.cloud.google.com/monitoring/charts/working-with-charts): Describes how to use chart
controls to highlight time series, change the chart resolution, show
outliers, and compare current to past data.
- [Select metrics with Metrics Explorer](https://docs.cloud.google.com/monitoring/charts/metrics-selector)
- [View and manage metric usage](https://docs.cloud.google.com/monitoring/docs/metrics-management)
- [Set chart display options](https://docs.cloud.google.com/monitoring/charts/chart-view-options)