Customizing chart display options in Cloud Monitoring lets you highlight
thresholds, identify anomalies, and compare time-series trends across different
scales and time periods. Although Metrics Explorer and dashboards provide
default chart settings, you can override them by setting a time range, adding
reference lines, changing the visual mode, or adjusting the Y-axis scale. You
can also configure charts to [display only outliers](https://docs.cloud.google.com/monitoring/charts/working-with-charts#using-outlier-mode) or
[compare current data to past data](https://docs.cloud.google.com/monitoring/charts/working-with-charts#comparetopast-option).
To isolate spikes or trends by label key in Metrics Explorer, see
[Break down a chart by labels](https://docs.cloud.google.com/monitoring/charts/breakdown-chart-by-labels).
## Set a chart's time range
A chart can display data for periods ranging from one minute to six weeks. If
you don't explicitly set the chart's display period, then it uses the display
period of its parent, which is either Metrics Explorer or a
custom dashboard.
Configure a chart's time-range override when you want that chart to show data
over a longer or shorter time range than is appropriate for other dashboard
widgets. For example, consider these use cases:
- A dashboard displays a quota metric, which has 1 sample per day, and metric
data that is sampled every 60 seconds. The quota-metric chart needs a
time range of at least one day, possibly as long as one week. However, this
time range is too long to view spikes or dips in the metrics that
are sampled every 60 seconds.
- For a metric, you want to view both trends and the current measurements.
Therefore, you add two charts to the dashboard. For one chart, you set
its time-range override to eight days, a bit longer than a week. The other
chart displays one hour of data, which is the dashboard's time-range
setting.
Changing the time range on a chart can result in realignment of the time series.
For conceptual information, see
[Alignment: within-series regularization](https://docs.cloud.google.com/monitoring/api/v3/aggregation#alignment-intro).
### Set the default time range
### Charts on dashboards
The default time range applies to all widgets on a dashboard, except for those
with a time-range override and those whose query includes a specific
time range.
To set the default time range for a dashboard, do the following:
1. In the Google Cloud console, go to the **Dashboards** page:
[Go to **Dashboards**](https://console.cloud.google.com/monitoring/dashboards)
If you use the search bar to find this page, then select the result whose subheading is
**Monitoring**.
2. In the toolbar of the Google Cloud console, select your Google Cloud project. For [App Hub](https://docs.cloud.google.com/app-hub/docs/overview) configurations, select the App Hub host project or management project.
3. Select a custom dashboard.
4. Go to the toolbar and use the time-range selector.
### Metrics Explorer
1. In the Google Cloud console, go to the
**Metrics explorer** page:
[Go to **Metrics explorer**](https://console.cloud.google.com/monitoring/metrics-explorer)
If you use the search bar to find this page, then select the result whose subheading is
**Monitoring**.
2. In the toolbar of the Google Cloud console, select your Google Cloud project. For [App Hub](https://docs.cloud.google.com/app-hub/docs/overview) configurations, select the App Hub host project or management project.
3. Go to the toolbar and use the time-range selector.
### Set a time-range override for a chart or group
### Charts on dashboards
When set, a chart's time-range override determines the display period for the
chart. Suppose that you have a dashboard that displays quota metrics,
which have 1 sample per day, and CPU utilization, which records a sample every
60 seconds. To view trends in your quota usage, you need to set the time
range to at least one week. However, that time range hides spikes in
CPU utilization. To resolve the conflict, set a time-range override for one
of the charts.
If you don't set the chart's time-range override, then the dashboard's
time-range setting determines the display period.
To specify a time range that applies only to a chart, do the following:
1. In the Google Cloud console, go to the **Dashboards** page:
[Go to **Dashboards**](https://console.cloud.google.com/monitoring/dashboards)
If you use the search bar to find this page, then select the result whose subheading is
**Monitoring**.
2. In the toolbar of the Google Cloud console, select your Google Cloud project. For [App Hub](https://docs.cloud.google.com/app-hub/docs/overview) configurations, select the App Hub host project or management project.
3. Select a custom dashboard.
4. Find the chart for which you want to configure a time-range override.
In the chart's toolbar, select **Edit**.
You can select charts that are contained in a grouping widget.
5. In the **Display** pane, expand **Time range override**, and then complete
the dialog. You can specify a relative or absolute time range.
If the **Time range override** option isn't listed, then the widget
doesn't support configuring this field. For example, you can't set this
field for widgets that display the chart associated with an
alerting policy.
6. Click **Apply** or **Save**.
### Metrics Explorer
If you aren't planning to save the chart to a dashboard, then we recommend
using the toolbar to set the chart's time range.
To override the default time range, do the following:
1. In the Google Cloud console, go to the
**Metrics explorer** page:
[Go to **Metrics explorer**](https://console.cloud.google.com/monitoring/metrics-explorer)
If you use the search bar to find this page, then select the result whose subheading is
**Monitoring**.
2. In the toolbar of the Google Cloud console, select your Google Cloud project. For [App Hub](https://docs.cloud.google.com/app-hub/docs/overview) configurations, select the App Hub host project or management project.
3. Select and configure your chart.
4. In the **Display** pane, expand **Time range override**, and then complete the dialog. You can specify a relative or absolute time range.
## Add a reference line
The **Threshold** option creates a horizontal line from a point on the
*Y*-axis. The line provides a visual reference for the chosen threshold value.
You can add a threshold that refers to a value on the left Y-axis or the
right Y-axis.
The following screenshot shows a chart with a threshold line:

In the previous screenshot, the threshold is set to 7500 and refers to the
right Y-axis.
### Charts on dashboards
To add a reference line to a chart, do the following:
1. In the Google Cloud console, go to the **Dashboards** page:
[Go to **Dashboards**](https://console.cloud.google.com/monitoring/dashboards)
If you use the search bar to find this page, then select the result whose subheading is
**Monitoring**.
2. In the toolbar of the Google Cloud console, select your Google Cloud project. For [App Hub](https://docs.cloud.google.com/app-hub/docs/overview) configurations, select the App Hub host project or management project.
3. Select a dashboard.
4. In the chart's toolbar, select **Edit**.
5. In the **Display** pane, select **Threshold**.
6. Optional: To change the Y-axis, click **Y-axis** and select from the menu.
7. Set a value for the threshold in the **Threshold line** field.
### Metrics Explorer
To add a reference line to a chart, do the following:
1. In the Google Cloud console, go to the
**Metrics explorer** page:
[Go to **Metrics explorer**](https://console.cloud.google.com/monitoring/metrics-explorer)
If you use the search bar to find this page, then select the result whose subheading is
**Monitoring**.
2. In the toolbar of the Google Cloud console, select your Google Cloud project. For [App Hub](https://docs.cloud.google.com/app-hub/docs/overview) configurations, select the App Hub host project or management project.
3. Select a resource type and metric type to chart.
4. In the chart's **Display** pane, expand **Threshold Line** , select **Add threshold**, and then complete the dialog.
## Set X-ray, color, or statistics mode
### Charts on dashboards
A chart's widget type and its chart mode setting determine how the chart
displays data. For example, when you create a line chart, each time series
is shown by a line with a unique color. However,
you can configure a line chart to display statistical measures such as the
mean and moving average.
There are three chart modes:
- Color mode: Displays each time series with a unique color.
- Stats mode: Displays common statistical measures for the data in a chart.
- X-ray mode: Displays each time series with a translucent gray color. Each line is faint, and where lines overlap or cross, the points appear brighter. Therefore, this mode is most useful on charts with many lines. Overlapping lines create bands of brightness, which indicate the normal behavior within a metrics group.
You can permanently change the mode of line charts. You can temporarily
change the mode of line, stacked area, stacked bar, and heatmap charts.
To temporarily change the mode of a chart, do the following:
1. In the Google Cloud console, go to the **Dashboards** page:
[Go to **Dashboards**](https://console.cloud.google.com/monitoring/dashboards)
If you use the search bar to find this page, then select the result whose subheading is
**Monitoring**.
2. In the toolbar of the Google Cloud console, select your Google Cloud project. For [App Hub](https://docs.cloud.google.com/app-hub/docs/overview) configurations, select the App Hub host project or management project.
3. Select a dashboard.
4. In the chart's toolbar, click **More options**,
and then make a selection from the menu.
Your changes are discarded when the dashboard is reloaded.
To permanently change the mode of a line chart, do the following:
1. In the Google Cloud console, go to the **Dashboards** page:
[Go to **Dashboards**](https://console.cloud.google.com/monitoring/dashboards)
If you use the search bar to find this page, then select the result whose subheading is
**Monitoring**.
2. In the toolbar of the Google Cloud console, select your Google Cloud project. For [App Hub](https://docs.cloud.google.com/app-hub/docs/overview) configurations, select the App Hub host project or management project.
3. Select a dashboard.
4. In the chart's toolbar, select **Edit**.
5. In the **Display** pane, click **Chart mode**, and then make a selection from the menu.
### Metrics Explorer
A chart's widget type and its analysis mode setting determine how the chart
displays data. For example, when you create a line chart, each time series
is shown by a line with a unique color. However,
you can configure a line chart to display statistical measures such as the
mean and moving average.
There are three analysis modes:
- Standard mode: Displays each time series with a unique color.
- Stats mode: Displays common statistical measures for the data in a chart.
- X-ray mode: Displays each time series with a translucent gray color. Each line is faint, and where lines overlap or cross, the points appear brighter. Therefore, this mode is most useful on charts with many lines. Overlapping lines create bands of brightness, which indicate the normal behavior within a metrics group.
To change the analysis mode of a line chart, do the following:
1. In the Google Cloud console, go to the
**Metrics explorer** page:
[Go to **Metrics explorer**](https://console.cloud.google.com/monitoring/metrics-explorer)
If you use the search bar to find this page, then select the result whose subheading is
**Monitoring**.
2. In the toolbar of the Google Cloud console, select your Google Cloud project. For [App Hub](https://docs.cloud.google.com/app-hub/docs/overview) configurations, select the App Hub host project or management project.
3. Select a resource type and metric type to chart.
4. In the chart's **Display** pane, expand **Analysis mode**, and then make a selection from the menu.
### Examples
The following screenshot shows a chart in color mode:

The following screenshot shows the previous chart but in statistics mode:

When you select statistics mode, the chart legend displays statistical
measures such as the mean and standard deviation.
The following screenshot shows a chart in X-ray mode:

X-ray mode highlights central tendencies and outliers in dense graphs.
For example, consider a cluster of machines that are serving the
same data. If you view the CPU utilization across the cluster,
then you would expect to see a band around the cluster's average CPU
utilization. That band shows how the average ranges and can indicate whether
the cluster is over- or under-provisioned. You can also use X-ray mode to
identify servers that are not operating optimally.
## Set the *Y*-axis to the log scale
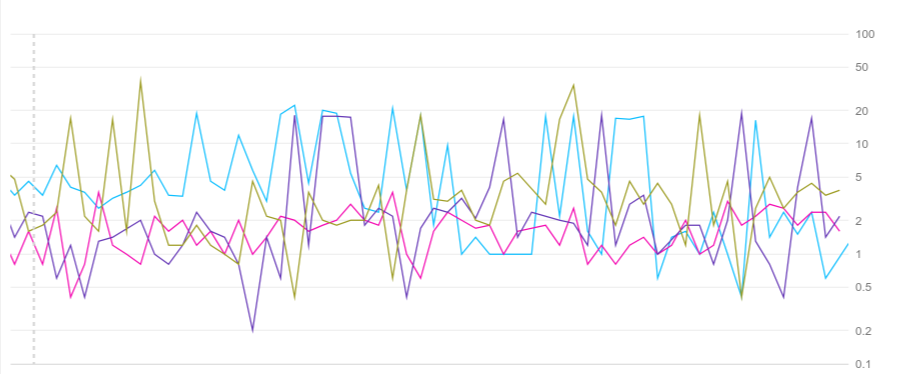
The **Log scale on Y-axis** option rescales the chart's *Y*-values
logarithmically. You can scale the left Y-axis, the right Y-axis, or both
axes. This rescaling is useful when values cluster tightly
within a small range. Select the checkbox to enable this option, and
clear the checkbox to disable it.
The following screenshots show the same chart with the default *Y* -axis
and with a log-scaled *Y*-axis.
**Default Y-axis:**

**Log-scaled Y-axis:**
### Charts on dashboards
To set the *Y*-axis to the log scale, do the following:
1. In the Google Cloud console, go to the **Dashboards** page:
[Go to **Dashboards**](https://console.cloud.google.com/monitoring/dashboards)
If you use the search bar to find this page, then select the result whose subheading is
**Monitoring**.
2. In the toolbar of the Google Cloud console, select your Google Cloud project. For [App Hub](https://docs.cloud.google.com/app-hub/docs/overview) configurations, select the App Hub host project or management project.
3. Select a dashboard.
4. In the chart's toolbar, select **Edit**.
5. In the **Display** pane, select **Log scale on Y-axis**.
### Metrics Explorer
To set the *Y*-axis to the log scale, do the following:
1. In the Google Cloud console, go to the
**Metrics explorer** page:
[Go to **Metrics explorer**](https://console.cloud.google.com/monitoring/metrics-explorer)
If you use the search bar to find this page, then select the result whose subheading is
**Monitoring**.
2. In the toolbar of the Google Cloud console, select your Google Cloud project. For [App Hub](https://docs.cloud.google.com/app-hub/docs/overview) configurations, select the App Hub host project or management project.
3. Select a resource type and metric type to chart.
4. In the chart's **Display** pane, expand **Scale** , and then select **Log scale on Y-axis**. There are different options available for the left and right axes.
## Configure API mode
### Charts on dashboards
To view a widget's configuration as described by the
Cloud Monitoring API, click **Show API Mode in Configuration**.
When selected, a tab labeled **API** is available on the configuration pane
for every widget on the dashboard. API mode can be useful when you manage your
dashboards through the Google Cloud console and the Cloud Monitoring API.
### Metrics Explorer
Not available.
## What's next
- [Select metrics for a chart](https://docs.cloud.google.com/monitoring/charts/metrics-selector)
- [Add charts and tables to a custom dashboard](https://docs.cloud.google.com/monitoring/charts)
- [Configure legends](https://docs.cloud.google.com/monitoring/charts/working-with-legends)