Metric-threshold alerting policies in Cloud Monitoring send notifications
when metric values cross a threshold that you define for a specified
[retest window](https://docs.cloud.google.com/monitoring/alerts/concepts-indepth.md.txt#duration). For example, you can configure an alerting policy to
create an alert when CPU utilization exceeds 80% for at least five
minutes.
[Video](https://www.youtube.com/watch?v=QMyS-upk9ZU)
This content does not apply to log-based alerting policies.
For information about log-based alerting policies, which notify you when a
particular message appears in your logs, see
[Monitoring your logs](https://docs.cloud.google.com/logging/docs/alerting/monitoring-logs.md.txt).
To receive notifications when data stops arriving or when a metric is predicted to violate a threshold, see [Create metric-absence alerting policies](https://docs.cloud.google.com/monitoring/alerts/metric-absence.md.txt) and [Create forecasted metric-value alerting policies](https://docs.cloud.google.com/monitoring/alerts/metric-forecast.md.txt). To create alerting policies programmatically by using the Cloud Monitoring API, see [Create alerting policies by using the API](https://docs.cloud.google.com/monitoring/alerts/policies-in-api.md.txt). To create alerting policies that use Monitoring Query Language (MQL) queries with static or dynamic thresholds, see [Alerting policies with MQL](https://docs.cloud.google.com/monitoring/mql/alerts.md.txt) and [Create dynamic severity levels using MQL](https://docs.cloud.google.com/monitoring/alerts/labels.md.txt#example-dynamic-label).
This feature is supported only for Google Cloud projects.
For [App Hub](https://docs.cloud.google.com/app-hub/docs/overview.md.txt)
configurations, select the App Hub host project or management project.
## Before you begin
1.
To get the permissions that
you need to create and modify alerting policies by using the Google Cloud console,
ask your administrator to grant you the
[Monitoring Editor](https://docs.cloud.google.com/iam/docs/roles-permissions/monitoring.md.txt#monitoring.editor) (`roles/monitoring.editor`) IAM role on your project.
For more information about granting roles, see [Manage access to projects, folders, and organizations](https://docs.cloud.google.com/iam/docs/granting-changing-revoking-access.md.txt).
You might also be able to get
the required permissions through [custom
roles](https://docs.cloud.google.com/iam/docs/creating-custom-roles) or other [predefined
roles](https://docs.cloud.google.com/iam/docs/roles-overview#predefined).
For more information about Cloud Monitoring roles,
see [Control access with Identity and Access Management](https://docs.cloud.google.com/monitoring/access-control.md.txt).
2. Ensure that you're familiar with the general concepts of alerting policies.
For information about these topics, see
[Alerting overview](https://docs.cloud.google.com/monitoring/alerts.md.txt).
3. Configure the notification channels that you want to use to receive any
notifications. For redundancy purposes, we recommend that you create
multiple types of notification channels. For more information, see
[Create and manage notification channels](https://docs.cloud.google.com/monitoring/support/notification-options.md.txt).
## Create alerting policy
To create an alerting policy that compares the value of that metric to a static
threshold, do the following:
1. In the Google Cloud console, go to the
**Alerting** page:
[Go to **Alerting**](https://console.cloud.google.com/monitoring/alerting)
If you use the search bar to find this page, then select the result whose subheading is
**Monitoring**.
2. In the toolbar of the Google Cloud console, select your Google Cloud project. For [App Hub](https://docs.cloud.google.com/app-hub/docs/overview.md.txt) configurations, select the App Hub host project or management project.
3. Select **Create policy**.
4. Select the time series to be monitored:
1. Click **Select a metric** , navigate through the menus to select a
resource type and metric type, and then click **Apply**.
The **Select a metric** menu contains features that help you find
the metric types available:
- To find a specific metric type, use the **Filter bar** . For example, if you by enter `util`, then you restrict the menu to show entries that include `util`. Entries are shown when they pass a case-insensitive "contains" test.
- To show all metric types, even those without data, click **Active** . By default, the menus only show metric types with data. For more information, see [Metric not listed in menu](https://docs.cloud.google.com/monitoring/alerts/using-alerting-ui.md.txt#not-listed).
You can monitor any [built-in metric](https://docs.cloud.google.com/monitoring/api/metrics.md.txt) or any user-defined
metric.
2. Optional: To monitor a subset of the time series that match the
metric and resource types you selected in the previous step,
click **Add filter** . In the filter dialog, select the label by
which to filter, a comparator, and then the filter value.
For example, the filter `zone =~ ^us.*.a$` uses a regular expression to
match all time-series data whose zone name starts with `us` and ends
with `a`. For more information, see
[Filter the selected time series](https://docs.cloud.google.com/monitoring/alerts/using-alerting-ui.md.txt#filter-option).
3. Optional: To change how points in a time series are aligned, in the
**Transform data** section, set the **Rolling window** and
**Rolling window function** fields. For example, a 15-minute window
with `max` outputs the maximum value from the most recent 15 minutes.
The Google Cloud console sets default values based on your metric
type. If you monitor a log-based metric, then set the **Rolling window**
field to at least 10 minutes.
If you select `count` or `mean` for the **Rolling window function** ,
then verify that the function matches your metric kind. The
`count` function counts data points, not their values, and the `mean`
function averages per-sample changes on `DELTA` metrics. To alert on
total volume or rate for a `DELTA` metric, select `sum`, `delta`, or
`rate` instead. For supported metric kinds and value types, see
[`Aligner`](https://docs.cloud.google.com/monitoring/api/ref_v3/rest/v3/projects.alertPolicies.md.txt#Aligner).
You can also monitor the rate at which a metric value changes
by using the **Rolling window function** field to **percent change** .
For more information, see [Monitor a rate of change](https://docs.cloud.google.com/monitoring/alerts/using-alerting-ui.md.txt#rate-of-change).
For more information, see
[Alignment: within-series regularization](https://docs.cloud.google.com/monitoring/api/v3/aggregation.md.txt#alignment-intro)
4. Optional: Combine time series when you want to reduce the number of
time series monitored by a policy, or when you want to monitor only
a collection of time series. For example, instead of monitoring the
CPU utilization of each VM instance, you might want to compute the
average of the CPU utilization for all VMs in a zone, and then
monitor that average. By default,
time series aren't combined. For general information, see
[Reduction: combining time series](https://docs.cloud.google.com/monitoring/api/v3/aggregation.md.txt#reduction-intro).
To combine all time series, do the following:
1. In the **Across time series** section, click **Expand**.
2. Set the **Time series aggregation** field to a value other than `none`. For example, to display the average value of the time series, select `mean`.
3. Ensure that the **Time series group by** field is empty.
To combine, or group, time series by label values, do the following:
1. In the **Across time series** section, click **Expand**.
2. Set the **Time series aggregation** field to a value other than `none`.
3. In the **Time series group by** field, select the labels by which to group.
For example, if you group by the `zone` label and then set the
aggregation field to a value of `mean`, then the chart displays
one time series for each zone for which there is data. The
time series shown for a specific zone is the average of all time series
with that zone.
> [!NOTE]
> **Note:** To delete a grouping, clear the **Time series group by** field and set the **Time series aggregation** field to `none`.
5. Click **Next**.
5. Configure the condition trigger:
1. Leave the **Condition type** field at the default value of
**Threshold**.
2. Optional: Update the **Alert trigger** menu, which
has the following values:
- **Any time series violates**: Default setting. Any time series
violating the threshold for the entire retest window
causes the condition to be met.
- **Percent of time series violates**: A percentage of time series
must violate the threshold for the entire retest window
before the condition is met. For example,
you could be notified when 50% of the monitored time series violate
the threshold for the entire retest window.
- **Number of time series violates**: A specific number of time series
must violate the threshold for the entire retest window
before the condition is met. For
example, you could be notified when 32 of the monitored
time series violate the threshold for the entire retest window.
- **All time series violate**: All time series must violate the
threshold for the entire retest window before the condition is met.
For information about the intervals that Monitoring
uses to align and measure time series data, see
[Alignment periods and retest windows](https://docs.cloud.google.com/monitoring/alerts/concepts-indepth.md.txt#duration).
3. Enter when the value of a metric violates the threshold by using the
**Threshold position** and **Threshold value** fields. For example,
if you set these values to **Above threshold** and `0.3`, then any
measurement higher than `0.3` violates the threshold.
4. Optional: To select how long measurements must violate the threshold
before Monitoring sends a notification, expand
**Advanced options** and then use the **Retest window** menu.
The default value is **No retest** . With this setting, a single
measurement can result in a notification. For more information and
an example, see
[Alignment period and duration settings](https://docs.cloud.google.com/monitoring/alerts/concepts-indepth.md.txt#duration).
5. Optional: To specify how Monitoring evaluates the
condition when data stops arriving, expand
**Advanced options** , and then use the **Evaluation missing data**
menu.
The **Evaluation missing data** menu is disabled when the value of the
**Retest window** is **No retest**.
| Google Cloud console "Evaluation of missing data" field | Summary | Details |
|---|---|---|
| **Missing data empty** | Open alerts stay open. New alerts aren't opened. | For conditions that are met, the condition continues to be met when data stops arriving. If an alert is open for this condition, then the alert stays open. When an alert is open and no data arrives, the auto-close timer starts after a delay of at least 15 minutes. If the timer expires, then the alert is closed. For conditions that aren't met, the condition continues to not be met when data stops arriving. |
| **Missing data points treated as values that violate the policy condition** | Open alerts stay open. New alerts can be opened. | For conditions that are met, the condition continues to be met when data stops arriving. If an alert is open for this condition, then the alert stays open. When an alert is open and no data arrives for the auto-close duration plus 24 hours, the alert is closed. For conditions that aren't met, this setting causes the metric-threshold condition to behave like a [`metric-absence condition`](https://docs.cloud.google.com/monitoring/alerts/metric-absence.md.txt). If data doesn't arrive in the time specified by the retest window, then the condition is evaluated as met. For an alerting policy with one condition, the condition being met results in an alert being opened. |
| **Missing data points treated as values that don't violate the policy condition** | Open alerts are closed. New alerts aren't opened. | For conditions that are met, the condition stops being met when data stops arriving. If an alert is open for this condition, then the alert is closed. For conditions that aren't met, the condition continues to not be met when data stops arriving. |
6. Click **Next**.
6. Optional: Create an alerting policy with multiple conditions.
Most policies monitor a single metric type, for example, a policy might
monitor the number of bytes written to a VM instance. When you want
to monitor multiple metric types, create a policy with multiple conditions.
Each condition monitors one metric type. After you create the conditions,
you specify how the conditions are combined. For information, see
[Policies with multiple conditions](https://docs.cloud.google.com/monitoring/alerts/concepts-indepth.md.txt#condition-combiners).
To create an alerting policy with multiple conditions, do the following:
1. For each additional condition, click **Add alert condition** and then configure that condition.
2. Click **Next** and configure how conditions are combined.
3. Click **Next** to advance to the notifications and documentation set up.
7. Configure the notification and add user labels:
1. Expand the **Notifications and name** menu and select your notification
channels. For redundancy purposes, we recommend that you add to an
alerting policy multiple types of notification channels.
For more information, see [Manage notification channels](https://docs.cloud.google.com/monitoring/support/notification-options.md.txt).
2. Optional: To use a custom subject line in your notification instead of
the default, update the **Notification subject line** field.
3. Optional: To be notified when an alert is closed, select
**Notify on alert closure**.
By default, when you create an alerting policy with the
Google Cloud console, a notification is sent only when an alert
is created.
4. Optional: To change how long Monitoring waits before
closing an alert after data stops arriving, select an option
from the **Alert autoclose duration** menu. By default, when data
stops arriving, Monitoring waits
seven days before closing an open
alert.
5. Optional: To associate your alerting policy with an
[App Hub](https://docs.cloud.google.com/app-hub/docs/overview.md.txt) application, in the **Application labels**
section, select an application and either a service or workload.
Alerts and notifications display these labels.
6. Optional: Select an option from the **Policy severity level** menu.
Alerts and notifications display the severity level.
7. Optional: To add custom labels to the alerting policy, in the
**Policy user labels** section, do the following:
1. Click **Add label** , and in the **Key** field enter a name for the label. Label names must start with a lowercase letter, and they can contain lowercase letters, numerals, underscores, and dashes. For example, enter `severity`.
2. Click **Value** and enter a value for your label. Label values can contain lowercase letters, numerals, underscores, and dashes. For example, enter `critical`.
For information about how you can use policy labels to help you manage
your notifications, see
[Annotate alerts with labels](https://docs.cloud.google.com/monitoring/alerts/labels.md.txt).
8. Optional: In the **Documentation** section, enter any content that you want
included with the notification.
To format your documentation, you can use plain text,
Markdown, and [variables](https://docs.cloud.google.com/monitoring/alerts/doc-variables.md.txt#doc-vars). You can also
include links to help users debug the alert, such
as links to internal playbooks, Google Cloud dashboards, and external
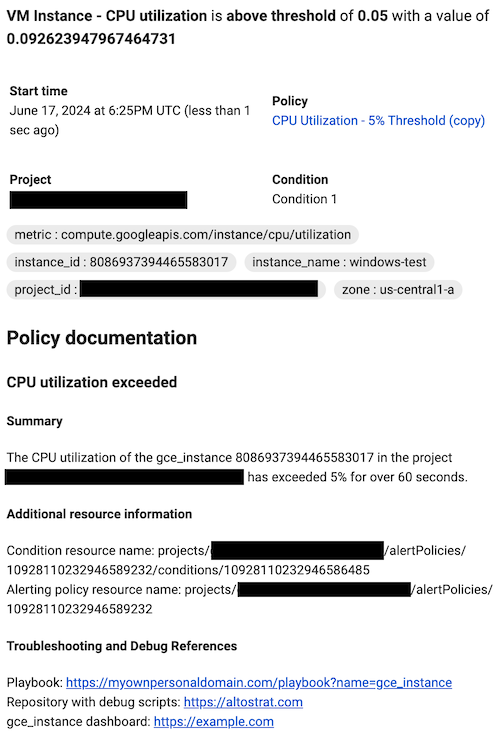
pages. For example, the following documentation template describes a CPU
utilization alert for a `gce_instance` resource and includes
several variables to reference the alerting policy and condition REST
resources. The documentation template
then directs readers to external pages to help with debugging.
When notifications are created, Monitoring replaces
the documentation variables with their values.
The values replace the variables only in notifications. The
preview pane and other places in the Google Cloud console
show only the Markdown formatting.
### Preview
```
## CPU utilization exceeded
### Summary
The ${metric.display_name} of the ${resource.type}
${resource.label.instance_id} in the project ${resource.project} has
exceeded 90% for over 15 minutes.
### Additional resource information
Condition resource name: ${condition.name}
Alerting policy resource name: ${policy.name}
### Troubleshooting and Debug References
Repository with debug scripts: example.com
Internal troubleshooting guide: example.com
${resource.type} dashboard: example.com
```
### Format in notification
For more information, see
[Annotate notifications with user-defined documentation](https://docs.cloud.google.com/monitoring/alerts/doc-variables.md.txt)
and [Using channel controls](https://docs.cloud.google.com/monitoring/alerts/doc-variables.md.txt#channel-docs).
9. Click **Alert name** and enter a name for the alerting policy.
10. Click **Create policy**.
## Filter the selected time series
Filters ensure that only time series that meet some set of criteria are
monitored.
When you apply filters, you might reduce the number of lines on the chart,
which can improve the performance of the chart. You can also reduce the
amount of data being monitored by applying aggregation.
Filters ensure that only time series that meet some set of criteria are used.
When you apply filters, there are fewer time series to evaluate, which can
improve the performance of the alert.
A filter is composed of a label, a comparator, and a value. For example,
to match all time series whose `zone` label starts with `"us-central1"`, you
could use the filter `zone=~"us-central1.*"`, which uses a regular expression
to perform the comparison.
When you filter by the project ID or the resource container,
you must use the equals operator, `(=)`. When you filter by
other labels, you can use any supported comparator.
Typically, you can filter metric and resource labels, and by
[resource group](https://docs.cloud.google.com/monitoring/groups.md.txt).
When you supply multiple filtering criteria,
only the time series that meet *all* criteria are monitored.
To add a filter, click **Add filter** , complete the dialog, and then click
**Done** . In the dialog, you use the **Filter** field to select the
criterion by which to filter, select the comparison operator, and then
select or input the value. The drop-down menu only lists values that appear over
the last week, but you can input any value. Each row in the following table
lists a comparison operator, its meaning, and an example:
| Operator | Meaning | Example |
|---|---|---|
| `=` | Equality | `resource.labels.zone = "us-central1-a"` |
| `!=` | Inequality | `resource.labels.zone != "us-central1-a"` |
| `=~` | [Regular expression2](https://github.com/google/re2/wiki/Syntax) equality | `monitoring.regex.full_match("^us.*")` |
| `!=~` | [Regular expression2](https://github.com/google/re2/wiki/Syntax) inequality | `monitoring.regex.full_match("^us.*")` |
| `starts_with` | Value starts with | `resource.labels.zone = starts_with("us")` |
| `ends_with` | Value ends with | `resource.labels.zone = ends_with("b")` |
| `has_substring` | Value contains | `resource.labels.zone = has_substring("east")` |
| `one_of` | One of | `resource.labels.zone = one_of("asia-east1-b", "europe-north1-a")` |
| `!starts_with` | Value doesn't start with | `resource.labels.zone != starts_with("us")` |
| `!ends_with` | Value doesn't ends with | `resource.labels.zone != ends_with("b")` |
| `!has_substring` | Value doesn't contain | `resource.labels.zone != has_substring("east")` |
| `!one_of` | Value isn't one of | `resource.labels.zone != one_of("asia-east1-b", "europe-north1-a")` |
## Troubleshoot
This section contains troubleshooting tips.
### Metric not listed in menu of available metrics
To monitor a metric that isn't listed in the **Select a metric** menu, do
one of the following:
- To create an alerting policy that monitors a Google Cloud metric,
expand the **Select a metric** menu and then
click **Active**.
When disabled, the menu lists all metrics for
Google Cloud services, and all metrics with data.
- To configure a condition for a custom metric type before that metric
type generates data, you must specify the metric type by using a
Monitoring filter:
1. Select **?** on the **Select metric** section header and then select **Direct filter mode** in the tooltip.
2. Enter a monitoring filter or a time series selector.
For information about syntax, see the following documents:
- [Monitoring filters](https://docs.cloud.google.com/monitoring/api/v3/filters.md.txt)
- [Retrieving SLO data](https://docs.cloud.google.com/stackdriver/docs/solutions/slo-monitoring/api/timeseries-selectors.md.txt)
- [Process-health filters](https://docs.cloud.google.com/monitoring/api/v3/process-health-filters.md.txt)
### Monitor a rate of change
To monitor the rate of change of a metric value, set the
**Rolling window function** field to **percent change**.
When the condition is evaluated, Monitoring calculates the
rate of change of the metric as a percentage, and then compares that percentage
to the condition's threshold. This comparison process follows two steps:
1. If the time series has a `DELTA` or `CUMULATIVE` metric kind, then the time series is converted to one that has a `GAUGE` metric kind. For information about the conversion, see [Kinds, types, and conversions](https://docs.cloud.google.com/monitoring/api/v3/aggregation.md.txt#ts-conversion).
2. Monitoring computes the percentage changed by comparing the average value in the most recent 10-minute sliding window to the average value from the 10-minute sliding window before the beginning of the alignment period.
You can't change the 10-minute sliding window used for comparisons in
a rate-of-change alerting policy.
However, you do specify the alignment period when you create the condition.
## What's next
- To create a policy that compares the value of a time series to a dynamic threshold, you must use MQL. For more information, see [Create dynamic severity levels using MQL](https://docs.cloud.google.com/monitoring/alerts/labels.md.txt#example-dynamic-label).
- To learn how to control access to your alerting policies with Tags, see [Use Tags to control access to resources](https://docs.cloud.google.com/monitoring/docs/access-control-with-tags.md.txt).
- The instructions on this page apply to any alerting policy. The following
documents provide guidance for specific configurations:
- [Monitor a ratio of metric values](https://docs.cloud.google.com/monitoring/charts/metric-ratios.md.txt)
- [Monitor a dynamic resource group](https://docs.cloud.google.com/monitoring/alerts/monitor-resource-group.md.txt)
- [Monitor the count of processes on a VM](https://docs.cloud.google.com/monitoring/alerts/monitor-process-count.md.txt)
- [Monitor a microservice](https://docs.cloud.google.com/monitoring/slo-monitoring.md.txt)
- [Monitor your logs](https://docs.cloud.google.com/logging/docs/alerting/monitoring-logs.md.txt)