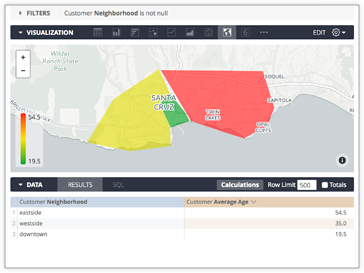
Looker includes several built-in [map layers](https://docs.cloud.google.com/looker/docs/reference/param-model-map-layer.md.txt#built-in_map_layers), but you can also define custom map regions to display geographical data. Suppose you have a table of average ages for three neighborhoods, as follows:
| Customer Neighborhood | Customer Average Age |
|---|---|
| downtown | 19.5292 |
| eastside | 54.4626 |
| westside | 34.9534 |
You might want to map **Customer Neighborhood** to a particular geographic
region, so it can be visualized on a map. To accomplish this, follow the
steps described on this page.
## Prepare region data
To prepare the region data, you need a data file that contains the geographic
shapes of each region and also contains metadata that associates the region with
the data in the database.
Looker uses a format called
[TopoJSON](https://github.com/topojson/topojson) to store this data
in a compact way. TopoJSON files can be easily created from many common shapefile
formats, or you can draw one yourself with online tools, as detailed in the
[Converting shapefiles to TopoJSON](https://discuss.google.dev/t/converting-shapefiles-to-topojson/119394) Community post.
For the purposes of this example, there would already be a TopoJSON file prepared that provides this mapping. Each region in the TopoJSON file has a property called `neighborhood` that matches the values of the
**Customer Neighborhood** field, which is defined in the LookML project as a dimension called `neighborhood`.
## Upload region data
To import the region data into Looker, you can drag and drop the TopoJSON file into the **File Browser** section of the project. This data will be committed alongside the LookML code and updated like any other code in a LookML project.
Your browser does not support the embedded video.
## Create the map layer
Now that you have the region data in the project, you need to create a map layer in the LookML model.
You can add a definition in the model file using the [`map_layer`](https://docs.cloud.google.com/looker/docs/reference/param-model-map-layer.md.txt) parameter:
```
map_layer: my_neighborhood_layer {
file: "neighborhoods.topojson"
property_key: "neighborhood"
}
```
The `file` parameter references the name of the file in the project that contains the region data, and the `property_key` is the property of the dataset that you want to expose within Looker. If you're not sure what the key is, simply omit the property key and Looker will attempt to select the appropriate key.
> **Tip:** You can also use a TopoJSON file that's hosted elsewhere online, by specifying `url` instead of `file` in the layer definition:
```
map_layer: my_neighborhood_layer {
url: "https://raw.githubusercontent.com/cooluser/JSON_Stuff/master/Neighborhoods.topoJSON"
property_key: "neighborhood"
}
```
## Associate the map layer with data
The only thing left to do is to associate the dimension `neighborhood` in the view with the newly created map layer by applying the [`map_layer_name`](https://docs.cloud.google.com/looker/docs/reference/param-field-map-layer-name.md.txt) parameter.
```
dimension: neighborhood {
sql: ${TABLE}.neighborhood ;;
map_layer_name: my_neighborhood_layer
}
```
This tells Looker that the values of this dimension are associated with the `property_key` exposed by the map layer. It also lets Looker know that it's possible to display this data on a map.
## Viewing the map
The queries that use the `neighborhood` dimension can now be displayed on a map from the Explore page: