> [!NOTE]
> **Note:** This page is part of the [Looker cookbook: Getting the most out of Looker visualizations](https://docs.cloud.google.com/looker/docs/best-practices/cookbook-visualizations-in-looker.md.txt).
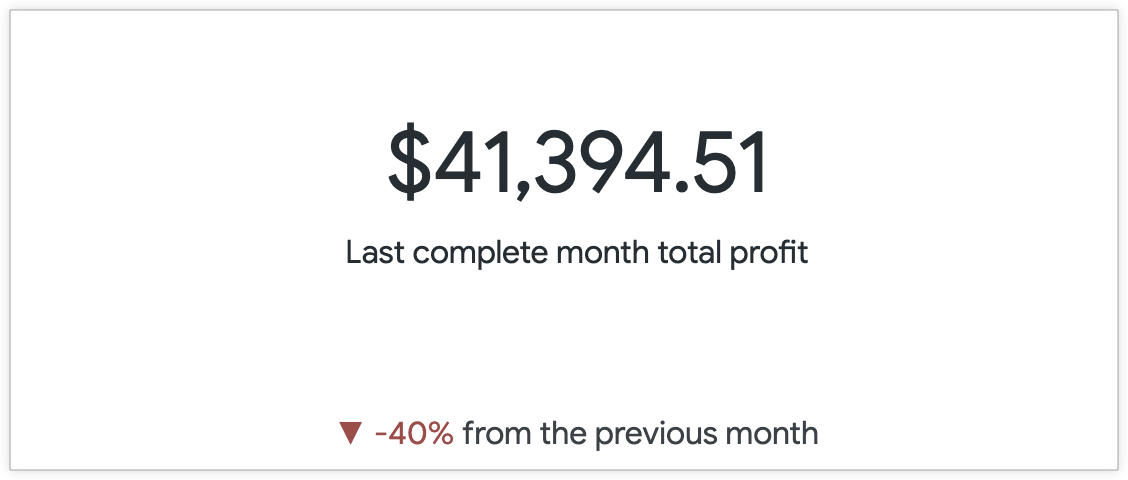
Presenting information clearly and concisely lets users quickly understand how a single data point relates to larger trends --- or how it compares to other values --- without needing to spend additional time searching for context. For example, the following visualization from the [Showing a single value compared to other values](https://docs.cloud.google.com/looker/docs/best-practices/cookbook-visualizations-single-value-vis.md.txt#example_showing_a_single_value_compared_to_other_values) section on this page helps users understand how a value compares to other values:
This cookbook will help you understand how to create a visualization that presents a single data point with as much context as possible.
> [!TIP]
> **Tip:** The KPI (Single Value) chart type replaces the Single Value chart type, unless your admin has enabled the **Use Legacy Single Value Visualization** setting in the [**Legacy features** page of the **Admin** panel](https://docs.cloud.google.com/looker/docs/legacy-feature-schedule.md.txt#use-single-value-visualization). You can use built-in KPI (Single Value) chart options to configure a primary metric and secondary visualizations, such as sparklines or progress bars. The KPI (Single Value) chart helps you display trends over time and configure comparisons against other values in your query to evaluate performance. [Learn more about KPI (Single Value) charts](https://docs.cloud.google.com/looker/docs/kpi-single-value-options.md.txt).
The following examples are included on this page:
- [Showing a single value compared to other values](https://docs.cloud.google.com/looker/docs/best-practices/cookbook-visualizations-single-value-vis.md.txt#example_showing_a_single_value_compared_to_other_values)
- [Adding conditional formatting for more context](https://docs.cloud.google.com/looker/docs/best-practices/cookbook-visualizations-single-value-vis.md.txt#adding_conditional_formatting_for_more_context)
- [Showing a single value in the context of progress toward a goal](https://docs.cloud.google.com/looker/docs/best-practices/cookbook-visualizations-single-value-vis.md.txt#example_showing_a_single_value_in_the_context_of_progress_toward_a_goal)
## Ingredients
- Explore query
- [Single value visualization](https://docs.cloud.google.com/looker/docs/visualization-guide.md.txt#single_value)
- [Table calculations](https://docs.cloud.google.com/looker/docs/table-calculations.md.txt)
The examples on this page use table calculations.
- [Excel spreadsheet-style value formatting](https://support.microsoft.com/en-us/office/review-guidelines-for-customizing-a-number-format-c0a1d1fa-d3f4-4018-96b7-9c9354dd99f5?ui=en-us&rs=en-us&ad=us) (for formatting values as desired)
## Prerequisites
Creating a single value visualization requires the following:
- Permissions to [create Explores](https://docs.cloud.google.com/looker/docs/admin-panel-users-roles.md.txt#explore)
- Optionally, permissions to [create table calculations](https://docs.cloud.google.com/looker/docs/admin-panel-users-roles.md.txt#create_table_calculations) and [custom fields](https://docs.cloud.google.com/looker/docs/admin-panel-users-roles.md.txt#create_custom_fields). Table calculations and custom fields let you create ad hoc metrics on your data, which is helpful when you do not have fields that convey the information you need.
- Familiarity with [Exploring data](https://docs.cloud.google.com/looker/docs/creating-and-editing-explores.md.txt)
- Permissions to [save content](https://docs.cloud.google.com/looker/docs/admin-panel-users-roles.md.txt#save_content) (if you would like to save the visualization as a Look or a dashboard)
## Things to consider when using single value visualizations
When creating and using single value visualizations, make sure to consider the following:
- When viewing several single value visualizations on a dashboard, each visualization defaults to using the same font size for a consistent appearance. However, single value visualizations automatically resize fonts when a tile size is reduced. If the font for a visualization cannot show the entire value in the space available, then the value is truncated by an ellipsis (...).
- If the [**Smart Single Value Text Size** feature](https://docs.cloud.google.com/looker/docs/admin-panel-general-settings.md.txt#smart_single_value_text_size) is enabled, the fonts on single value visualizations displayed in dashboard tiles automatically resize to display at least 8-10 value characters within the tile at any given size.
- The font can only be changed for embedded content when [specified by a Looker admin in a custom theme](https://docs.cloud.google.com/looker/docs/themes-for-embedded-dashboards-and-explores.md.txt).
- The font size cannot be customized from the visualization **Edit** menu. The only ways to customize the font style and font size of values is to do one of the following workarounds at your own risk:
- Add an `html` parameter to the field's LookML definition and specify the font and size settings using HTML style tags. For example: `html: `{{ value }}`
;;`
- Use the scatterplot chart method described in the [Edit font size in a single value viz](https://discuss.google.dev/t/jank-workaround-edit-font-size-in-single-value-vis/112368) Community post.
When several single value visualizations are displayed on a dashboard, the font size may still be affected by the considerations described in the first bullet in this list.
## Example: Showing a single value compared to other values
A vanity metric on its own provides little value to users. However, adding a comparison to a prior data point can quickly add perspective and context for a user.
For example, the following query displays **Total Profit** grouped by **Created Month** for the past 12 months. The single value visualization by default only displays the top row value of the **Total Profit** measure, which is $41,394.51 for the last complete month, December (2019-12).
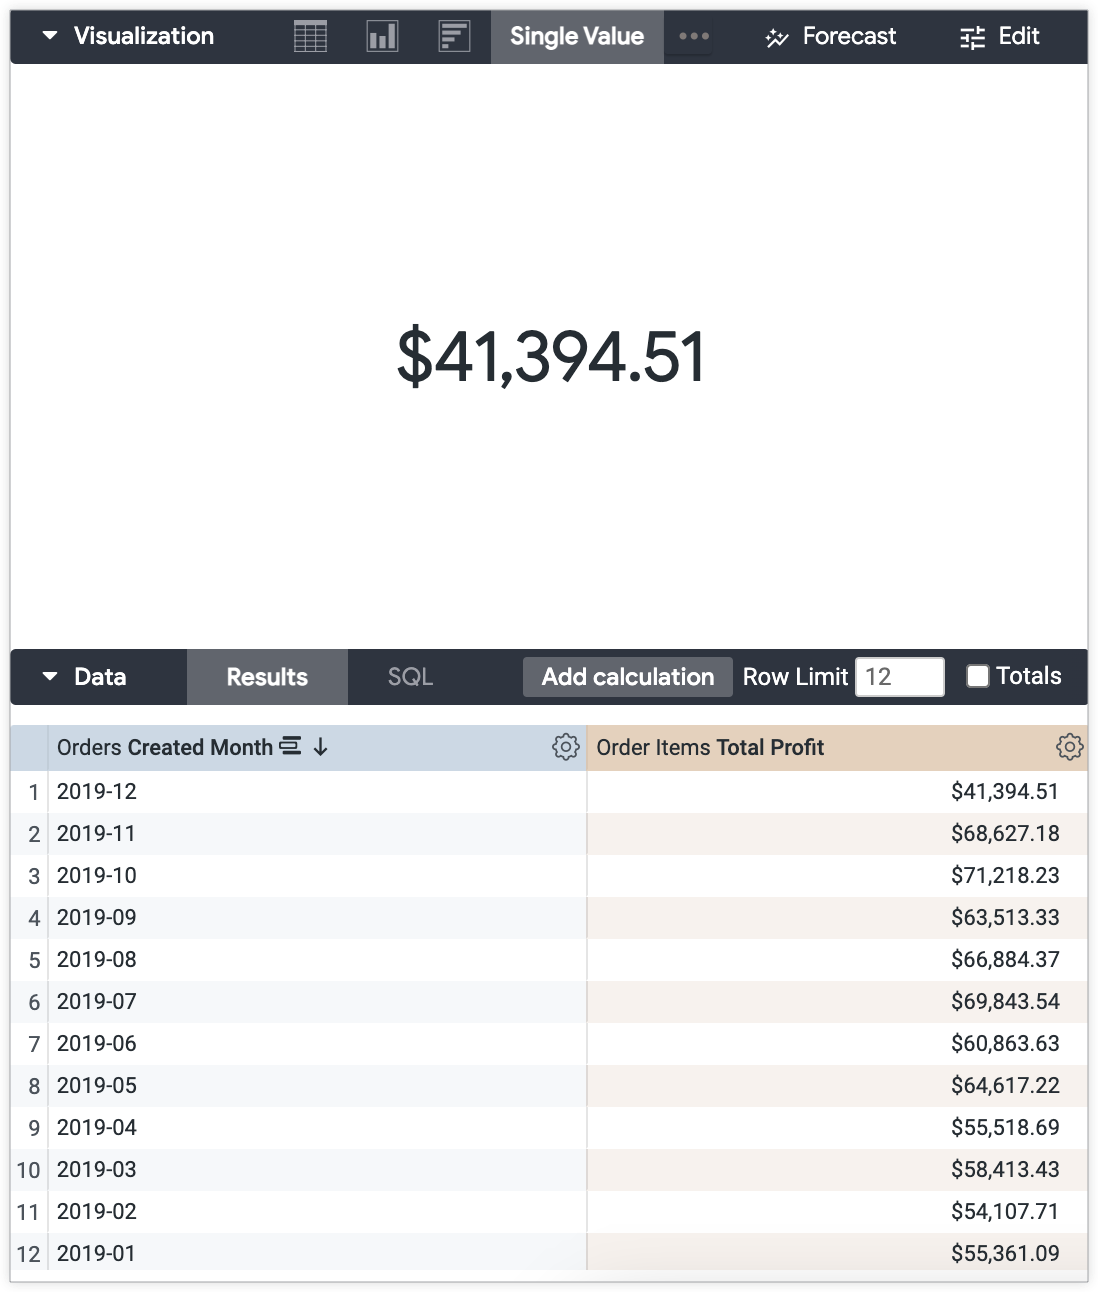
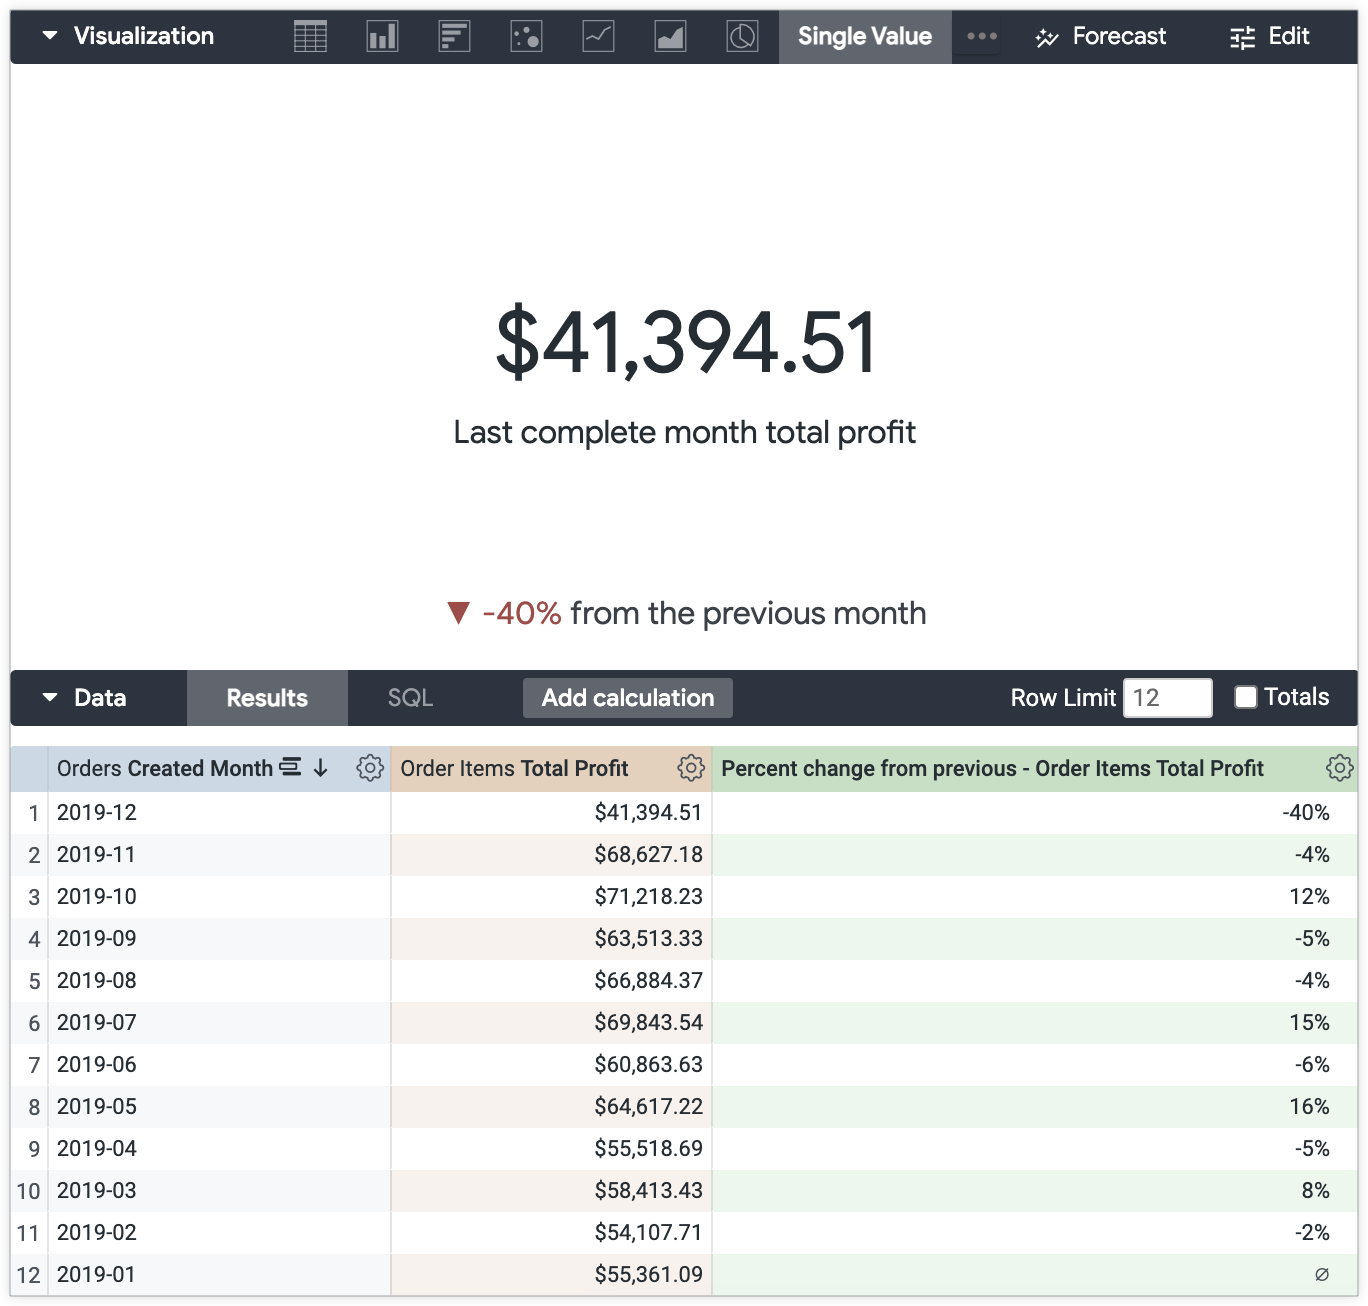
Without the data table for context, the value does not present much information to users. What if you would like to show how the total profit for the last complete month compares with the total profit of the month prior? You can use the settings in the visualization **Edit** menu to create a comparison of these values in the visualization.
To display a comparison of the current value against the value of the previous row, follow these steps:
Prepare your Explore:
1. Organize your Explore query so that the visualization [displays the desired value](https://docs.cloud.google.com/looker/docs/kpi-single-value-options.md.txt).
2. Add a field that compares the values of the current and previous row to the Explore query.
If there is no existing comparison field available in the field picker, and you have the necessary permissions, you can use a [table calculation shortcut](https://docs.cloud.google.com/looker/docs/table-calculations.md.txt#types_of_common_calculation_shortcuts). This example uses the **% change from previous row** calculation.
Customize your single value visualization:
1. Open the **Edit** menu on the **Visualization** bar.
2. Select any desired style options from the **Style** tab, including adding a custom title that will appear as subtext under the value along with any Excel-style value formatting.
For this example, "Last complete month total profit" is entered into the **Title Override** section to provide a better indication of what the value represents.
3. On the **Comparison** tab, select **Show**.
4. Select the **Show as Change** option from the **Value Labels** drop-down menu.
5. Select the **Positive values are bad** option to display a positive change in red and negative change in green, if that suits your use case.
For this example, negative changes indicate that the **Total Profit** for December versus November was lower, which is considered a "bad" change.
6. Customize the value comparison label on the **Comparison** tab as desired.
Deselect the **Show Label** option to hide the field label.
Leave the **Show Label** options unchanged to include the field label as is.
Input a custom label into the **Label** field. For this example, the custom label "from previous month" is applied.
The end result is the **Total Profit** value for December, $41,394.51 with the subtext highlighting the comparison to the previous month's total profit, which is down 40%.
### Adding conditional formatting for more context
You can add an additional layer of context while keeping your visualization clean and minimal with conditional formatting.
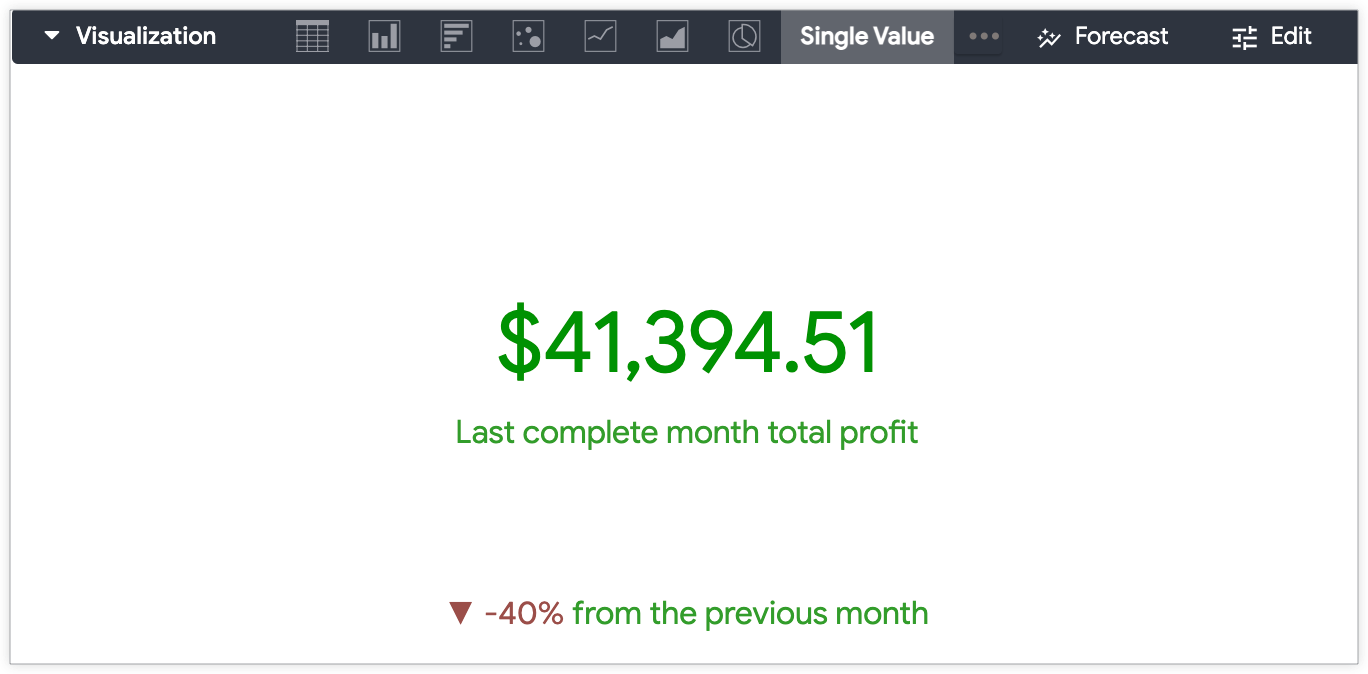
In this example, the profit threshold for a successful month is $30,000, and any monthly profits over this threshold should be indicated with the color green.
You can use conditional formatting settings on the **Formatting** tab in the visualization **Edit** menu to convey that the value is above the profit threshold.
To enable conditional formatting in the single value visualization **Edit** menu:
1. Open the **Edit** menu on the **Visualization** bar.
2. Select the **Enable Conditional Formatting** option on the **Formatting** tab.
3. Select a color palette from the **Collection** drop-down menu in the **Colors** section.
4. Input your formatting rules in the **Rules** section.
Select the condition from the **Format** drop-down menu.For this example, **If the value is greater than** is selected.
Input the value for the rule threshold. For this example, "30000" is entered.
Select the desired **Background color** and **Font color** . Make sure to consider color contrast for the [accessibility of your content](https://docs.cloud.google.com/looker/docs/visualization-guide.md.txt#accessibility). For this example, a white background and dark green font are selected.
5. Add another rule by selecting the **Add a rule** button at the bottom of the tab.
For this example, another rule is created to indicate when total profit values are *less* than the $30,000 threshold.
December's total profit, $41,394.51, may be 40% less than the total profit of the previous month --- but it is still above the profit threshold. Now the total profit value is displayed in green to indicate to users that it is above the profit threshold.
## Example: Showing a single value in the context of progress toward a goal
Another single value visualization option is to display a value in the context of progress toward a goal.
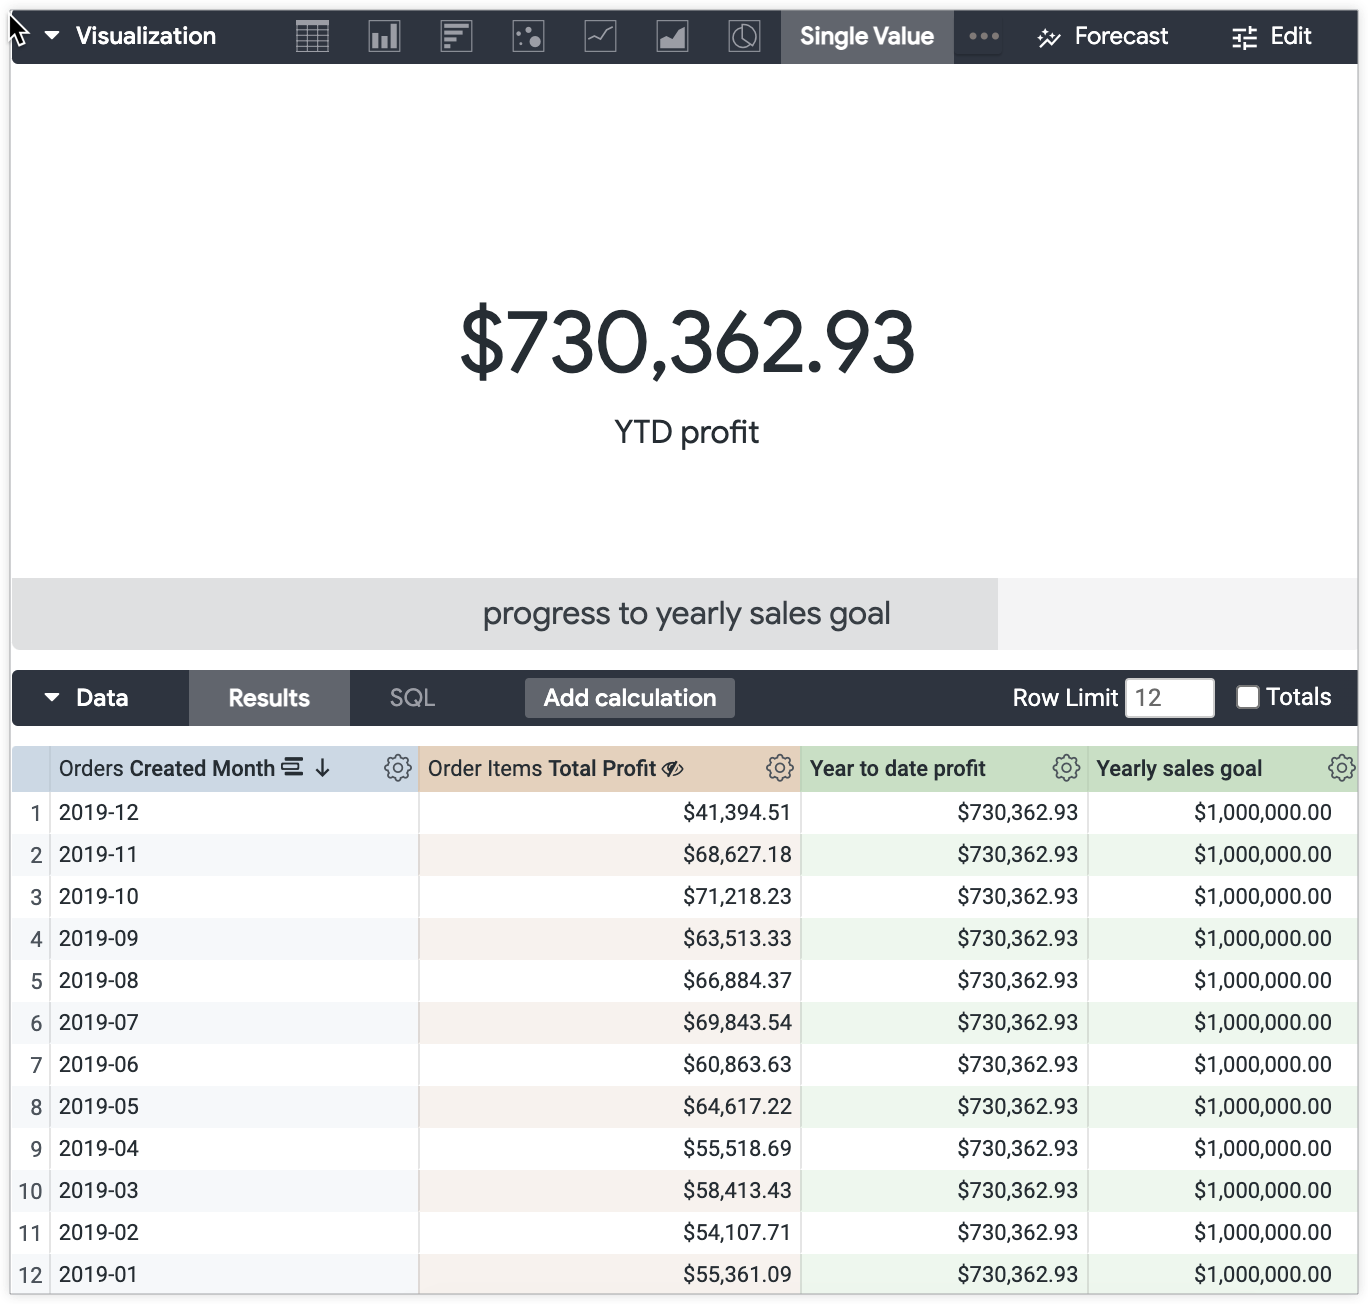
For example, using the same dataset (**Total Profit** grouped by **Created Month** for the past 12 months), you can display the total year to date (YTD) profit against the profit goal for the entire year. The yearly profit goal for this example is $1,000,000.
To display the single value in the context of progress, follow these steps.
Prepare your Explore:
1. Use a table calculation to create a sum of the **Total Profit** values. The table calculation expression is `sum(${view_name.field_name})`.
For this example, the expression is `sum(${order_items.total_profit})`.
2. Add a field, or a new table calculation, that represents the goal that the value will be compared against.
If you are creating a table calculation, the value will need to be represented as a *measure* for it to be included in the visualization.
In the calculation expression, multiply a measure by zero and add the goal value: `(${measure_viewname.measure_fieldname}*0) + `.
For this example, the expression is `(${order_items.total_profit}*0) + 1000000`.
Customize your single value visualization:
1. Open the **Edit** menu on the **Visualization** bar.
2. Select any desired style options from the **Style** tab, including adding a custom title that will appear as subtext under the value along with any Excel-style value formatting.
For this example, "YTD profit" is entered into the **Title Override** section to provide a better indication of what the value represents.
3. On the **Comparison** tab, select **Show**.
4. Select either the **Calculate Progress** option or the **Calculate Progress (with Percentage)** option from the **Value Labels** drop-down menu.
**Calculate Progress** will display a progress bar with the value shaded to indicate the current status against the goal. If the default **Label** settings are applied, the field name will also appear.
**Calculate Progress (with Percentage)** will display the shaded progress bar with the text **X% of X** with the default **Label** settings applied.
5. Customize the progress bar label on the **Comparison** tab as desired.
Deselect the **Show Label** option to hide the field label. With the **Calculate Progress** option, this will display only a shaded progress bar. With the **Calculate Progress (with Percentage)** option, this will display the text **X% of X** in a shaded progress bar.
Leave the **Show Label** options unchanged to include the field label as is.
Input a custom label into the **Label** field.
The end result is the year to date (YTD) profit value of $730,362.93 with a progress bar indicating the progress toward the $1,000,000 yearly sales goal.
The example looks different with the **Calculate Progress** and **Calculate Progress (with Percentage)** settings applied.
- This is how the example will look with the **Calculate Progress** option and custom label "progress to yearly sales goal" settings applied from the **Comparison** tab:
- This is how the example will look with the **Calculate Progress (with Percentage)** option and custom label "yearly sales goal" settings applied from the **Comparison** tab:

## Next steps:
Once you have created your single value visualization, you can share it with others:
- [Save your Explore as a Look](https://docs.cloud.google.com/looker/docs/saving-and-editing-looks.md.txt)
- [Add the Explore to a dashboard](https://docs.cloud.google.com/looker/docs/creating-user-defined-dashboards.md.txt#adding_query_tiles_from_an_explore)
- [Share the Explore with a URL](https://docs.cloud.google.com/looker/docs/sharing-urls.md.txt)