This page explains how to create distribution-type log-based metrics using the
Google Cloud console, the Logging API, and the Google Cloud CLI.
For an overall view of log-based metrics, go to
[Overview of log-based metrics](https://docs.cloud.google.com/logging/docs/logs-based-metrics.md.txt).
## Overview
Distribution metrics require both a filter to select the relevant log entries
and a value extractor to grab the numeric value for the distribution. The value
extractor is the same kind as is used for [user-defined labels](https://docs.cloud.google.com/logging/docs/logs-based-metrics/labels.md.txt).
A distribution metric records the statistical distribution of the extracted
values in histogram buckets. The extracted values are not recorded
individually, but their distribution across the configured buckets are
recorded, along with the count, mean, and sum of squared deviation of the
values. You can use the default layout of histogram buckets in your
distribution or you can fine-tune the buckets' boundaries to approximately
capture the values.
For more information on viewing and interpreting distribution metrics, see
[Distribution metrics](https://docs.cloud.google.com/monitoring/charts/charting-distribution-metrics.md.txt).
## Before you begin
1. To use log-based metrics, you must have a Google Cloud project with
billing enabled:
2. Ensure that your Identity and Access Management role includes the permissions required to
create and view log-based metrics, and to create alerting policies.
For details, see
[Permissions for log-based metrics](https://docs.cloud.google.com/logging/docs/access-control.md.txt#metrics-permissions).
## Create a distribution metric
The metric counts the log entries identified by a filter you provide. You can
use [regular expressions](https://docs.cloud.google.com/logging/docs/view/logging-query-language.md.txt#regular-expressions)
in your filter, and we recommend that you include a resource type. The
length of a filter can't exceed 20,000 characters.
Don't put sensitive information in the filter. Filters are treated as service data.
> [!NOTE]
> **Note:** See the following [Troubleshooting](https://docs.cloud.google.com/logging/docs/logs-based-metrics/troubleshooting.md.txt#undefined-resource) section if you're creating log-based metrics on audit logs.
### Console
Follow these steps to create a log-based counter metric in the
Google Cloud console in your Google Cloud project:
1. In the Google Cloud console, go to the **Log-based Metrics** page:
[Go to **Log-based Metrics**](https://console.cloud.google.com/logs/metrics)
If you use the search bar to find this page, then select the result whose subheading is
**Logging**.
2. Click **Create Metric** . The **Create logs metric** panel appears.
3. Set the **Metric type** : Select **Distribution**.
4. Set the following fields in the **Details** section:
- **Log metric name** : Choose a name that is unique among the log-based metrics in your Google Cloud project. Some naming restrictions apply; see [Troubleshooting](https://docs.cloud.google.com/logging/docs/logs-based-metrics/troubleshooting.md.txt#metric-name-restrictions) for details.
- **Description**: Enter a description for the metric.
- **Units** : (Optional) For distribution metrics, you can optionally enter units, such as `s` and `ms`. For more information, see the `unit` field of the [`MetricDescriptor`](https://docs.cloud.google.com/monitoring/api/ref_v3/rest/v3/projects.metricDescriptors.md.txt#MetricDescriptor).
5. Define your metric filter in the **Filter selection** section.
1. Use the **Select project or log bucket** menu to select whether the
metric
counts the log entries in your Google Cloud project or only
those log entries in a specific log bucket.
2. Create a filter that collects only the log entries that you want to
count in your metric using the
[logging query language](https://docs.cloud.google.com/logging/docs/view/logging-query-language.md.txt).
You can also use regular expressions to create your metric's
filters.
3. **Field name**: Enter the log entry field that contains the
distribution's value. You are offered choices as you type. For
example:
protoPayload.latency
4. **Regular expression** : (Optional) If **Field name** always
contains a numeric value convertible to type `double`, then you can
leave this field empty. Otherwise, specify a regular expression that
extracts the numeric distribution value from the field value.
**Example** . Suppose that your `latency` log entry
field contains a number followed by `ms` for milliseconds. The
following regexp chooses the number without the unit suffix:
([0-9.]+)
The parentheses, known as a regexp **capture group** , identifies the
part of the text match that will be extracted. See
[using regular expressions](https://docs.cloud.google.com/logging/docs/view/logging-query-language.md.txt#regular-expressions)
for details.
- **Advanced (Histogram buckets)** : (Optional) Clicking **Advanced** opens a section of the form you can use to specify custom bucket layouts. If you don't specify your bucket layouts, a default bucket layout is provided. For more information, see [Histogram buckets](https://docs.cloud.google.com/logging/docs/logs-based-metrics/distribution-metrics.md.txt#bucket_layouts) on this page.
1. To see which log entries match your filter, click **Preview logs**.
6. (Optional) Add a label in the **Labels** section. For instructions on
creating labels, see [Create a label](https://docs.cloud.google.com/logging/docs/logs-based-metrics/labels.md.txt#create-label).
7. Click **Create metric** to create the metric.
### gcloud
To create a distribution-type log-based metric,
create a file that contains a representation of your
[`LogMetric`](https://docs.cloud.google.com/logging/docs/reference/v2/rest/v2/projects.metrics.md.txt#LogMetric) definition in
JSON or YAML format. Then use the following command to read the
configuration from your file:
```none
gcloud logging metrics create METRIC_NAME --config-from-file FILENAME
```
For information about describing the histogram buckets for a distribution,
see [Histogram buckets](https://docs.cloud.google.com/logging/docs/logs-based-metrics/distribution-metrics.md.txt#bucket_layouts).
### API
To create a distribution metric, use the
[`projects.metrics.create`](https://docs.cloud.google.com/logging/docs/reference/v2/rest/v2/projects.metrics/create.md.txt) method
of the Logging API. If you use the APIs Explorer pane on the
reference page, then prepare the arguments as follows:
1. Set the **parent** field to the project or bucket in which the metric is
to be created:
- For a project-scoped log-based metric, specify the project:
```none
projects/PROJECT_ID
```
- For a bucket-scoped log-based metric, specify the bucket:
```none
projects/PROJECT_ID/locations/LOCATION/bucket/BUCKET_ID
```
2. Set the request body to a [`LogMetric`](https://docs.cloud.google.com/logging/docs/reference/v2/rest/v2/projects.metrics.md.txt#LogMetric) object. The
section titled
[Example JSON for a distribution metric](https://docs.cloud.google.com/logging/docs/logs-based-metrics/distribution-metrics.md.txt#example) provides a sample
request body.
### Example JSON for a distribution metric
The following is an example of a [`LogMetric`](https://docs.cloud.google.com/logging/docs/reference/v2/rest/v2/projects.metrics.md.txt#LogMetric) object. You must pass
a `LogMetric` object when you use the API. You can also save the object to
a file and provide the filename to the Google Cloud CLI command:
{
name: "my-metric"
description: "Description of my-metric."
filter: "resource.type=gce_instance AND log_id(\"syslog\")",
valueExtractor: "REGEXP_EXTRACT(jsonPayload.latencyField, \"([0-9.]+)ms\")",
labelExtractors: {
"my-label-1":
"REGEXP_EXTRACT(jsonPayload.someField, \"before ([[:word:]]+) after\")",
"my-label-2":
"EXTRACT(jsonPayload.anotherField, \"before ([0-9]+) after\")",
},
bucketOptions: { [SEE_BELOW] },
metricDescriptor: {
metricKind: DELTA,
valueType: DISTRIBUTION,
unit: "ms",
labels: [
{
key: "my-label-1",
valueType: STRING,
description: "Description of string my-label-1.",
},
{
key: "my-label-2",
valueType: INT64,
description: "Description of integer my-label-2.",
}
]
},
}
Notes:
- Some naming restrictions apply; see
[Troubleshooting](https://docs.cloud.google.com/logging/docs/logs-based-metrics/troubleshooting.md.txt#metric-name-restrictions) for details.
- The field `metricDescriptor` corresponds to a
[`MetricDescriptor`](https://docs.cloud.google.com/monitoring/api/ref_v3/rest/v3/projects.metricDescriptors.md.txt#MetricDescriptor) object. You must set `metricKind` to
`DELTA` and `valueType` to `DISTRIBUTION`.
- The field `bucketOptions` must be populated. The next section describes how
to configure this field.
## Histogram buckets
Distribution metrics include a histogram that counts the number of values that
fall in specified ranges (buckets). You can have up to 200 buckets in a
distribution metric.
Each bucket has two **boundary values** , *L* and *H* , that define the lowest and
highest values covered by the bucket. The **width** of the bucket is *H* - *L*.
Since there cannot be gaps between buckets, the lower boundary of one bucket is
the same as the higher boundary of the previous bucket, and so forth. So that
the boundaries don't fall into more than one bucket, a bucket includes its lower
boundary; its higher boundary belongs to the next bucket.
All bucket layouts can be specified by listing, in increasing order, the
boundary values between individual buckets. The first bucket is the **underflow
bucket** , which counts values less than the first boundary. The last bucket is
the **overflow bucket** , which counts values greater than or equal to the last
boundary. The other buckets count values greater than or equal to their lower
boundary and less than their upper boundary. If there are *n* boundary values,
then there are *n+1* buckets. Excluding the underflow and overflow buckets,
there are *n-1* **finite buckets**.
There are three different ways to specify the boundaries between
histogram buckets for distribution metrics. You either specify a formula
for the boundary values, or you list the boundary values:
- **Linear** (*offset* , *width* , *i* ): Every bucket has the same width.
The boundaries are *offset* + *width* \* *i* , for *i* =0,1,2,...,*N* . For
more information on linear buckets, see the
[API reference](https://docs.cloud.google.com/monitoring/api/ref_v3/rest/v3/TypedValue.md.txt#Linear).
- **Exponential** (*scale* , *growth_factor* , *i* ): Bucket widths increase for
higher values. The boundaries are *scale* \* *growth_factor* ^*i*^,
for *i* =0,1,2,...,*N* . For more information on exponential buckets, see
the [API reference](https://docs.cloud.google.com/monitoring/api/ref_v3/rest/v3/TypedValue.md.txt#Exponential).
- **Explicit** : You list all the boundaries for the buckets in the
*bounds* array. Bucket *i* has these boundaries:
Upper bound: bounds[*i*] for (0 <= *i* < *N*-1)
Lower bound: bounds[*i* - 1] for (1 <= *i* < *N*)
For more information on explicit buckets, see the
[API reference](https://docs.cloud.google.com/monitoring/api/ref_v3/rest/v3/TypedValue.md.txt#Explicit).
How you specify your histogram buckets is explained in the following section:
### Console
The **Histogram buckets** submenu opens when you create a distribution
metric and you click **More** in the **Metric editor** form.
The following subform is for the **Linear** bucket layout:
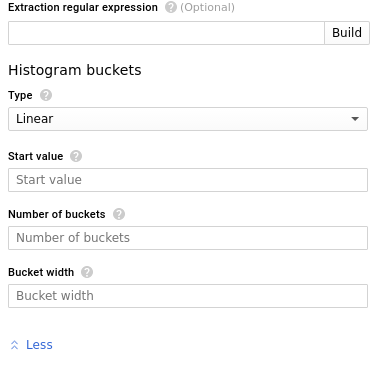
**Linear buckets**: Fill in the histogram bucket form as follows.
- **Type** : **Linear**
- **Start value (*a*)** : The lower boundary of the first finite bucket. This value is called **offset** in the API.
- **Number of buckets (*N*)**: The number of finite buckets. The value must be greater than or equal to 0.
- **Bucket width (*b*)**: The difference between the upper bound and lower bound in each finite bucket. The value must be greater than 0.
For example, if the start value is 5, the number of buckets is 4, and
the bucket width is 15, then the bucket ranges are as follows:
(-INF, 5), [5, 20), [20, 35), [35, 50), [50, 65), [65, +INF)
**Explicit buckets**:
Fill in the histogram bucket form as follows:
- **Type** : **Explicit**
- **Bounds (*b*)**: A comma-separated list of the boundary values of the finite buckets. This also determines the number of buckets and their widths.
For example, if the list of boundaries is:
0, 1, 2, 5, 10, 20
then there are five finite buckets with the following ranges:
(-INF, 0), [0, 1), [1, 2), [2,5), [5, 10), [10, 20), [20, +INF)
**Exponential buckets**:
Fill in the histogram bucket form as follows:
- **Type** : **Exponential**
- **Number of buckets (*N*)**: The total number of finite buckets.
The value must be greater than 0.
- **Linear scale (*a*)**: The linear scale for the buckets.
The value must be greater than 0.
- **Exponential growth factor (*b*)**: The exponential growth factor for
the buckets. The value must be greater than 1.
For example, if *N* =4, *a* =3, and *b*=2, then the bucket ranges
are as follows:
(-INF, 3), [3, 6), [6, 12), [12, 24), [24, 48), [48, +INF)
For more information about the buckets, see
[`BucketOptions`](https://docs.cloud.google.com/monitoring/api/ref_v3/rest/v3/TypedValue.md.txt#BucketOptions) in the
Cloud Monitoring API.
### API
The optional bucket layout is specified by the `bucketOptions` field in
the [`LogMetric`](https://docs.cloud.google.com/logging/docs/reference/v2/rest/v2/projects.metrics.md.txt#LogMetric) object supplied to
[`projects.metrics.create`](https://docs.cloud.google.com/logging/docs/reference/v2/rest/v2/projects.metrics/create.md.txt). For the
complete [`LogMetric`](https://docs.cloud.google.com/logging/docs/reference/v2/rest/v2/projects.metrics.md.txt#LogMetric) object,
see [Create a distribution metric](https://docs.cloud.google.com/logging/docs/logs-based-metrics/distribution-metrics.md.txt#create-distribution) on this page.
The additions for bucket layouts are as shown:
**Linear buckets**:
{ # LogMetric object
...
bucketOptions: {
linearBuckets: {
numFiniteBuckets: 4,
width: 15,
offset: 5
}
},
...
}
The previous sample creates the following buckets:
(-INF, 5), [5, 20), [20, 35), [35, 50), [50, 65), [65, +INF)
**Explicit buckets**: Boundaries are listed individually.
{ # LogMetric object
...
bucketOptions: {
explicitBuckets: {
bounds: [0, 1, 2, 5, 10, 20 ]
}
},
...
}
The previous sample creates the following buckets:
(-INF, 0), [0, 1), [1, 2), [2, 5), [5, 10), [10, 20), [20, +INF)
**Exponential buckets** : Boundaries are *scale* \* *growthFactor* \^ *i* , for *i* =0,1,2, ..., *numFiniteBuckets*
{ # LogMetric object
...
bucketOptions: {
exponentialBuckets: {
numFiniteBuckets: 4,
growthFactor: 2,
scale: 3
}
},
...
}
The previous sample creates the following buckets:
(-INF, 3), [3, 6), [6, 12), [12, 24), [24, 48), [48, +INF)
## New metric latency
Your new metric appears in the list of metrics and in the relevant Monitoring menus right away. However, it might take up to a
minute for the metric to start collecting data for the matching log entries.
## Inspect distribution metrics
To list the user-defined log-based metrics in your Google Cloud project or to
inspect a particular metric in your Google Cloud project, do the following:
### Console
1. In the Google Cloud console, go to the **Log-based Metrics** page:
[Go to **Log-based Metrics**](https://console.cloud.google.com/logs/metrics)
If you use the search bar to find this page, then select the result whose subheading is
**Logging**.
2. In the **User-defined metrics** pane, you see the user-defined
log-based metrics in the current Google Cloud project:
3. To view the data in a log-based metric, click the
**Menu** in
the metric's row and select **View in Metrics Explorer**.
### gcloud
To list the user-defined log-based metrics in your Google Cloud project,
use the following command:
```none
gcloud logging metrics list
```
To display a user-defined log-based metric in your Google Cloud project,
use the following command:
```none
gcloud logging metrics describe METRIC_NAME
```
To get help, use the following command:
```none
gcloud logging metrics --help
```
You can't read a metric's time series data from the Google Cloud CLI.
### API
### List metrics
To list the user-defined log-based metrics in a Google Cloud project, use
the [`projects.metrics.list`](https://docs.cloud.google.com/logging/docs/reference/v2/rest/v2/projects.metrics/list.md.txt) API method.
Fill in the parameters to the method as follows:
- **parent** : The resource name of the Google Cloud project: `projects/PROJECT_ID`.
- **pageSize**: The maximum number of results.
- **pageToken** : Gets the next page of results. For information about using page tokens, see [`projects.metrics.list`](https://docs.cloud.google.com/logging/docs/reference/v2/rest/v2/projects.metrics/list.md.txt).
### Retrieve metric definitions
To retrieve a single user-defined log-based metric, use the
[`projects.metrics.get`](https://docs.cloud.google.com/logging/docs/reference/v2/rest/v2/projects.metrics/get.md.txt) API method.
Fill in the parameters to the method as follows:
- **metricName**: The resource name of the metric:
```none
projects/PROJECT_ID/metrics/METRIC_ID
```
### Read metric data
To read the time series data in a log-based metric, use
the [`projects.timeseries.list`](https://docs.cloud.google.com/monitoring/api/ref_v3/rest/v3/projects.timeSeries/list.md.txt) in the
Cloud Monitoring API.
For details on time series data, see
[Reading time series](https://docs.cloud.google.com/monitoring/custom-metrics/reading-metrics.md.txt).
To read a single user-defined log-based metric, fill in the method's
parameters with this metric type and identifier:
```none
logging.googleapis.com/user/METRIC_ID
```
## Update distribution metrics
You can edit a user-defined log-based metric to change its description, filter,
and the names of fields referenced in the metric. You can add new labels to the
metric and you can change the regular expressions used to extract values for the
metric and its labels. If you're using a bucket-scoped metric, you can also
update the metric's bucket.
You can't change the names or types of user-defined log-based metrics or their
labels, and you can't delete existing labels in a log-based metric.
To edit a log-based metric, do the following:
### Console
1. In the Google Cloud console, go to the **Log-based Metrics** page:
[Go to **Log-based Metrics**](https://console.cloud.google.com/logs/metrics)
If you use the search bar to find this page, then select the result whose subheading is
**Logging**.
2. Click **Edit metric** in the
**Menu**
for the log-based metric that you want to modify.
3. Change the allowable items in the metric.
4. Click **Update metric**.
### gcloud
Use the Google Cloud CLI to change a counter metric's description, filter
query and bucket. You can update any or all of the fields at once.
```none
gcloud logging update METRIC_NAME \
--description="METRIC_DESCRIPTION" \
--log-filter="FILTER" \
--bucket-name=BUCKET_NAME
```
If you change the bucket associated with a bucket-scoped metric, then
any metric data collected before the change no longer reflects the
current configuration. The metric data collected for the previous bucket
is not removed.
> [!NOTE]
> **Note:** The METRIC_NAME value must match an existing log-based metric in your Google Cloud project, or the update command creates a new metric.
To update distribution metrics or other counter metric fields, excluding the
METRIC_NAME, create a file that contains the revised specification of
your [`LogMetric`](https://docs.cloud.google.com/logging/docs/reference/v2/rest/v2/projects.metrics.md.txt#LogMetric) in JSON or YAML format. Then, update the
metric by calling the `update` command with the --config-from-file field,
replacing FILENAME with the name of your JSON or YAML file:
```none
gcloud logging update METRIC_NAME --config-from-file FILENAME
```
For more details, use the following command:
```none
gcloud logging metrics update --help
```
### API
To edit a log-based metric, use the
[`projects.metrics.update`](https://docs.cloud.google.com/logging/docs/reference/v2/rest/v2/projects.metrics/update.md.txt) method in the API.
Set the fields as follows:
- **metricName**: The full resource name of the metric:
```none
projects/PROJECT_ID/metrics/METRIC_ID
```
For example:
```
projects/my-gcp-project/metrics/my-error-metric
```
- In the request body, include a [`LogMetric`](https://docs.cloud.google.com/logging/docs/reference/v2/rest/v2/projects.metrics.md.txt#LogMetric) object that
is exactly the same as the existing metric except for the
changes and additions you want to make.
## Delete distribution metrics
To delete a user-defined log-based metric, do the following:
### Console
1. In the Google Cloud console, go to the **Log-based Metrics** page:
[Go to **Log-based Metrics**](https://console.cloud.google.com/logs/metrics)
If you use the search bar to find this page, then select the result whose subheading is
**Logging**.
2. Select the metric you want to delete and click **Delete**.
Alternatively, click **Delete metric** in the
**menu**
of the log-based metric that you want to delete.
### gcloud
Use the following command to delete a user-defined log-based metric
in the current Google Cloud project:
```none
gcloud logging metrics delete METRIC_NAME
```
For more details, use the following command:
```none
gcloud logging metrics delete --help
```
### API
To delete a user-defined log-based metric, use the
[`projects.metrics.delete`](https://docs.cloud.google.com/logging/docs/reference/v2/rest/v2/projects.metrics/delete.md.txt) method in the API.
In addition, in the Google Cloud console **Log-based metric** page, the
**User-defined metrics** pane of the log-based metrics interface provides
more features to help you manage the user-defined metrics on your
Google Cloud project. See [User-defined metrics](https://docs.cloud.google.com/logging/docs/logs-based-metrics.md.txt#user-defined_metrics)
for details.