This document shows you how to configure and use [Cloud Logging](https://docs.cloud.google.com/logging)
and [Cloud Monitoring](https://docs.cloud.google.com/monitoring) for regional external passthrough Network Load Balancers.
Backend service-based regional external passthrough Network Load Balancers support both Logging
and Monitoring. However, target pool-based regional external passthrough Network Load Balancers
support only Monitoring.
## Logging
Logs provide useful information for troubleshooting
and monitoring your backend service-based regional external passthrough Network Load Balancer. Logs are
aggregated per connection and exported in near real time. Logs are generated for
each load-balanced instance's
TCP, UDP, ESP, GRE, ICMP, and ICMPv6
flows for both
ingress and egress traffic. For more information about the fields provided in
the log entry, see [Log fields](https://docs.cloud.google.com/load-balancing/docs/network/networklb-monitoring#logs-format).
There are no additional charges for using logs. Based on how you import
logs, standard pricing for
[Cloud Logging](https://cloud.google.com/stackdriver/pricing#google-clouds-operations-suite-pricing),
BigQuery, or Pub/Sub apply. Enabling logs has no effect on the
performance of the load balancer.
Logging provides the following benefits:
- **Regional external passthrough Network Load Balancer traffic monitoring.** Per-connection logging gives you insight into how each
connection is routed to serving backends.
- **Network troubleshooting.** You can utilize regional external passthrough Network Load Balancer logs for troubleshooting.
For more information, see
[Troubleshoot regional external passthrough Network Load Balancers](https://docs.cloud.google.com/load-balancing/docs/network/troubleshooting-networklb).
### Sample log format for an external client to VM flows
The following diagram shows the inbound and outbound traffic for an external
client (203.0.113.7), regional external passthrough Network Load Balancer (198.51.100.99),
and backend instance (10.240.0.2).
[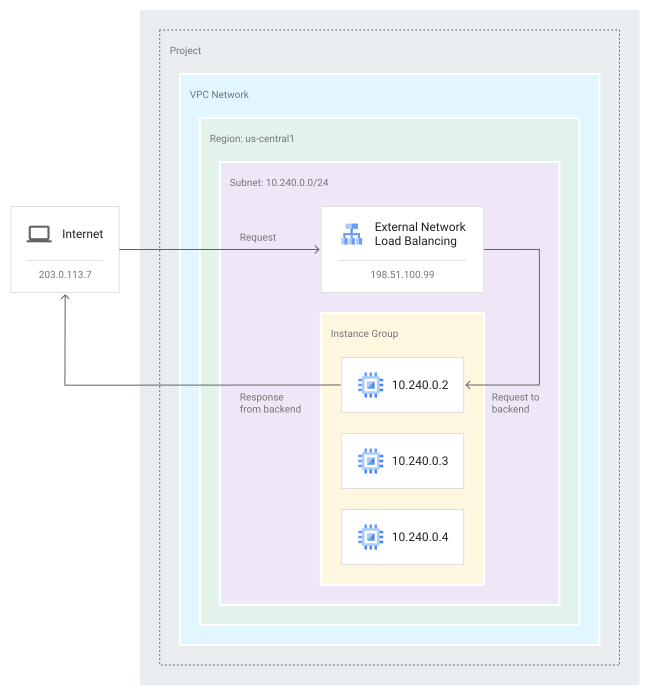](https://docs.cloud.google.com/static/load-balancing/images/netlb_logging.svg) Inbound and outbound flows for an external client to VM.
Regional external passthrough Network Load Balancer logs for connections from the client to the backend
instance are formatted as follows:
- `connection.clientIp`: 203.0.113.7
- `connection.serverIp`: 198.51.100.99
- `bytesSent`: 1256
- `bytesReceived`: 4521
### Logs sampling and collection
Google Cloud samples the packets that leave and enter load balancer backend
VMs. Those sampled packets are processed to generate logs.
Not every packet is sampled. Google Cloud samples a variable subset of
packets depending on the amount of traffic on the physical host.
The lowest possible sampling rate is one out of 1,024 packets. The sampling rate
is dynamically controlled by Google Cloud. You cannot adjust the sampling
rate.
The packet sampling interacts with firewall rules in the following ways:
- Packets are sampled *before* egress firewall rules are applied.
- Packets are sampled *after* ingress firewall rules are applied.
After packet sampling, Google Cloud processes the sampled packets
according to the following procedure:
1. **Aggregation:** Sampled packets are aggregated over a five-second interval
to produce a single flow entry.
2. **Configurable (secondary) log sampling:** This is a second sampling
process, sampling the flows. You control the fraction of the flow entries
that are emitted as log entries according to the
[logConfig.sampleRate](https://docs.cloud.google.com/compute/docs/reference/rest/v1/regionBackendServices/insert#request-body)
parameter. When `logConfig.sampleRate` is `1.0` (100%), this means that *all
of the sampled packets* are processed.
3. **Write to logging:** The log entries are written to Cloud Logging.
### Optional fields
Log records contain required fields and optional fields. The [Log
fields](https://docs.cloud.google.com/load-balancing/docs/network/networklb-monitoring#logs-format)
section lists which fields are optional and which are required. All required
fields are always included. You can customize which optional fields you keep.
- If you select **include all optional**, all optional fields in the log
record format are included in the flow logs. When new optional fields are added
to the record format, the flow logs automatically include the new fields.
- If you select **exclude all optional**, this omits all optional fields.
- If you select **custom** , you can specify the optional fields
that you want to include by the parent field, such as `serverInstance`, or by
their full names, such as `serverInstance.vm`.
When new optional fields are added to the record format, the logs won't
include these fields, unless they are a new field within a parent field that
you have specified to include.
If you specify a custom optional field using parent fields, when new optional
fields are added to the record format within that parent field, the logs will
automatically include the new fields. For example, if you choose to include
`optionalFieldA`, then a new field added to the logs with the name
`optionalFieldA.subField1` will be included automatically.
For instructions about customizing optional fields, see
[Enable logging on a new backend service](https://docs.cloud.google.com/load-balancing/docs/network/networklb-monitoring#enable-logs-new).
### Response packet source IP address requirements
Logging samples the response packets from the backend
VMs only if the source IP address for those packets matches the load balancer's
forwarding rule IP address.
For TCP connections, response packets must always have sources that match the
request packet's destination; however, for other protocols, it's possible for
response packets to use a different source IP address.
For more information, see
[IP addresses for request and return packets](https://docs.cloud.google.com/load-balancing/docs/network/networklb-backend-service#tcp-udp-request-return).
The packet sampling process used by regional external passthrough Network Load Balancer logging omits any
response packets from backend VMs if those response packets have sources that
don't match an IP address of a forwarding rule for a regional external passthrough Network Load Balancer.
### Enable logging on a new backend service
### Console
1. In the Google Cloud console, go to the **Load balancing** page.
[Go to Load balancing](https://console.cloud.google.com/net-services/loadbalancing/loadBalancers/list)
2. Click the name of your load balancer.
3. Click **Edit** , and then click **Backend Configuration**.
4. Select **Create a backend service**, and then complete the required backend service fields.
5. In the **Logging** section, select the **Enable logging** checkbox.
6. Set a **Sample rate** fraction. You can set a rate to `0.0` through `1.0` (default).
7. Optional: To include all the optional fields in the logs, in the **Optional fields** section, click **Include all optional fields** .
> [!NOTE]
> **Pro tip:** To specify the **CUSTOM**
> option, use the gcloud CLI and the REST API.
8. To finish editing the backend service, click **Update**.
9. To finish editing the load balancer, click **Update**.
### gcloud
Create the backend service to enable logging with the
[`gcloud compute backend-services create`
command](https://docs.cloud.google.com/sdk/gcloud/reference/compute/backend-services/create).
```
gcloud compute backend-services create BACKEND_SERVICE \
--region=REGION \
--enable-logging \
--logging-sample-rate=SAMPLE_RATE \
--logging-optional=LOGGING_OPTIONAL \
--logging-optional-fields=OPTIONAL_FIELDS
```
Replace the following:
- `BACKEND_SERVICE`: the name of the backend service.
- `REGION`: the region of the backend service to create.
- `SAMPLE_RATE`: this field can only be specified if logging is enabled for this backend service.
The value of the field must be from `0.0 to 1.0`,
where `0.0` means that no logs are generated and `1.0`
means that logs are generated for all of the
[sampled packets](https://docs.cloud.google.com/load-balancing/docs/network/networklb-monitoring#logs_sampling_and_collection). Enabling
logging but setting the sampling rate to `0.0`
is equivalent to disabling logging. The default value is `1.0`.
- `LOGGING_OPTIONAL`: the optional fields that you want to include in the logs:
- `INCLUDE_ALL_OPTIONAL` to include all optional fields.
- `EXCLUDE_ALL_OPTIONAL` (default) to exclude all optional fields.
- `CUSTOM` to include a custom list of optional fields that you specify in `OPTIONAL_FIELDS`.
- `OPTIONAL_FIELDS`: a comma-separated list of optional
fields that you want to include in the logs.
For example, `serverInstance.vm,serverGkeDetails`. Can only be
set if
`LOGGING_OPTIONAL` is set to `CUSTOM`.
### API
Make a `POST` request to the
[`regionBackendServices.insert`](https://docs.cloud.google.com/compute/docs/reference/rest/v1/regionBackendServices/insert)
method.
```
POST https://compute.googleapis.com/compute/v1/projects/`PROJECT_ID`/regions/`REGION`/backendServices
```
#### Exclude all optional fields
```
{
"name": "BACKEND_SERVICE",
"loadBalancingScheme": "EXTERNAL",
"logConfig": {
"enable": true,
"sampleRate": SAMPLE_RATE
}
}
```
#### Include all optional fields
```
{
"name": "BACKEND_SERVICE",
"loadBalancingScheme": "EXTERNAL",
"logConfig": {
"enable": true,
"sampleRate": SAMPLE_RATE,
"optionalMode": "INCLUDE_ALL_OPTIONAL"
}
}
```
#### Include a custom list of optional fields
```
{
"name": "BACKEND_SERVICE",
"loadBalancingScheme": "EXTERNAL",
"logConfig": {
"enable": true,
"sampleRate": SAMPLE_RATE,
"optionalMode": "CUSTOM",
"optionalFields": ["field1","field2",...]
}
}
```
### Enable logging on an existing backend service
### Console
1. In the Google Cloud console, go to the **Load balancing** page.
[Go to Load balancing](https://console.cloud.google.com/net-services/loadbalancing/loadBalancers/list)
2. Click the name of your load balancer.
3. Click **Edit** , and then click **Backend Configuration**.
4. Next to your backend service, click **Edit**.
5. In the **Logging** section, select the **Enable logging** checkbox.
6. Set a **Sample rate** fraction. You can set a rate to `0.0` through `1.0` (default).
7. Optional: To include all the optional fields in the logs, in the **Optional fields** section, click **Include all optional fields** .
> [!NOTE]
> **Pro tip:** To specify the **CUSTOM**
> option, use the gcloud CLI and the REST API.
8. To finish editing the backend service, click **Update**.
9. To finish editing the load balancer, click **Update**.
### gcloud
Enable logging on an existing backend service with the
[`gcloud compute backend-services update`
command](https://docs.cloud.google.com/sdk/gcloud/reference/compute/backend-services/update).
```
gcloud compute backend-services update BACKEND_SERVICE \
--region=REGION \
--enable-logging \
--logging-sample-rate=SAMPLE_RATE \
--logging-optional=LOGGING_OPTIONAL \
--logging-optional-fields=OPTIONAL_FIELDS
```
Replace the following:
- `BACKEND_SERVICE`: the name of the backend service.
- `REGION`: the region of the backend service to create.
- `SAMPLE_RATE`: this field can only be specified if logging is enabled for this backend service.
The value of the field must be from `0.0 to 1.0`,
where `0.0` means that no logs are reported and `1.0`
means that logs are generated for all of the
[sampled packets](https://docs.cloud.google.com/load-balancing/docs/network/networklb-monitoring#logs_sampling_and_collection). Enabling
logging but setting the sampling rate to `0.0`
is equivalent to disabling logging. The default value is `1.0`.
- `LOGGING_OPTIONAL`: the optional fields that you want to include in the logs:
- `INCLUDE_ALL_OPTIONAL` to include all optional fields.
- `EXCLUDE_ALL_OPTIONAL` (default) to exclude all optional fields.
- `CUSTOM` to include a custom list of optional fields that you specify in `OPTIONAL_FIELDS`.
- `OPTIONAL_FIELDS`: a comma-separated list of optional
fields that you want to include in the logs.
For example, `serverInstance.vm,serverGkeDetails`. Can only be
set if
`LOGGING_OPTIONAL` is set to `CUSTOM`.
### API
Make a `PATCH` request to the
[`regionBackendServices/patch`](https://docs.cloud.google.com/compute/docs/reference/rest/v1/regionBackendServices/patch)
method.
```
PATCH https://compute.googleapis.com/compute/v1/projects/`PROJECT_ID`/regions/`REGION`/backendServices/`BACKEND_SERVICE`
```
#### Exclude all optional fields
```
"logConfig": {
"enable": true,
"sampleRate": SAMPLE_RATE,
"optionalMode": "EXCLUDE_ALL_OPTIONAL"
}
```
#### Include all optional fields
```
{
"name": "BACKEND_SERVICE",
"loadBalancingScheme": "EXTERNAL",
"logConfig": {
"enable": true,
"sampleRate": SAMPLE_RATE,
"optionalMode": "INCLUDE_ALL_OPTIONAL"
}
}
```
#### Include a custom list of optional fields
```
{
"name": "BACKEND_SERVICE",
"loadBalancingScheme": "EXTERNAL",
"logConfig": {
"enable": true,
"sampleRate": SAMPLE_RATE,
"optionalMode": "CUSTOM",
"optionalFields": ["field1","field2",...]
}
}
```
### Disable logging on an existing backend service
### Console
1. In the Google Cloud console, go to the **Load balancing** page.
[Go to Load balancing](https://console.cloud.google.com/net-services/loadbalancing/loadBalancers/list)
2. Click the name of your load balancer.
3. Click **Edit** , and then click **Backend Configuration**.
4. To disable logging entirely, in the **Logging** section, clear the **Enable logging** checkbox.
5. If you leave logging enabled, you can set a different **Sample rate**
fraction. You can set the rate to `0.0` through `1.0` (default).
To only generate logs for 20% of the
[sampled packets](https://docs.cloud.google.com/load-balancing/docs/network/networklb-monitoring#logs_sampling_and_collection), set the
value to `0.2`.
6. To finish editing the backend service, click **Update**.
7. To finish editing the load balancer, click **Update**.
### gcloud
Disable logging on the backend service with the
[`gcloud compute backend-services update` command](https://docs.cloud.google.com/sdk/gcloud/reference/compute/backend-services/update).
```
gcloud compute backend-services update BACKEND_SERVICE \
--region=REGION \
--no-enable-logging
```
Replace the following:
- `BACKEND_SERVICE`: the name of the backend service.
- `REGION`: the region of the backend service.
### API
Make a `PATCH` request to the
[`regionBackendServices/patch`](https://docs.cloud.google.com/compute/docs/reference/rest/v1/regionBackendServices/patch)
method.
PATCH https://compute.googleapis.com/compute/v1/projects/PROJECT_ID/regions/REGION/backendServices/BACKEND_SERVICE
```
{
"logConfig": {
"enable": false
}
}
```
### View logs
When logs are ingested into Cloud Logging and not excluded through a
[Log router sink](https://docs.cloud.google.com/logging/docs/routing/overview#sinks), you can read logs by using the
[Cloud Logging API](https://docs.cloud.google.com/logging/docs/reference/v2/rest/v2/entries/list) and the
[Google Cloud CLI](https://docs.cloud.google.com/logging/docs/api/gcloud-logging#reading_log_entries).
To view all the regional external passthrough Network Load Balancer logs:
### Console
1. In the Google Cloud console, go to the **Logs Explorer** page.
[Go to Logs Explorer](https://console.cloud.google.com/logs)
2. Select the **External Passthrough Network Load Balancer Rule** resource type.
3. Select the **loadbalancing.googleapis.com/flows** log name.
### Console query
1. In the Google Cloud console, go to the **Logs Explorer** page.
[Go to Logs Explorer](https://console.cloud.google.com/logs)
2. Click the **Show query** toggle.
3. Paste the following into the query field. Replace
`PROJECT_ID` with your project ID.
```
resource.type="loadbalancing.googleapis.com/ExternalNetworkLoadBalancerRule"
logName="projects/PROJECT_ID/logs/loadbalancing.googleapis.com%2Fflows"
```
4. Click **Run query**.
#### View logs for a specific backend service
To view the regional external passthrough Network Load Balancer logs for a specific backend service:
### Console query
1. In the Google Cloud console, go to the **Logs Explorer** page.
[Go to Logs Explorer](https://console.cloud.google.com/logs)
2. Click the **Show query** toggle.
3. Paste the following into the query field. Replace
`PROJECT_ID` with your project ID and `BACKEND_SERVICE_NAME` with the
name of your backend service.
```
resource.type="loadbalancing.googleapis.com/ExternalNetworkLoadBalancerRule"
logName="projects/PROJECT_ID/logs/loadbalancing.googleapis.com%2Fflows"
resource.labels.backend_service_name="BACKEND_SERVICE_NAME"
```
4. Click **Run query**.
#### View logs for a backend instance group
To view the regional external passthrough Network Load Balancer logs for a specific backend instance group:
### Console query
1. In the Google Cloud console, go to the **Logs Explorer** page.
[Go to Logs Explorer](https://console.cloud.google.com/logs)
2. Click the **Show query** toggle.
3. Paste the following into the query field. Replace
`PROJECT_ID` with your project ID and
`BACKEND_GROUP_NAME` with the name of the instance group.
```
resource.type="loadbalancing.googleapis.com/ExternalNetworkLoadBalancerRule"
logName="projects/PROJECT_ID/logs/loadbalancing.googleapis.com%2Fflows"
resource.labels.backend_group_name="BACKEND_GROUP_NAME"
```
4. Click **Run query**.
### Log fields
Log records contain required fields, which are the default fields of every log
record, and optional fields that add additional information. Optional fields can
be omitted to save storage costs.
Some log fields are in a multi-field format, with more than one piece of data
in a given field. For example, the `connection` field is of the `IpConnection`
format, which contains the source and destination IP address and port, plus the
protocol, in a single field. These multi-field fields are described in the
following record format table.
The monitored resource is
[loadbalancing.googleapis.com/ExternalNetworkLoadBalancerRule](https://docs.cloud.google.com/logging/docs/api/v2/resource-list).
| Field | Field format | Field type: Required or Optional | Description |
|---|---|---|---|
| **connection** | [IpConnection](https://docs.cloud.google.com/load-balancing/docs/network/networklb-monitoring#netlb-ipconnection) | Required | 5-Tuple describing this connection. |
| **startTime** | string | Required | Timestamp (RFC 3339 date string format) of the first observed packet during the aggregated time interval. |
| **endTime** | string | Required | Timestamp (RFC 3339 date string format) of the last observed packet during the aggregated time interval. |
| **bytesSent** | int64 | Required | Number of bytes sent from the server to the client. |
| **bytesReceived** | int64 | Required | Number of bytes received by the server from the client. |
| **packetsSent** | int64 | Required | Number of packets sent from the server to the client. |
| **packetsReceived** | int64 | Required | Number of packets received by the server from the client. |
| **rtt** | string | Required | Latency is measured only for TCP connections. Latency is the sum of estimated network round-trip time (RTT) plus time consumed processing the packet within the client's operating system. For sampled packets, the RTT is calculated from the perspective of a load-balanced backend by measuring time differences between the backend sending a TCP segment and the backend receiving a TCP acknowledgment for the sequence number of the sent segment. Latency is formatted as a string that begins with the number of seconds and ends with "s" to indicate seconds. Nanoseconds is expressed as fractional seconds---for example, latency of 250 milliseconds is formatted as "0.250000000s". |
| **serverInstance** | [InstanceDetails](https://docs.cloud.google.com/load-balancing/docs/network/networklb-monitoring#netlb-instancedetails) | Optional | The backend VM instance details. |
| **clientLocation** | [GeographicDetails](https://docs.cloud.google.com/load-balancing/docs/network/networklb-monitoring#netlb-geographicdetails) | Optional | The available location metadata of the client. |
| **serverGkeDetails** | [GkeDetails](https://docs.cloud.google.com/load-balancing/docs/network/networklb-monitoring#netlb-gkedetails) | Optional | GKE metadata for the server backend. Only available if the backend is a GKE endpoint. |
| **networkTier** | [NetworkTierDetails](https://docs.cloud.google.com/load-balancing/docs/network/networklb-monitoring#netlb-networkdetails) | Optional | Network tier for external connections, filled only when the client is not within Google Cloud. |
#### IpConnection field format
| Field | Type | Description |
|---|---|---|
| **clientIp** | string | Client IP address |
| **clientPort** | int32 | Client port. Set for TCP and UDP connections only. |
| **serverIp** | string | Server IP address (forwarding rule IP) |
| **serverPort** | int32 | Server port. Set for TCP and UDP connections only. |
| **protocol** | int32 | [IANA protocol number](http://www.iana.org/assignments/protocol-numbers/protocol-numbers.xhtml) |
#### InstanceDetails field format
| Field | Type | Description |
|---|---|---|
| **projectId** | string | ID of the project containing the VM |
| **vm** | string | Instance name of the VM |
| **region** | string | Region of the VM |
| **zone** | string | Zone of the VM |
| **vmIp** | string | Primary internal IPv4 address of the network interface that served the connection |
#### GeographicDetails field format
| Field | Type | Description |
|---|---|---|
| **continent** | string | Continent name |
| **regionCode** | string | A Unicode CLDR region code such as `US` or `FR`. For most countries, these codes correspond directly to [ISO-3166-2 codes](https://wikipedia.org/wiki/ISO_3166-1_alpha-2). |
| **subRegion** | string | A Unicode CLDR subdivision ID---for example, a province or state of the country such as `USCA` or `CAON`. These Unicode codes are derived from the subdivisions defined by the [ISO-3166-2 standard](https://en.wikipedia.org/wiki/ISO_3166-1_alpha-2). |
| **city** | string | Name of the city---for example, `Mountain View` for Mountain View, California. There is no canonical list of valid values for this variable. The city names can contain US-ASCII letters, numbers, spaces, and the following characters: ``!#$%&'*+-.^_`|~``. |
| **asn** | **int32** | The autonomous system number (ASN) of the external network to which this endpoint belongs. |
#### GkeDetails field format
| Field | Type | Description |
|---|---|---|
| **cluster** | [ClusterDetails](https://docs.cloud.google.com/load-balancing/docs/network/networklb-monitoring#netlb-clusterdetails) | GKE cluster metadata |
| **pod** | [PodDetails](https://docs.cloud.google.com/load-balancing/docs/network/networklb-monitoring#netlb-poddetails) | GKE Pod metadata, populated when the source or destination of the traffic is a Pod |
| **service** | [ServiceDetails](https://docs.cloud.google.com/load-balancing/docs/network/networklb-monitoring#netlb-servicedetails) | GKE service metadata, populated in service endpoints only. The record contains up to two services. If there are more than two relevant services, this field contains a single service with a special **MANY_SERVICES** marker. |
#### ClusterDetails field format
| Field | Type | Description |
|---|---|---|
| **cluster** | string | GKE cluster name |
| **clusterLocation** | string | Location of the cluster. The cluster location can be a zone or a region. |
#### PodDetails field format
| Field | Type | Description |
|---|---|---|
| **pod** | string | Name of the Pod |
| **podNamespace** | string | Namespace of the Pod |
#### ServiceDetails field format
| Field | Type | Description |
|---|---|---|
| **service** | string | Name of the service. If there are more than two relevant services, the field is set to a special **MANY_SERVICES** marker. |
| **serviceNamespace** | string | Namespace of the service |
#### NetworkTierDetails field format
| Field | Type | Description |
|---|---|---|
| **networkTier** | string | NetworkTier used in the connection, one of \[PREMIUM, STANDARD, FIXED_STANDARD, UNKNOWN\]. |
## Monitoring
Regional external passthrough Network Load Balancers export key metrics to
[Cloud Monitoring](https://docs.cloud.google.com/monitoring/docs).
Monitoring metrics can be used for the following purposes:
- Evaluate configuration, usage, and performance of a load balancer
- Troubleshoot problems
- Improve resource utilization and user experience
In addition to the predefined dashboards in Monitoring, you can
create custom dashboards, set up alerts, and query the metrics through the
[Monitoring API](https://docs.cloud.google.com/monitoring/api).
### View Monitoring dashboards
### Console
1. In the Google Cloud console, go to the **Monitoring** page.
[Go to Monitoring](https://console.cloud.google.com/monitoring)
2. In the navigation pane, select **Dashboards**.
3. Select the **Google Cloud Load Balancers** dashboard. All the load balancers are
displayed.
4. Select the load balancer name from the list of load balancers.
In the **Regional external passthrough Network Load Balancer details** pane, you can see various details for
the selected load balancer. This pane displays your current configurations.
In the **Key metrics** pane, you can see charts for each key metric. To see
specific breakdowns, click **Breakdowns** . This pane presents data informed by
historical configurations, while the **Regional external passthrough Network Load Balancer details** pane
only displays the current configurations.
For more information, see [Dashboards and charts](https://docs.cloud.google.com/monitoring/dashboards).
> [!NOTE]
> **Note:** Monitoring collects regional external passthrough Network Load Balancer data every 15 minutes. However, it might take up to two hours after you create your first regional external passthrough Network Load Balancer for data to be available in Cloud Logging and Monitoring.
### Define Monitoring custom dashboards
You can create custom Monitoring dashboards over
regional external passthrough Network Load Balancer metrics.
Refer to [Metrics and resource types](https://docs.cloud.google.com/load-balancing/docs/network/networklb-monitoring#metrics-resources) for a list of
collected metrics. Refer to [Filters](https://docs.cloud.google.com/load-balancing/docs/network/networklb-monitoring#filters) for lists of attributes you can
use to filter your results.
### Console
1. In the Google Cloud console, go to the **Monitoring** page.
[Go to Monitoring](https://console.cloud.google.com/monitoring)
2. Select **Dashboards \> Create Dashboard**.
3. Click **Add chart**.
4. Give the chart a title.
5. Select metrics and filters.
To find regional external passthrough Network Load Balancer metrics, search for the
`loadbalancing.googleapis.com/l3/external` prefix.
6. Click **Save**.
### Define Monitoring alerts
You can define [Monitoring alerts](https://docs.cloud.google.com/monitoring/alerts) over
various regional external passthrough Network Load Balancer metrics:
### Console
1. In the Google Cloud console, go to the **Monitoring** page.
[Go to Monitoring](https://console.cloud.google.com/monitoring)
2. Select **Alerting \> Create a Policy**.
3. Select resource types and metrics.
To find regional external passthrough Network Load Balancer resource types and metrics, search
for `loadbalancing.googleapis.com/l3/external` in the
**Find resource type and metric** field.
4. Specify a **Configuration** to set when an alert should be triggered.
5. Add **Filters** if needed.
6. Click **Save**.
#### Metric reporting frequency and retention
Metrics for the regional external passthrough Network Load Balancers are exported to Monitoring in
one-minute granularity batches. Monitoring data is retained for six weeks.
Metrics are based on sampled traffic (sampling rate is dynamic and cannot be
adjusted).
The dashboard provides data analysis in default intervals of one hour (1H), six
hours (6H), one day (1D), one week (1W), and six weeks (6W). You can manually
request analysis in any interval from six weeks to sixty seconds.
### Metrics and resource types
This section describes the metrics and resource types for regional external passthrough Network Load Balancers.
#### Metrics
The following metrics for regional external passthrough Network Load Balancers are
[reported into Monitoring](https://docs.cloud.google.com/monitoring/api/metrics). You can use
these metric names when making [API requests](https://docs.cloud.google.com/load-balancing/docs/network/networklb-monitoring#api-requests).
| metric_name | Type | Description |
|---|---|---|
| `loadbalancing.googleapis.com/l3/external/ingress_bytes_count` | counter | The number of bytes sent from a client to a regional external passthrough Network Load Balancer backend. For TCP flows, only bytes in the application stream are counted. |
| `loadbalancing.googleapis.com/l3/external/ingress_packets_count` | counter | The number of packets sent from a client to a regional external passthrough Network Load Balancer backend. |
| `loadbalancing.googleapis.com/l3/external/egress_bytes_count` | counter | The number of bytes sent from a regional external passthrough Network Load Balancer backend to a client. For TCP flows, only bytes in the application stream are counted. |
| `loadbalancing.googleapis.com/l3/external/egress_packets_count` | counter | The number of packets sent from a regional external passthrough Network Load Balancer backend to a client. |
| `loadbalancing.googleapis.com/l3/external/rtt_latencies` | distribution | A distribution of rtt measured over TCP connections for regional external passthrough Network Load Balancer flows. Available only for TCP traffic. |
#### Resource types
Regional external passthrough Network Load Balancers use the following resource types:
- `tcp_lb_rule`
- `udp_lb_rule`
- `loadbalancing.googleapis.com/ExternalNetworkLoadBalancerRule`
A regional external passthrough Network Load Balancer can support
TCP, UDP, ESP, GRE, ICMP, and ICMPv6
traffic.
You can specify the resource type as
`tcp_lb_rule` or
`udp_lb_rule` to limit
monitored data to either TCP or UDP protocols.
You can specify the resource type as
`loadbalancing.googleapis.com/ExternalNetworkLoadBalancerRule`
to monitor all the supported protocols including
TCP, UDP, ESP, GRE, ICMP, and ICMPv6
protocols.
### Filters
Metrics are aggregated for each regional external passthrough Network Load Balancer. You can filter aggregated
metrics by the following dimensions.
#### Resource labels for `tcp_lb_rule` or `udp_lb_rule`
You can restrict your query by resource. You can also group results by these
values.
resource.label.LABEL_KEY:
| label_key | Type | Description |
|---|---|---|
| `project` | string | The identifier of the Google Cloud project associated with this resource. |
| `load_balancer_name` | string | The name of the load balancer. |
| `region` | string | The [region](https://docs.cloud.google.com/compute/docs/regions-zones) where the load balancer's backend is located---for example, `us-central1`, `europe-west1`, `asia-east1`. |
| `network_name` | string | The VPC network in which the load balancer backend resides. |
| `backend_target_type` | string | Indicates whether the regional external passthrough Network Load Balancer is target pool-based or backend service-based. Valid values are `BACKEND_SERVICE` or `TARGET_POOL`. |
| `backend_target_name` | string | For target pool-based regional external passthrough Network Load Balancers, the name of the target pool. For backend service-based regional external passthrough Network Load Balancers, the name of the backend service. |
| `forwarding_rule_name` | string | The name of the forwarding rule. |
| `forwarding_rule_network_tier` | string | The [network tier](https://docs.cloud.google.com/network-tiers/docs/overview) of the forwarding rule. |
| `backend_name` | string | The name of the backend that handled the connection. For a backend service-based regional external passthrough Network Load Balancer, the value is the name of the backend instance group or network endpoint group (NEG) that handled the connection. For a target pool-based regional external passthrough Network Load Balancer, the value is the name of the target pool. |
| `backend_type` | string | The type of backend that handled the connection. For a backend service-based regional external passthrough Network Load Balancer, the value can be either `INSTANCE_GROUP` or `NETWORK_ENDPOINT_GROUP`. For a target pool-based regional external passthrough Network Load Balancer, the value is `TARGET_POOL`. |
| `backend_scope` | string | For a backend service-based regional external passthrough Network Load Balancer, the zone or region of the backend instance group or NEG. For a target pool-based network load balancer, the value is `UNSUPPORTED_FOR_TARGET_POOL`. |
| `backend_scope_type` | string | The type of scope of the backend group that handled the connection. Valid values are `ZONE` or `REGION`. For a target pool-based network load balancer, the value is `UNSUPPORTED_FOR_TARGET_POOL`. |
| `backend_failover_configuration` | string | The failover configuration of the backend group that handled the connection. Valid values are `PRIMARY`, `BACKUP`, or `UNKNOWN`. |
| `backend_subnetwork_name` | string | The name of the subnetwork of the backend that received the connection. |
| `endpoint_zone` | string | The zone of the backend VM that handled the connection. |
#### Resource labels for `loadbalancing.googleapis.com/ExternalNetworkLoadBalancerRule`
You can restrict your query by resource. You can also group results by these
values.
resource.label.LABEL_KEY:
| label_key | Type | Description |
|---|---|---|
| `project` | string | The identifier of the Google Cloud project associated with this resource. |
| `region` | string | The [region](https://docs.cloud.google.com/compute/docs/regions-zones) where the load balancer's backend is located---for example, `us-central1`, `europe-west1`, `asia-east1`. |
| `backend_network_name` | string | The VPC network in which the load balancer backend resides. |
| `backend_target_type` | string | The type of backend target that handled the connection. Valid values are `BACKEND_SERVICE` or `TARGET_POOL`. |
| `backend_service_name` | string | The name of the backend service that handled the connection. If the `backend_target_type` is `TARGET_POOL`, then the value is `UNSUPPORTED_FOR_TARGET_POOL`. |
| `primary_target_pool` | string | The name of the primary target pool. If the `backend_target_type` is `BACKEND_SERVICE`, then the value is `UNSUPPORTED_FOR_BACKEND_SERVICE`. |
| `target_pool` | string | The name of the target pool. If the `backend_target_type` is `BACKEND_SERVICE`, then the value is `UNSUPPORTED_FOR_BACKEND_SERVICE`. |
| `forwarding_rule_name` | string | The name of the regional external passthrough Network Load Balancer's forwarding rule. |
| `backend_group_name` | string | The name of the backend group that handled the connection. If the `backend_target_type` is `TARGET_POOL`, then the value is `UNSUPPORTED_FOR_TARGET_POOL`. |
| `backend_group_type` | string | The type of backend group that handled the connection. If the `backend_target_type` is `BACKEND_SERVICE`, then the value is either `INSTANCE_GROUP` or `NETWORK_ENDPOINT_GROUP`. If the `backend_target_type` is `TARGET_POOL`, then the value is `UNSUPPORTED_FOR_TARGET_POOL`. |
| `backend_group_scope` | string | The scope of the backend group (name of the zone or region) that handled the connection. If the `backend_target_type` is `TARGET_POOL`, then the value is `UNSUPPORTED_FOR_TARGET_POOL`. |
| `backend_subnetwork_name` | string | The name of the subnetwork of the backend that received the connection. |
| `backend_zone` | string | The zone of the backend VM that handled the connection. |
#### Metric labels
You can restrict your query by metric label. You can also group results by these
values.
metric.label.LABEL_KEY:
| label_key | Type | Description |
|---|---|---|
| `client_country` | string | The country of the client that initiated the connection to the regional external passthrough Network Load Balancer. |
| `client_continent` | string | The continent of the client that initiated the connection to the regional external passthrough Network Load Balancer. |
| `protocol` | string | The protocol in the connection for the `loadbalancing.googleapis.com/ExternalNetworkLoadBalancerRule` resource. This field is left blank for the `tcp_lb_rule` and `udp_lb_rule` resources. |
### Monitoring API requests
You can construct arbitrary queries over regional external passthrough Network Load Balancer metrics
by using the
[Monitoring API\`s v3 projects.timeSeries.list request](https://docs.cloud.google.com/monitoring/api/ref_v3/rest/v3/projects.timeSeries/list).
The exact structure of the various definitions follows the generic
[monitoring filters](https://docs.cloud.google.com/monitoring/api/v3/filters)
semantics.
#### Example API requests
- Get all bytes sent from all regional external passthrough Network Load Balancers in the project during 12:00-12:02 PM UTC on 2019-07-01
with 1m aggregates.
[timeSeries.list](https://docs.cloud.google.com/monitoring/api/ref_v3/rest/v3/projects.timeSeries/list)
parameters:
- **name:** projects/`PROJECT_ID`
- **Filter:** `resource.type = "tcp_lb_rule"` AND `metric.name="loadbalancing.googleapis.com/l3/external/egress_bytes_count"`
- **interval.start_time:** `2019-07-01T12:00:00Z`
- **interval.end_time:** `2019-07-01T12:02:00Z`
- **aggregation.alignmentPeriod:** `60s`
- **aggregation.crossSeriesReducer:** `REDUCE_SUM`
- **aggregation.perSeriesAligner:** `ALIGN_SUM`
- Get median RTT measurement over all regional external passthrough Network Load Balancers in the
project during 12:19-12:20 PM UTC on 2019-07-01, broken down by client country.
[timeSeries.list](https://docs.cloud.google.com/monitoring/api/ref_v3/rest/v3/projects.timeSeries/list)
parameters:
- **name:** projects/`PROJECT_ID`
- **Filter:** `resource.type = "tcp_lb_rule"` AND `metric.name="loadbalancing.googleapis.com/l3/external/rtt_latencies"`
- **interval.start_time:** `2019-07-01T12:19:00Z`
- **interval.end_time:** `2019-07-01T12:20:00Z`
- **aggregation.alignmentPeriod:** `60s`
- **aggregation.crossSeriesReducer:** `REDUCE_SUM`
- **aggregation.groupByFields:** `metric.label.client_country`
- **aggregation.perSeriesAligner:** `ALIGN_PERCENTILE_50`
- Get total bytes from a specific regional external passthrough Network Load Balancer during
12:19-12:20 PM UTC on 2019-07-01, broken down by endpoint zone and client continent.
[timeSeries.list](https://docs.cloud.google.com/monitoring/api/ref_v3/rest/v3/projects.timeSeries/list)
parameters:
- **name:** projects/`PROJECT_ID`
- **Filter:** `resource.type = "tcp_lb_rule"` AND `resource.label.load_balancer_name = "netlb-bs-1"` AND `metric.name="loadbalancing.googleapis.com/l3/external/ingress_bytes_count"`
- **interval.start_time:** `2019-07-01T12:19:00Z`
- **interval.end_time:** `2017-07-01T12:20:00Z`
- **aggregation.alignmentPeriod:** `60s`
- **aggregation.crossSeriesReducer:** `REDUCE_SUM`
- **aggregation.groupByFields:** `metric.label.client_continent`
- **aggregation.groupByFields:** `resource.label.endpoint_zone`
- **aggregation.perSeriesAligner:** `ALIGN_SUM`
## What's next
- Read [conceptual information about regional external passthrough Network Load Balancers](https://docs.cloud.google.com/load-balancing/docs/network)
- [Set up a regional external passthrough Network Load Balancer](https://docs.cloud.google.com/load-balancing/docs/network/setting-up-network)
- Read about Monitoring [Metrics, time series, and resources](https://docs.cloud.google.com/monitoring/api/v3/metrics)
- Read about [forwarding rules](https://docs.cloud.google.com/load-balancing/docs/forwarding-rule-concepts)
- Read about [troubleshoot logging issues](https://docs.cloud.google.com/load-balancing/docs/network/troubleshooting-networklb#troubleshoot-logs)