This tutorial explains how you can reduce costs by deploying a scheduled
autoscaler on Google Kubernetes Engine (GKE). This kind of autoscaler scales
clusters up or down according to a schedule based on time of day or day of the
week. A scheduled autoscaler is useful if your traffic has a predictable ebb and
flow---for example, if you are a regional retailer, or if your software is for
employees whose working hours are limited to a specific part of the day.
The tutorial is for developers and operators who want to reliably scale up
clusters before spikes arrive, and scale them down again to save money at night,
on weekends, or any other time when fewer users are online. The article assumes
you are familiar with Docker, Kubernetes, Kubernetes CronJobs,
GKE, and Linux.
## Introduction
Many applications experience uneven traffic patterns. For example, workers in
an organization might engage with an application only during the day. As a
result, data center servers for that application are idle at night.
Beyond other benefits, Google Cloud can help you save money by dynamically
allocating infrastructure according to traffic load. In some cases, a simple
autoscale configuration can manage the allocation challenge of uneven traffic.
If that's your case, stick with it. However, in other cases, sharp changes in
traffic patterns require more finely tuned autoscale configurations to avoid
system instability during scale-ups and to avoid overprovisioning the cluster.
This tutorial focuses on scenarios where sharp changes in traffic patterns are
well understood, and you want to give hints to the autoscaler that your
infrastructure is about to experience spikes. This document shows how to scale
GKE clusters up in the morning and down at night, but you
can use a similar approach to increase and decrease capacity for any known
events, such as peak scale events, ad campaigns, or weekend traffic.
### Scaling down a cluster if you have committed use discounts
This tutorial explains how to reduce costs by scaling down your
GKE clusters to the minimum during off-peak hours. However,
if you've purchased a
[committed use discount](https://docs.cloud.google.com/compute/docs/instances/signing-up-committed-use-discounts.md.txt),
it's important to understand how these discounts work in conjunction with
autoscaling.
> [!NOTE]
> **Note:** If you don't have any committed use contracts and you don't plan to purchase any, you can skip this section.
Committed use contracts give you deeply discounted prices when you commit to
paying for a set quantity of resources (vCPUs, memory, and others). However, to
determine the quantity of resources to commit, you need to know in advance how
many resources your workloads use over time. To help you to reduce your costs,
the following diagram illustrates which resources you should and should not
include in your planning.
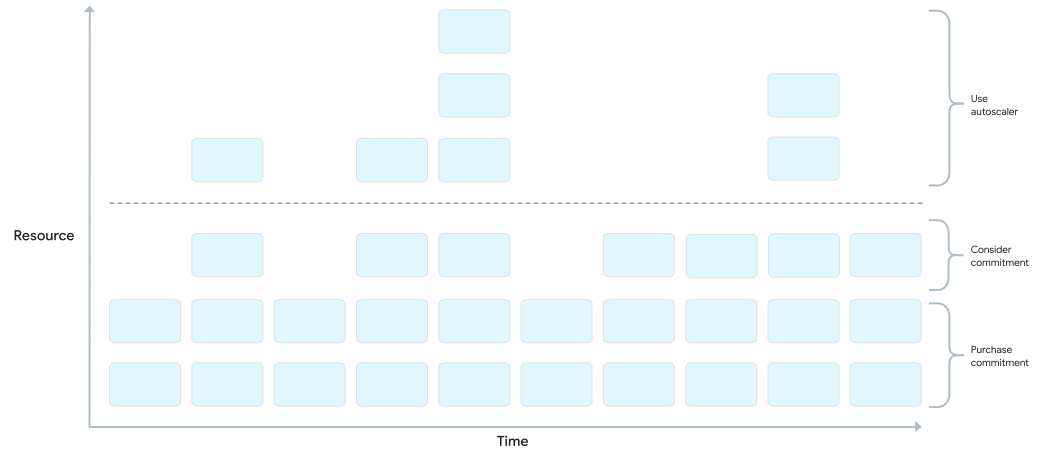
As the diagram shows, allocation of resources under a committed use contract is
flat. Resources covered by the contract must be in use most of the time to be
worth the commitment you've made. Therefore, you should not include resources
that are used during spikes in calculating your committed resources. For spiky
resources, we recommend that you use GKE autoscaler
options. These options include the scheduled autoscaler discussed in this
paper or other managed options that are discussed in
[Best practices for running cost-optimized Kubernetes applications on GKE](https://docs.cloud.google.com/architecture/best-practices-for-running-cost-effective-kubernetes-applications-on-gke.md.txt#fine-tune_gke_autoscaling).
If you already have a committed use contract for a given amount of resources,
you don't reduce your costs by scaling down your cluster below that minimum. In
such scenarios, we recommend that you try to schedule some jobs to fill the gaps
during periods of low computing demand.
## Architecture
The following diagram shows the architecture for the infrastructure and
scheduled autoscaler that you deploy in this tutorial. The scheduled autoscaler
consists of a set of components that work together to manage scaling based on a
schedule.
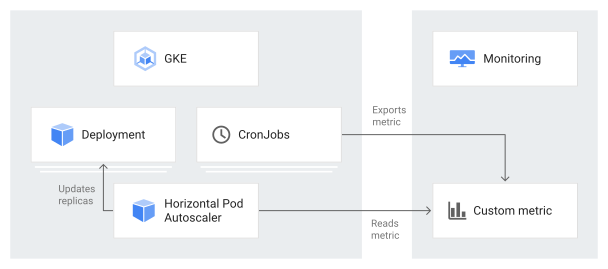
In this architecture, a set of Kubernetes
[CronJobs](https://kubernetes.io/docs/concepts/workloads/controllers/cron-jobs/)
export known information about traffic patterns to a
[Cloud Monitoring custom metric](https://docs.cloud.google.com/monitoring/custom-metrics.md.txt).
This data is then read by a Kubernetes
[Horizontal Pod Autoscaler (HPA)](https://kubernetes.io/docs/tasks/run-application/horizontal-pod-autoscale/)
as input into when the HPA should scale your workload. Along with other
load metrics, such as target CPU utilization, the HPA decides how to scale
the replicas for a given deployment.
## Objectives
- Create a GKE cluster.
- Deploy an example application that uses a Kubernetes HPA.
- Set up the components for the scheduled autoscaler and update your HPA to read from a scheduled custom metric.
- Set up an alert to trigger when your scheduled austoscaler is not working properly.
- Generate load to the application.
- Examine how the HPA responds to normal increases in traffic and to the scheduled custom metrics that you configure.
The code for this tutorial is in a GitHub repository.
## Costs
In this document, you use the following billable components of Google Cloud:
- [Cloud Monitoring](https://docs.cloud.google.com/monitoring/pricing)
- [Artifact Registry](https://docs.cloud.google.com/artifact-registry/pricing)
- [Google Kubernetes Engine](https://docs.cloud.google.com/kubernetes-engine/pricing)
To generate a cost estimate based on your projected usage,
use the [pricing calculator](https://docs.cloud.google.com/products/calculator).
New Google Cloud users might be eligible for a [free trial](https://docs.cloud.google.com/free).
## Before you begin
## Prepare your environment
1.
In the Google Cloud console, activate Cloud Shell.
[Activate Cloud Shell](https://console.cloud.google.com/?cloudshell=true)
At the bottom of the Google Cloud console, a
[Cloud Shell](https://docs.cloud.google.com/shell/docs/how-cloud-shell-works.md.txt)
session starts and displays a command-line prompt. Cloud Shell is a shell environment
with the Google Cloud CLI
already installed and with values already set for
your current project. It can take a few seconds for the session to initialize.
2. In Cloud Shell, configure your Google Cloud project ID, your
email address, and your computing zone and region:
```bash
PROJECT_ID=YOUR_PROJECT_ID
ALERT_EMAIL=YOUR_EMAIL_ADDRESS
gcloud config set project $PROJECT_ID
gcloud config set compute/region us-central1
gcloud config set compute/zone us-central1-f
```
Replace the following:
- `YOUR_PROJECT_ID`: the Google Cloud project name for the project you're using.
- `YOUR_EMAIL_ADDRESS`: an email address for being notified when the scheduled autoscaler is not working as properly.
You can
[choose a different region and zone](https://docs.cloud.google.com/compute/docs/regions-zones.md.txt)
for this tutorial if you want.
3. Clone the `kubernetes-engine-samples` GitHub repository:
```bash
git clone https://github.com/GoogleCloudPlatform/kubernetes-engine-samples/
cd kubernetes-engine-samples/cost-optimization/gke-scheduled-autoscaler
```
The code in this example is structured into the following folders:
- Root: Contains the code that's used by the CronJobs to export custom metrics to Cloud Monitoring.
- `k8s/`: Contains a deployment example that has a Kubernetes HPA.
- `k8s/scheduled-autoscaler/`: Contains the CronJobs that export a custom metric and an updated version of the HPA to read from a custom metric.
- `k8s/load-generator/`: Contains a Kubernetes Deployment that has an application to simulate hourly usage. A *Deployment* is a Kubernetes API object that lets you run multiple replicas of Pods that are distributed among the nodes in a cluster..
- `monitoring/`: Contains the Cloud Monitoring components that you configure in this tutorial.
## Create the GKE cluster
1. In Cloud Shell, create a GKE cluster for
running the scheduled autoscaler:
```bash
gcloud container clusters create scheduled-autoscaler \
--enable-ip-alias \
--release-channel=stable \
--machine-type=e2-standard-2 \
--enable-autoscaling --min-nodes=1 --max-nodes=10 \
--num-nodes=1 \
--autoscaling-profile=optimize-utilization
```
The output is similar to the following:
NAME LOCATION MASTER_VERSION MASTER_IP MACHINE_TYPE NODE_VERSION NUM_NODES STATUS
scheduled-autoscaler us-central1-f 1.22.15-gke.100 34.69.187.253 e2-standard-2 1.22.15-gke.100 1 RUNNING
This is not a production configuration, but it's a configuration that's
suitable for this tutorial. In this setup, you configure the
[cluster autoscaler](https://docs.cloud.google.com/kubernetes-engine/docs/concepts/cluster-autoscaler.md.txt)
with a minimum of 1 node and a maximum of 10 nodes. You also enable the
[`optimize-utilization`](https://docs.cloud.google.com/kubernetes-engine/docs/concepts/cluster-autoscaler.md.txt#autoscaling_profiles)
profile to speed up the process of scaling down.
## Deploy the example application
1. Deploy the example application without the scheduled autoscaler:
```bash
kubectl apply -f ./k8s
```
2. Open the `k8s/hpa-example.yaml` file.
The following listing shows the content of the file.
```yaml
spec:
maxReplicas: 20
minReplicas: 10
scaleTargetRef:
apiVersion: apps/v1
kind: Deployment
name: php-apache
metrics:
- type: Resource
resource:
name: cpu
target:
type: Utilization
averageUtilization: 60
```
Notice that the minimum number of replicas (`minReplicas`) is set to 10.
This configuration also sets the cluster to scale based on CPU utilization
(the `name: cpu` and `type: Utilization` settings).
3. Wait for the application to become available:
```bash
kubectl wait --for=condition=available --timeout=600s deployment/php-apache
EXTERNAL_IP=''
while [ -z $EXTERNAL_IP ]
do
EXTERNAL_IP=$(kubectl get svc php-apache -o jsonpath={.status.loadBalancer.ingress[0].ip})
[ -z $EXTERNAL_IP ] && sleep 10
done
curl -w '\n' http://$EXTERNAL_IP
```
When the application is available, the output is as follows:
OK!
4. Verify the settings:
```bash
kubectl get hpa php-apache
```
The output is similar to the following:
NAME REFERENCE TARGETS MINPODS MAXPODS REPLICAS AGE
php-apache Deployment/php-apache 9%/60% 10 20 10 6d19h
The `REPLICAS` column displays `10`, which matches the value of the
`minReplicas` field in the `hpa-example.yaml` file.
5. Check whether the number of nodes has increased to 4:
```bash
kubectl get nodes
```
The output is similar to the following:
NAME STATUS ROLES AGE VERSION
gke-scheduled-autoscaler-default-pool-64c02c0b-9kbt Ready <none> 21S v1.17.9-gke.1504
gke-scheduled-autoscaler-default-pool-64c02c0b-ghfr Ready <none> 21s v1.17.9-gke.1504
gke-scheduled-autoscaler-default-pool-64c02c0b-gvl9 Ready <none> 21s v1.17.9-gke.1504
gke-scheduled-autoscaler-default-pool-64c02c0b-t9sr Ready <none> 21s v1.17.9-gke.1504
When you created the cluster, you set a minimum configuration using the
`min-nodes=1` flag. However, the application that you deployed at the
beginning of this procedure is requesting more infrastructure because
`minReplicas` in the `hpa-example.yaml` file is set to 10.
Setting `minReplicas` to a value like 10 is a common strategy used by
companies such as retailers, which expect a sudden increase in traffic in
the first few hours of the business day. However, setting high values for
HPA `minReplicas` can increase your costs because the cluster can't shrink,
not even at night when application traffic is low.
## Set up a scheduled autoscaler
1. In Cloud Shell, install the
[Custom Metrics - Cloud Monitoring adapter](https://github.com/GoogleCloudPlatform/k8s-stackdriver/tree/master/custom-metrics-stackdriver-adapter)
in your GKE cluster:
```bash
kubectl apply -f https://raw.githubusercontent.com/GoogleCloudPlatform/k8s-stackdriver/master/custom-metrics-stackdriver-adapter/deploy/production/adapter_new_resource_model.yaml
kubectl wait --for=condition=available --timeout=600s deployment/custom-metrics-stackdriver-adapter -n custom-metrics
```
This adapter enables Pod autoscaling based on Cloud Monitoring custom
metrics.
2. Create a repository in Artifact Registry and give read permissions:
gcloud artifacts repositories create gke-scheduled-autoscaler \
--repository-format=docker --location=us-central1
gcloud auth configure-docker us-central1-docker.pkg.dev
gcloud artifacts repositories add-iam-policy-binding gke-scheduled-autoscaler \
--location=us-central1 --member=allUsers --role=roles/artifactregistry.reader
3. Build and push the custom metric exporter code:
```bash
docker build -t us-central1-docker.pkg.dev/$PROJECT_ID/gke-scheduled-autoscaler/custom-metric-exporter .
docker push us-central1-docker.pkg.dev/$PROJECT_ID/gke-scheduled-autoscaler/custom-metric-exporter
```
4. Deploy the CronJobs that export custom metrics and deploy the updated
version of the HPA that reads from these custom metrics:
```bash
sed -i.bak s/PROJECT_ID/$PROJECT_ID/g ./k8s/scheduled-autoscaler/scheduled-autoscale-example.yaml
kubectl apply -f ./k8s/scheduled-autoscaler
```
5. Open and examine the
`k8s/scheduled-autoscaler/scheduled-autoscale-example.yaml` file.
The following listing shows the content of the file.
```yaml
apiVersion: batch/v1
kind: CronJob
metadata:
name: scale-up
spec:
schedule: "50-59/1 * * * *"
jobTemplate:
spec:
template:
spec:
containers:
- name: custom-metric-extporter
image: us-central1-docker.pkg.dev/PROJECT_ID/gke-scheduled-autoscaler/custom-metric-exporter
command:
- /export
- --name=scheduled_autoscaler_example
- --value=10
restartPolicy: OnFailure
backoffLimit: 1
---
apiVersion: batch/v1
kind: CronJob
metadata:
name: scale-down
spec:
schedule: "1-49/1 * * * *"
jobTemplate:
spec:
template:
spec:
containers:
- name: custom-metric-extporter
image: us-central1-docker.pkg.dev/PROJECT_ID/gke-scheduled-autoscaler/custom-metric-exporter
command:
- /export
- --name=scheduled_autoscaler_example
- --value=1
restartPolicy: OnFailure
backoffLimit: 1
```
This configuration specifies that the CronJobs should export the
suggested Pod replicas count to a custom metric called
`custom.googleapis.com/scheduled_autoscaler_example` based on the time of
day. To facilitate the monitoring section of this tutorial, the
schedule field configuration defines hourly scale-ups and scale-downs. For
production, you can customize this schedule to match your business needs.
6. Open and examine the `k8s/scheduled-autoscaler/hpa-example.yaml` file.
The following listing shows the contents of the file.
```yaml
spec:
maxReplicas: 20
minReplicas: 1
scaleTargetRef:
apiVersion: apps/v1
kind: Deployment
name: php-apache
metrics:
- type: Resource
resource:
name: cpu
target:
type: Utilization
averageUtilization: 60
- type: External
external:
metric:
name: custom.googleapis.com|scheduled_autoscaler_example
target:
type: AverageValue
averageValue: 1
```
This configuration specifies that the HPA object should replace the HPA
that was deployed earlier. Notice that the configuration reduces the value
in `minReplicas` to 1. This means that the workload can be scaled down to
its minimum. The configuration also adds an
[external metric](https://kubernetes.io/docs/tasks/run-application/horizontal-pod-autoscale-walkthrough/#autoscaling-on-metrics-not-related-to-kubernetes-objects)
(`type: External`). This addition means that autoscaling is now triggered
by two factors.
In this multiple-metrics scenario, the HPA calculates a proposed replica
count for each metric and then chooses the metric that returns the highest
value. It's important to understand this---your scheduled autoscaler can
propose that at a given moment the Pod count should be 1. But if the actual
CPU utilization is higher than expected for one Pod, the HPA creates more
replicas.
7. Check the number of nodes and HPA replicas again by running each of
these commands again:
```bash
kubectl get nodes
kubectl get hpa php-apache
```
The output you see depends on what the scheduled autoscaler has done
recently---in particular, the values of `minReplicas` and `nodes` will be
different at different points in the scaling cycle.
For example, at approximately minutes 51 to 60 of each hour (which
represents a period of peak traffic), the HPA value for `minReplicas` will be
10 and the value of `nodes` will be 4.
In contrast, for minutes 1 to 50 (which represents a period of lower
traffic), the HPA `minReplicas` value will be 1 and the `nodes` value will
be either 1 or 2, depending on how many Pods have been allocated and
removed. For the lower values (minutes 1 to 50), it might take up to 10
minutes for the cluster to finish scaling down.
## Configure alerts for when the scheduled autoscaler is not working properly
In a production environment, you typically want to know when CronJobs are not
populating the custom metric. For this purpose, you can create an alert that
triggers when any `custom.googleapis.com/scheduled_autoscaler_example` stream is
absent for a five-minute period.
1. In Cloud Shell, create a notification channel:
```bash
gcloud beta monitoring channels create \
--display-name="Scheduled Autoscaler team (Primary)" \
--description="Primary contact method for the Scheduled Autoscaler team lead" \
--type=email \
--channel-labels=email_address=${ALERT_EMAIL}
```
The output is similar to the following:
Created notification channel NOTIFICATION_CHANNEL_ID.
This command creates a
[notification channel](https://docs.cloud.google.com/monitoring/alerts/using-channels-api.md.txt#ncd)
of type `email` to simplify the tutorial steps. In production environments,
we recommend that you use a less asynchronous strategy by setting the
notification channel to `sms` or `pagerduty`.
2. Set a variable that has the value that was displayed in the
`NOTIFICATION_CHANNEL_ID` placeholder:
```bash
NOTIFICATION_CHANNEL_ID=NOTIFICATION_CHANNEL_ID
```
3. Deploy the alert policy:
```bash
gcloud monitoring policies create \
--policy-from-file=./monitoring/alert-policy.yaml \
--notification-channels=$NOTIFICATION_CHANNEL_ID
```
The `alert-policy.yaml` file contains the specification to send an alert
if the metric is absent after five minutes.
4. Go to the Cloud Monitoring **Alerting** page to view the alert policy.
[Go to Alerting](https://console.cloud.google.com/monitoring/alerting)
5. Click **Scheduled Autoscaler Policy** and verify the details of the
alert policy.
## Generate load to the example application
- In Cloud Shell, deploy the load generator:
```bash
kubectl apply -f ./k8s/load-generator
```
The following listing shows the `load-generator` script:
```bash
command: ["/bin/sh", "-c"]
args:
- while true; do
RESP=$(wget -q -O- http://php-apache.default.svc.cluster.local);
echo "$(date +%H)=$RESP";
sleep $(date +%H | awk '{ print "s("$0"/3*a(1))*0.5+0.5" }' | bc -l);
done;
```
This script runs in your cluster until you delete the `load-generator`
deployment. It makes requests to your `php-apache` service every few
milliseconds. The `sleep` command simulates load-distribution changes
during the day. By using a script that generates traffic in this way, you
can understand what happens when you combine CPU utilization and custom
metrics in your HPA configuration.
## Visualize scaling in response to traffic or scheduled metrics
In this section, you review visualizations that show you the effects of
scaling up and scaling down.
1. In Cloud Shell, create a new dashboard:
```bash
gcloud monitoring dashboards create \
--config-from-file=./monitoring/dashboard.yaml
```
2. Go to the Cloud Monitoring **Dashboards** page:
[Go to Dashboards](https://console.cloud.google.com/monitoring/dashboards)
3. Click **Scheduled Autoscaler Dashboard**.
The dashboard displays three graphs. You need to wait at least 2 hours
(ideally, 24 hours or more) to see the dynamics of scale-ups and
scale-downs, and to see how different load distribution during the day
affects autoscaling.
> [!NOTE]
> **Note:** Be aware that you will be billed for the resources that are running while you test.
To give you an idea of what the graphs show, you can study the following
graphs, which present a full-day view:
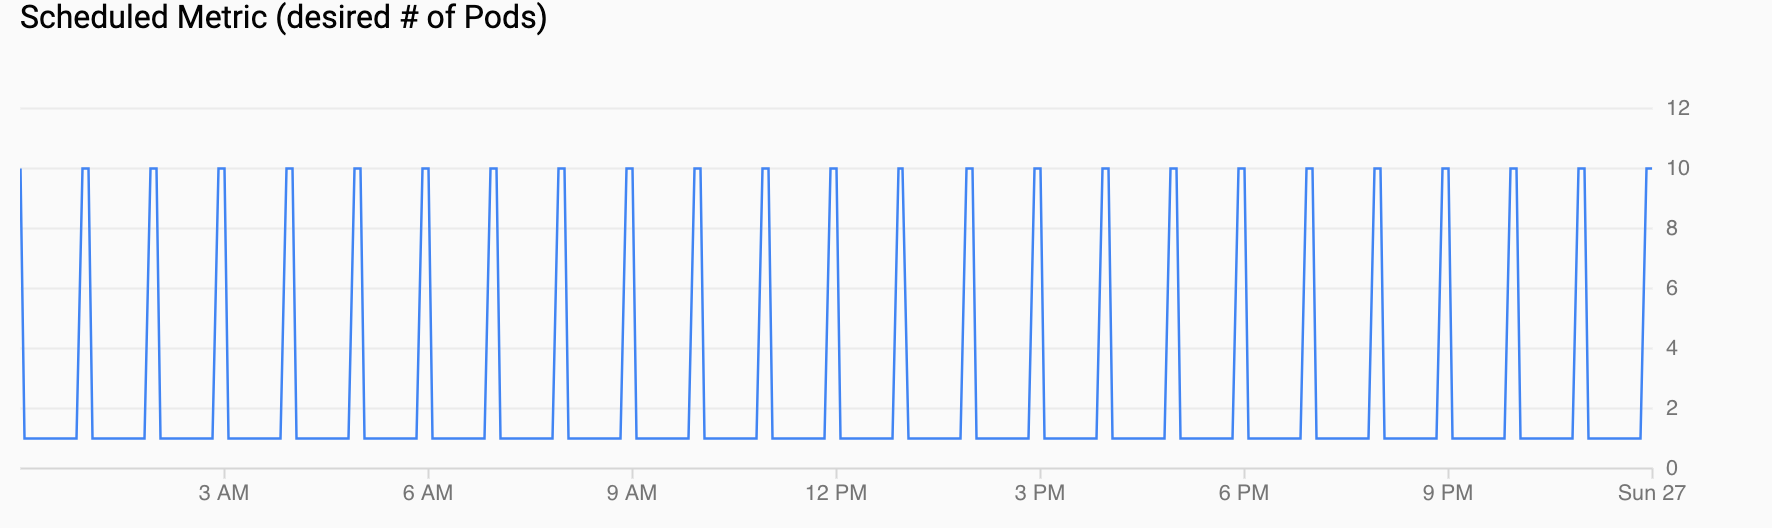
- **Scheduled Metric (desired # of Pods)** shows a time series of the
custom metric that's being exported to Cloud Monitoring through CronJobs
that you configured in
[Setting up a scheduled autoscaler](https://docs.cloud.google.com/kubernetes-engine/docs/tutorials/reducing-costs-by-scaling-down-gke-off-hours.md.txt#setting-up-a-scheduled-autoscaler).
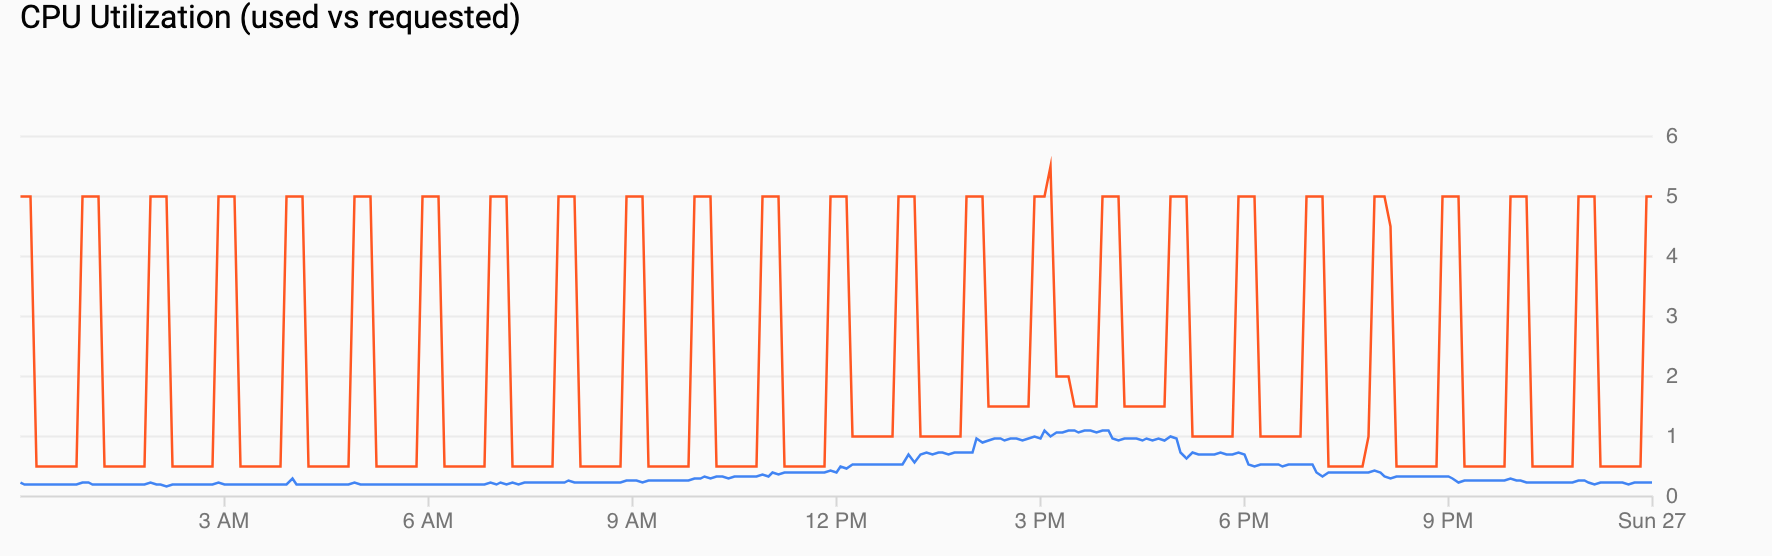
- **CPU Utilization (requested vs used)** shows a time series of
requested CPU (red) and actual CPU utilization (blue). When the load is
low, the HPA honors the utilization decision by the scheduled autoscaler.
However, when traffic increases, the HPA increases the number of Pods as
needed, as you can see for the data points between 12 PM and 6 PM.
- **Number of Pods (scheduled vs actual) + Mean CPU Utilization** shows a
view similar to the previous ones. The Pod count (red) increases to 10
every hour as scheduled (blue). Pod count naturally increases and
decreases over time in response to load (12 PM and 6 PM). Average CPU
utilization (orange) remains below the target that you set (60%).

## Clean up
To avoid incurring charges to your Google Cloud account for the resources used in this
tutorial, either delete the project that contains the resources, or keep the project and
delete the individual resources.
### Delete the project
> [!CAUTION]
> **Caution** : Deleting a project has the following effects:
>
> - **Everything in the project is deleted.** If you used an existing project for the tasks in this document, when you delete it, you also delete any other work you've done in the project.
> - **Custom project IDs are lost.** When you created this project, you might have created a custom project ID that you want to use in the future. To preserve the URLs that use the project ID, such as an `appspot.com` URL, delete selected resources inside the project instead of deleting the whole project.
>
>
> If you plan to explore multiple architectures, tutorials, or quickstarts, reusing projects
> can help you avoid exceeding project quota limits.
1. In the Google Cloud console, go to the **Manage resources** page.
[Go to Manage resources](https://console.cloud.google.com/iam-admin/projects)
2. In the project list, select the project that you want to delete, and then click **Delete**.
3. In the dialog, type the project ID, and then click **Shut down** to delete the project.
## What's next
- Learn more about GKE cost optimization in [Best practices for running cost-optimized Kubernetes applications on GKE](https://docs.cloud.google.com/architecture/best-practices-for-running-cost-effective-kubernetes-applications-on-gke.md.txt).
- Find design recommendations and best practices to optimize the cost of Google Cloud workloads in [Google Cloud Well-Architected Framework: Cost optimization](https://docs.cloud.google.com/architecture/cost-efficiency-on-google-cloud).
- Explore reference architectures, diagrams, and best practices about Google Cloud. Take a look at our [Cloud Architecture Center](https://docs.cloud.google.com/architecture).