This page shows you how to view infrastructure and application health metrics
for your Google Kubernetes Engine (GKE) clusters and workloads. These metrics can
help [troubleshoot issues](https://docs.cloud.google.com/kubernetes-engine/docs/how-to/view-observability-metrics.md.txt#interpret) with your GKE
clusters and workloads.
## Requirements
- The [GKE Node Service Agent](https://docs.cloud.google.com/iam/docs/service-agents.md.txt#kubernetes-engine-node-service-agent), which has the format `service-PROJECT_NUMBER@gcp-sa-gkenode.iam.gserviceaccount.com`, must be granted the [Kubernetes Default Node Service Agent role](https://docs.cloud.google.com/iam/docs/roles-permissions/container.md.txt#container.defaultNodeServiceAgent) on your project.
- You must have [system metrics](https://docs.cloud.google.com/kubernetes-engine/docs/how-to/configure-metrics.md.txt#system-metrics) enabled on your clusters to use the overview metrics in the **Observability** tab. System metrics are *always* enabled in Autopilot clusters and are enabled *by default* in Standard clusters.
- You must have [control plane metrics](https://docs.cloud.google.com/kubernetes-engine/docs/how-to/control-plane-metrics.md.txt) enabled on your clusters to use the control plane metrics in the **Observability** tab. If you select **Control plane** on the **Observability** tab for your cluster, and the metrics aren't enabled, then you see notification that the metrics aren't enabled. You can enable them by clicking **Enable package** . For information about other ways to enable control plane metrics, see [Configuring collection of control plane metrics](https://docs.cloud.google.com/kubernetes-engine/docs/how-to/control-plane-metrics.md.txt#enable-control-plane-metrics).
- You must have [kube state metrics](https://docs.cloud.google.com/kubernetes-engine/docs/how-to/kube-state-metrics.md.txt) enabled on your clusters to view the workload state metrics and persistent storage metrics in **Observability** tab on the cluster details page. For more information about ingesting metrics from a self-deployed kube state metrics collector, see [Kube state Metrics](https://docs.cloud.google.com/stackdriver/docs/managed-prometheus/exporters/kube_state_metrics.md.txt) in the Google Cloud Observability documentation.
- Your application must have a way to send the metrics to Cloud Monitoring to view application performance metrics. For information about recommended approaches, see [Collect application performance metrics](https://docs.cloud.google.com/kubernetes-engine/docs/how-to/app-performance-metrics.md.txt#app-perf-ingest).
- You must have [NVIDIA Data Center GPU Manager (DCGM) metrics](https://docs.cloud.google.com/kubernetes-engine/docs/how-to/dcgm-metrics.md.txt) enabled on the cluster and Google Managed GPU drivers must be installed on the cluster node pools to use the DCGM metrics on the **Observability** tab for your cluster.
- You must have the [cAdvisor/Kubelet](https://docs.cloud.google.com/kubernetes-engine/docs/how-to/cadvisor-kubelet-metrics.md.txt) metrics enabled on your clusters to use the cAdvisor/Kubelet charts on the **Observability** tab for your cluster.
## Required roles
To get the permissions that
you need to view and manage observability dashboards for GKE,
ask your administrator to grant you the
following IAM roles on your project:
- [Kubernetes Engine Viewer](https://docs.cloud.google.com/iam/docs/roles-permissions/container.md.txt#container.viewer) (`roles/container.viewer`)
- View predefined dashboards for GKE clusters and workloads:
- [Monitoring Dashboards Configuration Viewer](https://docs.cloud.google.com/iam/docs/roles-permissions/monitoring.md.txt#monitoring.dashboardViewer) (`roles/monitoring.dashboardViewer`)
- [Monitoring Viewer](https://docs.cloud.google.com/iam/docs/roles-permissions/monitoring.md.txt#monitoring.viewer) (`roles/monitoring.viewer`)
- Create customized dashboards for GKE clusters and workloads: [Monitoring Dashboard Configuration Editor](https://docs.cloud.google.com/iam/docs/roles-permissions/monitoring.md.txt#monitoring.dashboardEditor) (`roles/monitoring.dashboardEditor`)
- View dashboards and playbooks in Cloud Monitoring: [Monitoring Viewer](https://docs.cloud.google.com/iam/docs/roles-permissions/monitoring.md.txt#monitoring.viewer) (`roles/monitoring.viewer`)
For more information about granting roles, see [Manage access to projects, folders, and organizations](https://docs.cloud.google.com/iam/docs/granting-changing-revoking-access.md.txt).
You might also be able to get
the required permissions through [custom
roles](https://docs.cloud.google.com/iam/docs/creating-custom-roles) or other [predefined
roles](https://docs.cloud.google.com/iam/docs/roles-overview#predefined).
## Observability metrics
In the **Observability** tab in the Google Cloud console, you can view performance
metrics for clusters and workloads.
### Metrics for clusters and workloads
The following metrics are available for both clusters and workloads:
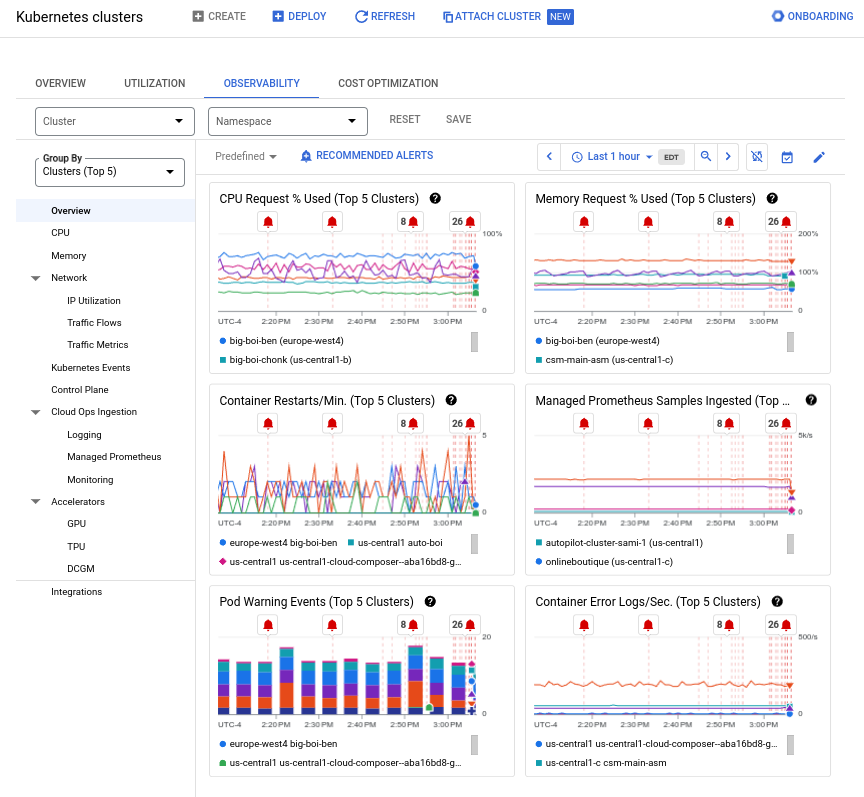
- **Overview:** Shows summary infrastructure health metrics such as CPU and memory request utilization, error logs, and warning events.
- **CPU:** Shows CPU and core request utilization.
- **Memory:** Shows memory request utilization.
- **cAdvisor:** Shows cAdvisor metrics, which include infrastructure-health metrics for CPU, memory usage, file system, and network statistics.
- **Startup Latency** : Shows the startup latency of your nodes and Deployments. Startup latency metrics include Node and Pod startup times, Horizontal Pod Autoscaler (HPA) recommendation latency, and image pull events, for tracking, troubleshooting, and optimizing your workload's startup time. For more information, see [Monitor startup latency metrics](https://docs.cloud.google.com/kubernetes-engine/docs/how-to/monitor-startup-latency-metrics.md.txt).
The following metrics are available for clusters:
- **Kubernetes Events:** Provides visibility into event counts over time and a detailed log of events.
- **Control plane:** Provides visibility into the health of Kubernetes control plane components such as the kube-apiserver and scheduler. Also provides information such as the number of unschedulable pods. Pods in the unschedulable state were attempted for scheduling and have been determined to be unschedulable. Pods in this state are a sign that nothing in the cluster has changed that would make them schedulable.
- **Cloud Ops Ingestion:** Provides visibility into the amount of logging and metrics ingestion which correlate to cost. For more information, see [Google Cloud Observability pricing](https://cloud.google.com/stackdriver/pricing).
- **Ephemeral** : (available on the **Observability** tab for a chosen cluster): Provides visibility into ephemeral storage used by a cluster so that you can determine if the cluster's storage is being used efficiently. On the **Observability** tab's **Overview** page, a chart shows the ephemeral storage used by the cluster, and the **Ephemeral** page shows additional metrics, including capacity, throughput, rate of I/O operations, and others. Some of these metrics are not available for Autopilot clusters.
- **Persistent**: Provides visibility into Persistent Volumes and Persistent Volume Claims.
- **Workloads state**: Provides visibility into the following resource types: Pod, Deployment, StatefulSet, DaemonSet, and Horizontal Pod Autoscaler.
- **GPU** (a subset of [GKE system
metrics](https://docs.cloud.google.com/kubernetes-engine/docs/how-to/configure-metrics#system-metrics), populated only for [clusters with GPU nodes](https://docs.cloud.google.com/kubernetes-engine/docs/concepts/gpus.md.txt)): Provides visibility into utilization of GPU resources, including utilization by GPU model and summaries of the five nodes with the highest and lowest resource utilization.
- **TPU** : Provides visibility into the utilization of Tensor Processing Unit (TPU) resources in GKE clusters. TPU metrics are part of [GKE system metrics](https://docs.cloud.google.com/kubernetes-engine/docs/how-to/configure-metrics.md.txt#system-metrics). However, GKE populates these metrics only for clusters with [TPU resources](https://docs.cloud.google.com/kubernetes-engine/docs/concepts/tpus.md.txt).
- **DCGM**: Provides visibility into the NVIDIA GPU resources in GKE clusters.
- **cAdvisor:** Shows cAdvisor metrics, including container-based metrics for CPU, memory usage, file system, and network statistics.
- **Kubelet:** Shows metrics for the kubelet agent that runs on each node.
### Interpret observability metrics
Metrics can help you troubleshoot issues. For GKE clusters,
examples include:
- High CPU or memory request utilization trends might indicate that you should configure containers in a cluster or namespace to use fewer resources.
- High container restart counts might indicate containers are crashing.
- A high number of unschedulable Pods indicates insufficient resources or configuration errors. For more information, see [Troubleshooting unschedulable Pods](https://docs.cloud.google.com/kubernetes-engine/docs/troubleshooting.md.txt#PodUnschedulable).
- High Cloud Logging or Google Cloud Managed Service for Prometheus ingestion correlates with Google Cloud Observability cost. You might be able to save costs by reducing ingestion. For more information about Google Cloud Managed Service for Prometheus, see [Cost controls and attribution](https://docs.cloud.google.com/stackdriver/docs/managed-prometheus/cost-controls.md.txt). For more information about logging, see [Exclusion filters](https://docs.cloud.google.com/logging/docs/routing/overview.md.txt#exclusions).
- GPU utilization
- High GPU utilization occurs when a GPU consistently runs at maximum capacity (100%). This can become a bottleneck which can cause delays and reduce overall system performance. This happens because the GPU is unable to handle the incoming workload efficiently, leading to a backlog of tasks.
- Low GPU utilization suggests that the workload is not fully utilizing the available processing power. This could be due to inefficient code, poor workload optimization, or a lack of computationally demanding tasks. The system is not running at its full potential even though there are abundant resources available.
- For optimal GPU performance, maintain a utilization level that balances the workload's demands with the available resources.
Application performance metrics help you to detect performance regressions in
your application. Google Kubernetes Engine provides visualizations for the following kinds
of performance measures for your workloads:
- Requests: shows the per-second request rate, grouped by operation when available.
- Errors: shows error rates, grouped by operation and response code.
- Latency: shows 50th and 95th percentile response latency by operation.
- CPU and memory: shows the utilization of CPU and memory as a percentage of a requested amount.
These metrics correspond to the [*golden signals*](https://sre.google/sre-book/monitoring-distributed-systems/#xref_monitoring_golden-signals) recommended in the Google [*Site Reliability Engineering* book](https://sre.google/sre-book/monitoring-distributed-systems/)
for monitoring distributed systems.
## View cluster and workload observability metrics
To view observability metrics for your clusters or workloads, perform the
following steps in the Google Cloud console:
1. Go to the **Kubernetes Clusters** or **Kubernetes Workloads** page:
[Go to Kubernetes Clusters](https://console.cloud.google.com/kubernetes/list)
[Go to Kubernetes Workloads](https://console.cloud.google.com/kubernetes/workload)
2. Select the **Observability** tab.
3. Choose the timeframe over which the metrics are aggregated. Drag inside a
chart to focus on a specific time range. Click **Reset Zoom** to go back to
the previously selected range.
4. Optional: To update the **Predefined** dashboard to display events, such as
those that indicate the crash of a Pod, click
**Select Events**, and then complete the dialog.
For more information about events, see
[Event types](https://docs.cloud.google.com/monitoring/dashboards/event-types.md.txt).
To view observability metrics for a selected cluster or workload, perform the
following steps in the Google Cloud console:
1. Go to the **Kubernetes Clusters** or **Kubernetes Workloads** page:
[Go to Kubernetes Clusters](https://console.cloud.google.com/kubernetes/list)
[Go to Kubernetes Workloads](https://console.cloud.google.com/kubernetes/workload)
2. Click the name of a cluster or workload.
3. Select the **Observability** tab.
4. Choose the timeframe over which the metrics are aggregated. Drag inside a
chart to focus on a specific time range. Click **Reset Zoom** to go back to
the previously selected range.
5. Optional: To update the **Predefined** dashboard to display events, such as
those that indicate the crash of a Pod, click
**Select Events**, and then complete the dialog.
For more information about events, see
[Event types](https://docs.cloud.google.com/monitoring/dashboards/event-types.md.txt).
## View application performance metrics
To view the application performance metrics for a Deployment, do the following:
1. In the Google Cloud console, go to the **Workloads** page:
[Go to **Workloads**](https://console.cloud.google.com/kubernetes/workload/overview)
If you use the search bar to find this page, then select the result whose subheading is
**Kubernetes Engine**.
2. Click a Deployment in the list of workloads. The **Type** column in the list indicates the type of the workload.
3. On the **Deployment details** page, click the **Observability** tab.
If application performance metrics are available, the
**Application** dashboard is selected by default and displays your metrics.
Otherwise, the **Overview** dashboard is selected.
4. Optional: To update the **Predefined** dashboard to display events, such as
those that indicate the crash of a Pod, click
**Select Events**, and then complete the dialog.
For more information about events, see
[Event types](https://docs.cloud.google.com/monitoring/dashboards/event-types.md.txt).
### Create a customized dashboard to view specific metrics
By default, the Observability tab provides predefined dashboards that display
relevant metrics. To view only the specific metrics that you want, you can
modify the dashboards and create a customized dashboard. You can further edit
the customized dashboard as you need.
To create a customized dashboard, do the following:
1. Go to the **Kubernetes Clusters** or **Kubernetes Workloads** page:
[Go to Kubernetes Clusters](https://console.cloud.google.com/kubernetes/list)
[Go to Kubernetes Workloads](https://console.cloud.google.com/kubernetes/workload)
2. Click the name of a cluster or workload.
3. Select the **Observability** tab.
4. To create a customized dashboard, click **Customize dashboard** and
modify the dashboard as needed. For example, you can do the following:
- To add a widget, click **Add widget** and complete the configuration.
- For example, to view the logs with your metric data, click **Add widget** , select **Logs** , and then click **Apply**.
- To remove or modify a widget, use the options in the toolbar of the widget. To reposition or resize a widget, use your pointer.
5. After you finish modifying, click **Save**.
6. In the dialog confirming the changes, click **View customized dashboard**
to go to the customized view.
You can switch back to the predefined view by selecting **Predefined** from
the **Dashboard** drop-down.
## View GKE dashboards in Cloud Monitoring
Monitoring provides additional dashboards for GKE
and other Google Cloud services. You can use the provided dashboards or
make a copy of a dashboard so that you can customize it to meet your needs.
The dashboard list also includes GKE playbooks that you can
use to help you troubleshoot common issues.
1. In the Google Cloud console, go to the **Dashboards** page:
[Go to **Dashboards**](https://console.cloud.google.com/monitoring/dashboards)
If you use the search bar to find this page, then select the result whose subheading is
**Monitoring**.
2. In the Categories list, select **GCP**.
3. Select the dashboard or playbook you want to view.
- The **GKE** dashboard provides an overview of your clusters, workloads, services, and other resources that you can filter. You can click a resource to view metric and log details. For namespaces, worloads, and Kubernetes services you can also view and create [Service Level Objectives](https://docs.cloud.google.com/stackdriver/docs/solutions/slo-monitoring.md.txt) (SLOs) from the detail view.
- Other GKE dashboards and playbooks focus on specific resources or conditions such as workloads at risk.
4. Optional: To update the dashboard to display events, such as
those that indicate the crash of a Pod, click **Select events** , and
then complete the dialog. For more information about events, see
[Event types](https://docs.cloud.google.com/monitoring/dashboards/event-types.md.txt).
## What's next
- [View cost-related optimization metrics](https://docs.cloud.google.com/kubernetes-engine/docs/how-to/cost-optimization-metrics.md.txt).
- [Monitor startup latency metrics](https://docs.cloud.google.com/kubernetes-engine/docs/how-to/monitor-startup-latency-metrics.md.txt).
- [Configure automatic application monitoring](https://docs.cloud.google.com/kubernetes-engine/docs/how-to/configure-automatic-application-monitoring.md.txt).