Data profiling in Knowledge Catalog (formerly Dataplex Universal Catalog) lets you calculate
column-level statistics for your BigQuery tables, and for Apache
Iceberg, Apache Hive, and SAP Business Data Cloud (BDC) Delta Lake tables
managed by Google Cloud Lakehouse. Profile scans report key metrics,
such as common values, data distributions, and null percentages, to help you
understand and analyze your data. You can also use profiling results to generate
[auto data quality](https://docs.cloud.google.com/knowledge-catalog/docs/auto-data-quality-overview) rule
recommendations that help keep your data reliable.
## Conceptual model
Knowledge Catalog lets you better understand the profile of your data by
creating a data profile scan. A data profile scan is a type of
[Knowledge Catalog data scan](https://docs.cloud.google.com/knowledge-catalog/docs/reference/rest/v1/projects.locations.dataScans)
that analyzes a BigQuery table, or an Apache Iceberg, Apache
Hive, or SAP BDC Delta Lake table managed by Google Cloud
Lakehouse, to generate statistical insights.
The following diagram shows how Knowledge Catalog scans data to report on
statistical characteristics.
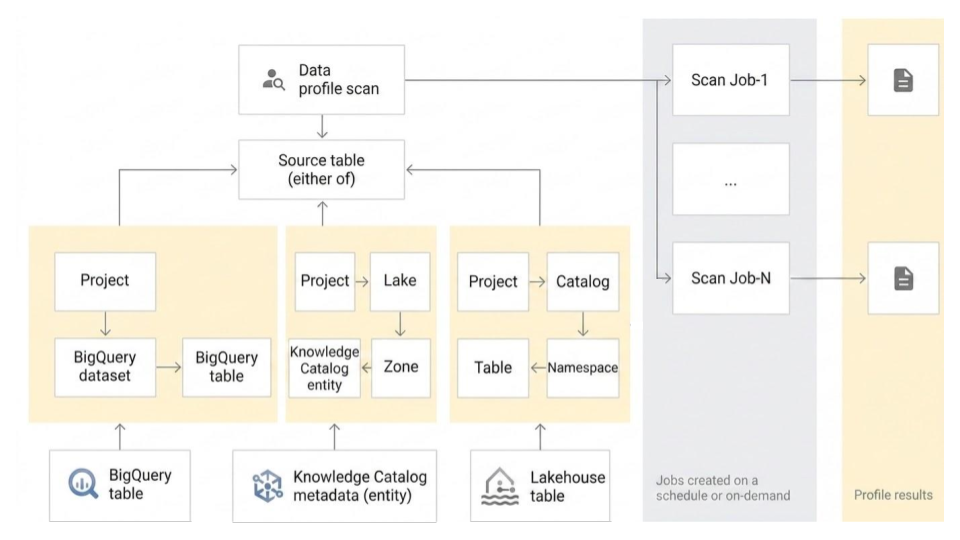
A data profile scan is associated with one BigQuery table, or one
Apache Iceberg, Apache Hive, or SAP BDC Delta Lake table managed by
Google Cloud Lakehouse, and scans the table to generate
the data profiling results. A data profile scan supports several
[configuration options](https://docs.cloud.google.com/knowledge-catalog/docs/data-profiling-overview#configuration-options), and you can use the scan
results to generate recommended validation rules for
[auto data quality](https://docs.cloud.google.com/knowledge-catalog/docs/auto-data-quality-overview) scans.
> [!NOTE]
> **Note:** Knowledge Catalog runs scans on resources in a Google tenant project, so you don't need to set up your own infrastructure.
## Configuration options
This section describes the configuration options available for running
data profile scans.
### Profiling modes
You can choose between the following profiling modes:
- **Standard**: This is the default mode. It provides a comprehensive and
customizable profile by scanning your data based on the sampling and filters
that you specify. Standard mode is suitable for detailed analysis and
long-term monitoring of data characteristics.
- **Lightweight ([Preview](https://cloud.google.com/products/#product-launch-stages))**: This mode
provides low-latency profile scans that return results in seconds. It is
optimized for speed and cost-efficiency to support use cases such as the
following:
- Grounding AI agent responses with immediate data characteristics
- Cost-effectively pre-generating profiles at scale for global data discovery
- Providing rapid *health reports* during interactive data exploration
The lightweight mode has the following limitations:
- Unlike the standard profiling mode, you can't modify the scope, filters, or sampling size on lightweight scans.
- It doesn't support BigQuery views and external tables.
### Scheduling options
You can schedule a data profile scan with a defined frequency to profile tables
automatically, or run the scan on demand. If a scan job is running longer than
expected, you can
[cancel the job](https://docs.cloud.google.com/knowledge-catalog/docs/use-data-profiling#cancel-job).
### Execution identity
By default, Knowledge Catalog uses a centralized service agent (`service-PROJECT_NUMBER@gcp-sa-dataplex.iam.gserviceaccount.com`) to run data profile scans.
You can also override this default execution identity by specifying a custom service account or by using your own End-User Credentials (EUC). This provides several benefits:
- **Principle of least privilege:** Grant only the exact Identity and Access Management (IAM) permissions required for specific data profiling tasks to a dedicated service account, minimizing overprovisioned access.
- **Fine-grained access control:** Scope permissions to specific resources, allowing integration with row-level and column-level access policies in BigQuery.
- **Improved auditability:** Assign custom service accounts or user credentials to specific scans, making tracking and logging of activities much clearer in audit logs.
- **Billing unification:** When you use a custom execution identity, the processing and storage charges are centralized directly under BigQuery (bypassing Knowledge Catalog Premium SKUs). This lets you take advantage of BigQuery enterprise discounts and slot commitments.
For instructions on how to configure a custom execution identity, see [Configure execution identity](https://docs.cloud.google.com/knowledge-catalog/docs/use-data-profiling#configure-execution-identity).
### Networking requirements
To run a scan, you must enable
[Private Google Access](https://docs.cloud.google.com/vpc/docs/configure-private-google-access#config-pga)
on the [VPC subnet](https://docs.cloud.google.com/vpc/docs/subnets) that you use
for the scan. If you don't specify a subnet, make sure your default subnet has
Private Google Access enabled.
### Scope
For **Standard** profiling scans, you can specify the scope of the data to scan:
- **Full table**: The entire table is scanned in the data profile scan.
Sampling, row filters, and column filters are applied on the entire table
before calculating the profiling statistics.
- **Incremental** : Incremental data that you specify is scanned in the data
profile scan. Specify a `Date` or `Timestamp` column in the table to be
used as an increment. Typically, this is the column on which the table is
partitioned. Sampling, row filters, and column filters are applied on the
incremental data before calculating the profiling statistics.
### Filter data
For **Standard** profiling scans, you can filter data to be scanned for
profiling by using row filters and column filters. Using filters helps you
reduce the run time and cost, and exclude sensitive and unnecessary data.
Lightweight profiling scans don't support column filters and row filters.
- **Row filters**: row filters let you focus on data within a specific time
period or from a specific segment, such as region. For example, you can filter
out data with a timestamp before a certain date.
- **Column filters**: column filters let you include and exclude specific
columns from your table to run the data profile scan.
### Sample data
For **Standard** profiling scans, you can specify a percentage of records from
your data to sample for running a data profile scan. Creating data profile scans
on a smaller sample of data can reduce the run time and cost of querying the
entire dataset.
## Multiple data profile scans
You can create multiple data profile scans at a time
using the Google Cloud console. You can select up to 100 tables from one dataset
and create a data profile scan for each dataset. For more information, see
[Create multiple data profile scans](https://docs.cloud.google.com/knowledge-catalog/docs/use-data-profiling#multiple-scans).
### Export scan results to a BigQuery table
You can export the data profile scan results to a BigQuery table
for further analysis. To customize reporting, you can connect the
BigQuery table data to a Looker dashboard. You can
build an aggregated report by using the same results table across multiple scans.
## Data profiling results
Data profiling results summarize each scanned column, including common values,
how values are distributed, and the percentage of null and unique values.
Depending on the column type, the results include the following values:
| Column type | Data profiling results |
|---|---|
| Numeric column | - Percentage of null values. - Percentage of approximate unique (distinct) values. - Top 10 most common values in the column. It can be less than 10 if the number of unique values in the column is less than 10 (null values aren't included). For each of these most common values, the percentage of their occurrence in the data scanned in the current scan is displayed. - Average, standard deviation, minimum, approximate lower quartile, approximate median, approximate upper quartile, and maximum values. |
| String column | - Percentage of null values. - Percentage of approximate unique (distinct) values. - Top 10 most common values in the column, which can be less than 10 if the number of unique values in the column is less than 10. - Average, minimum, and maximum length of the string. |
| Other non-nested columns (date, time, timestamp, binary, etc.) | - Percentage of null values. - Percentage of approximate unique (distinct) values. - Top 10 most common values in the column, which can be less than 10 if the number of unique values in the column is less than 10. |
| All other nested or complex data-type columns (such as Record, Array, JSON) or any column with **repeated** mode. | - Percentage of null values. |
The results include the number of records scanned in every job.
> [!NOTE]
> **Note:** Approximate values might differ from the actual values by 1-2% for performance improvement.
## Reporting and monitoring
You can monitor and analyze the data profiling results using the following
reports and methods:
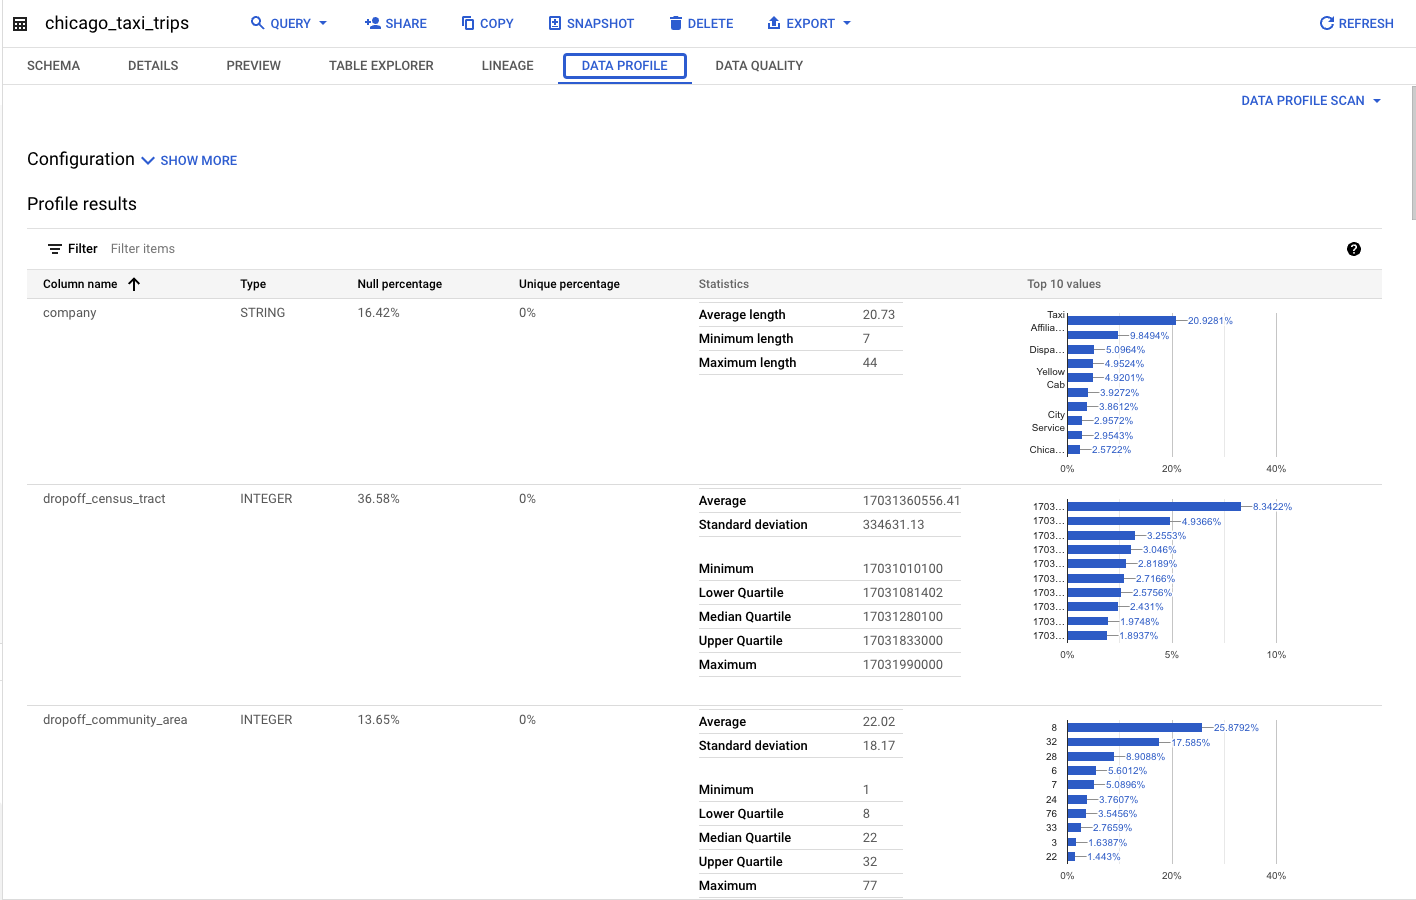
- **Reports published with the source table in the BigQuery and Knowledge Catalog pages**
If you configure a data profile scan to publish the results to BigQuery and Knowledge Catalog, you can view the latest data profile scan
results on the source table's **Data profile** tab in both BigQuery and Knowledge Catalog. These results are accessible from any project.
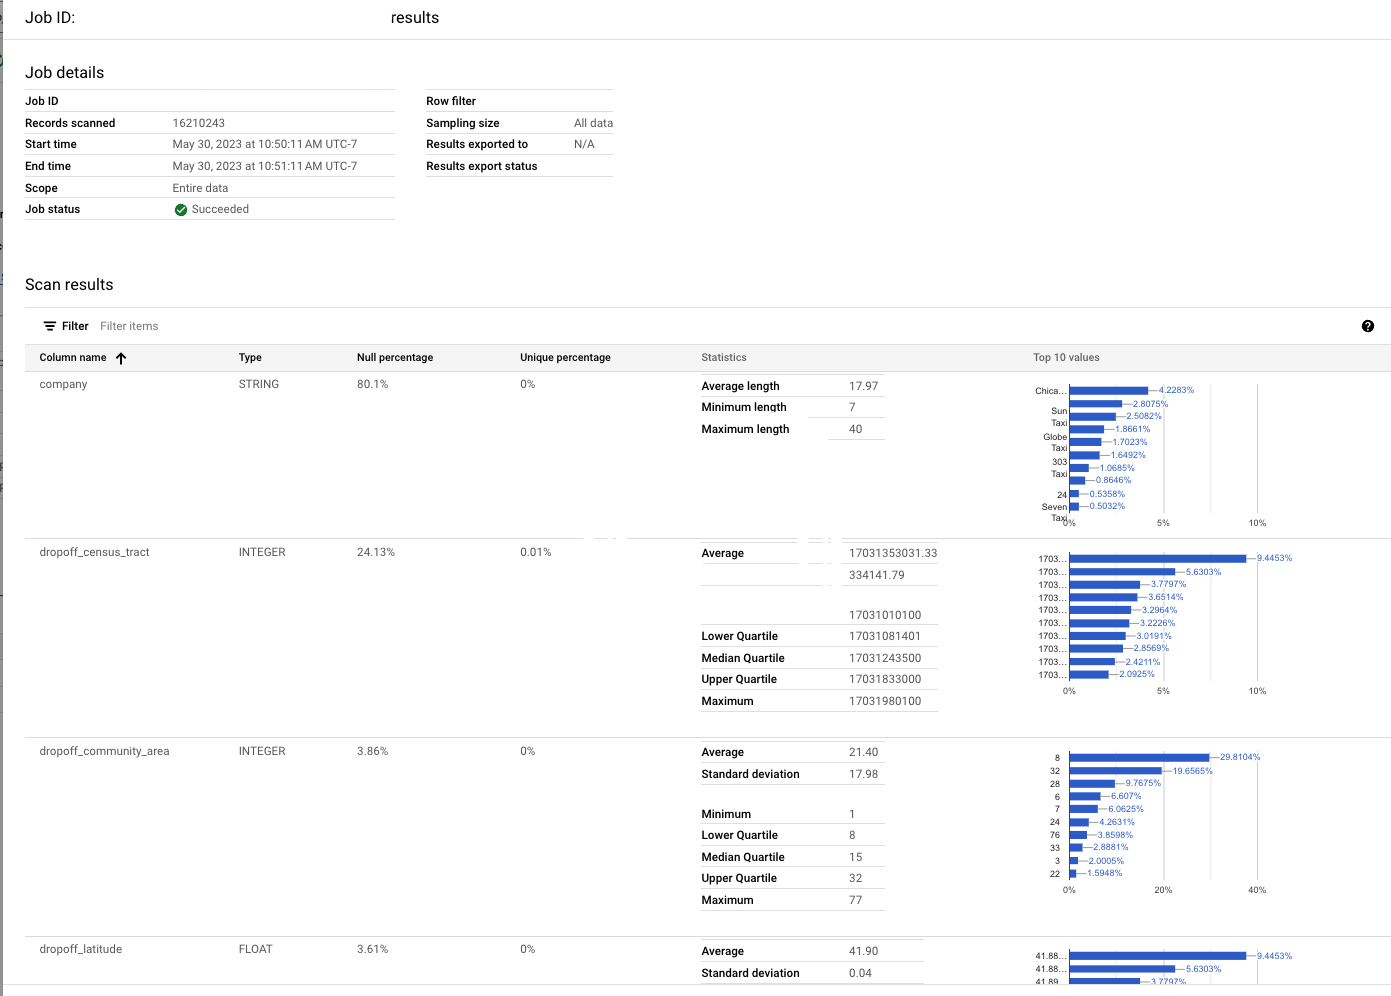
- **Historical, per job report**
On the **Data profiling \& quality \> Data profile scan** page in
Knowledge Catalog and BigQuery, you can view the
detailed reports for the latest and historical jobs. This
includes column-level profile information and the configuration that was used.
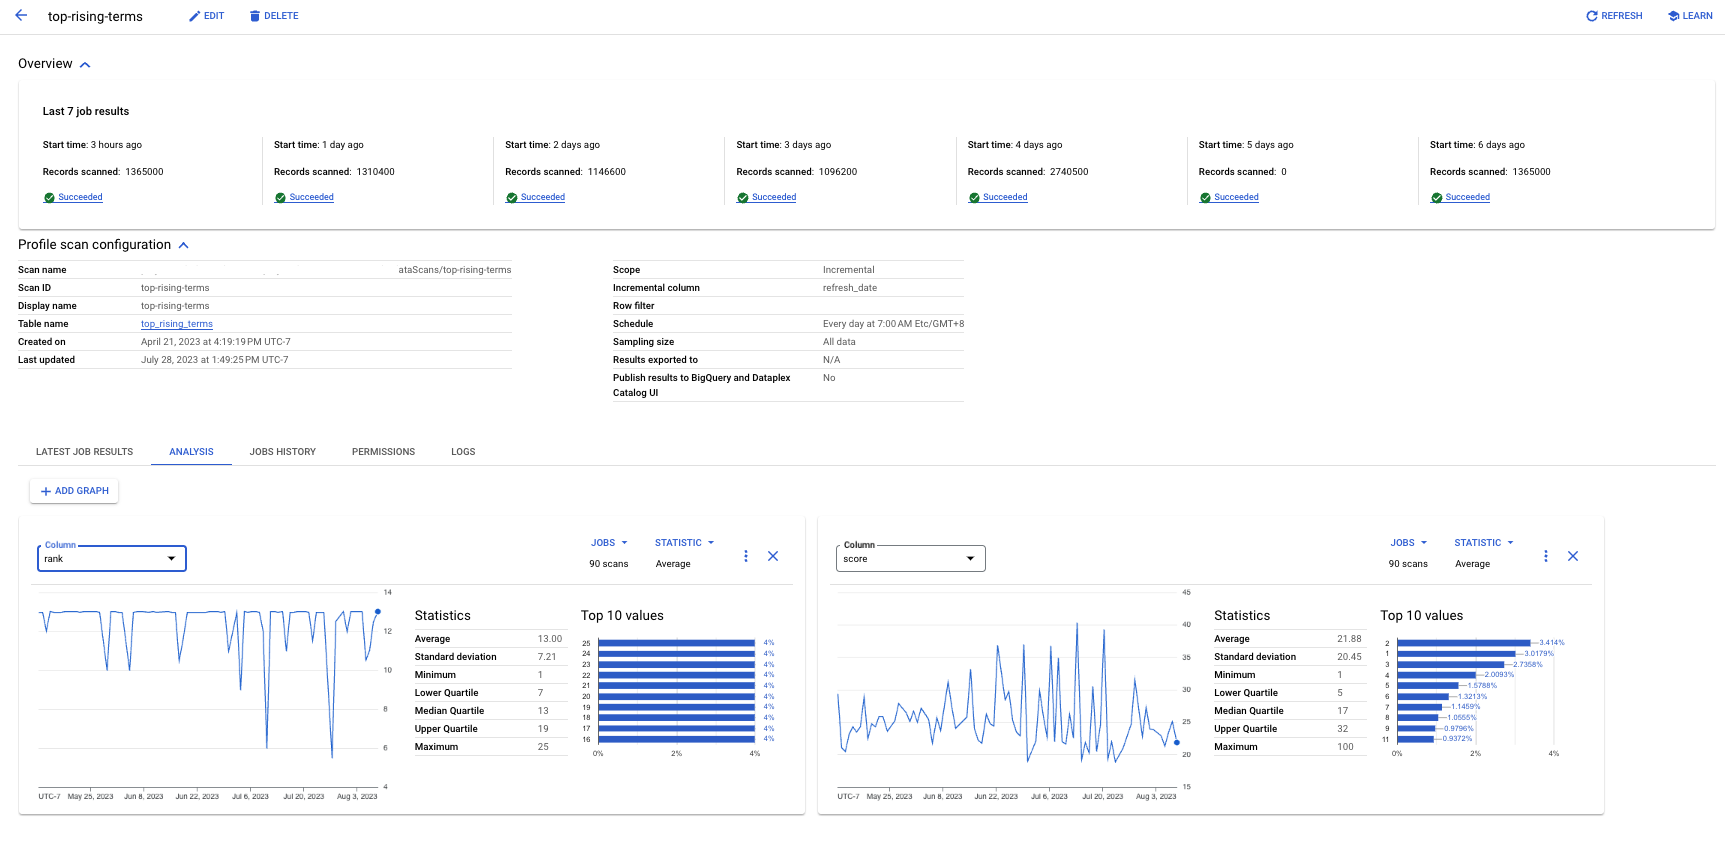
- **Analysis tab**
On the **Data profiling \& quality \> Data profile scan** page in
Knowledge Catalog and BigQuery, you can use the **Analysis**
tab to view the trends for a given statistic of a column over multiple
profile jobs. For example, if you have an incremental scan, you can view how
the average of a value has been trending over time.
- **Build your own dashboard or analytics**
If you have configured a data profile scan to export results to a
BigQuery table, then you can build your own dashboards using
tools, such as Data Studio.
- **Monitor DCU compute costs in Cloud Billing**
Data profiling scan compute runs on serverless infrastructure and does not
emit time-series metrics to Cloud Monitoring. To track and attribute Data
Profiling DCU costs by project, scan ID, or table, query Cloud Billing
export in BigQuery using `goog-dataplex-datascan-*` system labels.
For more information, see [Monitor and attribute Dataplex DCU costs with
Cloud Billing export](https://docs.cloud.google.com/knowledge-catalog/docs/monitoring#monitor-dcu-costs-billing-export).
## Limitations
- You can run data profile scans only on BigQuery tables, and on Apache Iceberg, Apache Hive, and SAP BDC Delta Lake tables managed by Google Cloud Lakehouse.
- Data profiling is supported for BigQuery tables across all column types. However, if you are using a Knowledge Catalog entry as your data source, `BIGNUMERIC` columns are not supported. Attempting to run a scan on a Knowledge Catalog entry that contains a `BIGNUMERIC` column results in a validation error and isn't successfully created.
- Multiple data profile scans aren't supported for Lakehouse tables.
## Pricing
- For more information about pricing, see [Knowledge Catalog pricing](https://cloud.google.com/dataplex/pricing).
- To track and attribute Data Profiling scan DCU usage and costs using Cloud Billing export to BigQuery, see [Monitor and attribute Dataplex DCU costs with Cloud Billing export](https://docs.cloud.google.com/knowledge-catalog/docs/monitoring#monitor-dcu-costs-billing-export).
## What's next
- Learn how to [use data profiling](https://docs.cloud.google.com/knowledge-catalog/docs/use-data-profiling).
- For more information about the available Terraform resources for creating data profile scans, see the following:
- [Knowledge Catalog data scan resource](https://registry.terraform.io/providers/hashicorp/google/latest/docs/resources/dataplex_datascan) in the Terraform registry.
- The [Knowledge Catalog data scan resource documentation](https://github.com/GoogleCloudPlatform/cloud-foundation-fabric/tree/master/modules/dataplex-datascan) on GitHub, which supports YAML-based rule configuration.
- Learn about [auto data quality](https://docs.cloud.google.com/knowledge-catalog/docs/auto-data-quality-overview).
- Learn how to [use auto data quality](https://docs.cloud.google.com/knowledge-catalog/docs/use-auto-data-quality).
- Learn how to [explore your data by generating data insights](https://docs.cloud.google.com/bigquery/docs/data-insights).