


Conversational Analytics API는 사용자 질문을 기반으로 하는 대화형 시각화를 생성할 수 있습니다. API는 차트를 Vega-Lite JSON 구성 또는 SVG 이미지 (Looker 데이터 소스의 경우, v1alpha 및 v1beta API 버전에서만)로 반환합니다. 특정 요구사항에 따라 차트를 생성하도록 에이전트에게 지시할 수도 있습니다. 시각화는 사용자의 질문에 대한 응답으로 얻은 데이터 결과를 사용하여 생성됩니다.
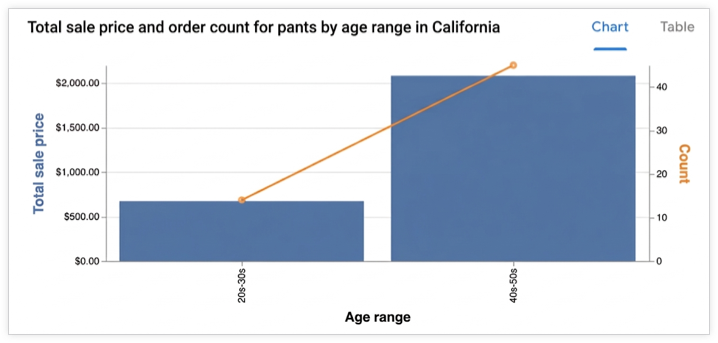
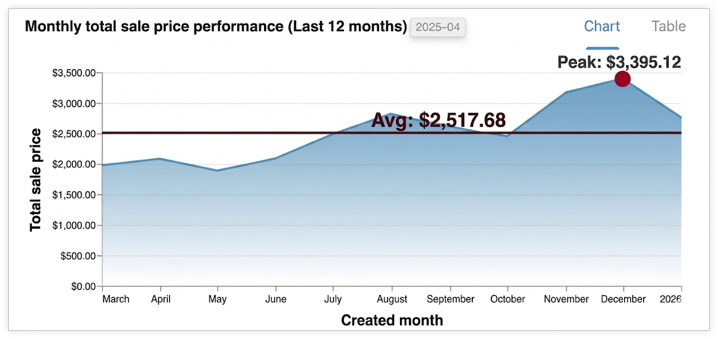
지원되는 시각화
API는 Vega-Lite를 사용하여 시각화 자료를 만들고 모든 표준 Vega-Lite 기능을 지원합니다. 지원되는 차트 유형은 다음과 같습니다.
- 영역
- 막대
- 지오셰이프
- 히트맵
- 선 (시계열)
- 원형
- 분산형
차트 생성 방식
에이전트가 관련 데이터 결과를 식별하여 하위 에이전트에 전달합니다. 이 하위 에이전트는 Python 코드를 실행하여 차트의 Vega-Lite JSON 구성을 생성합니다. API는 대화 컨텍스트를 사용하여 차트를 생성할 때 사용자의 의도를 더 잘 파악합니다. Python을 활용하면 API에서 더 복잡한 차트를 만들 수 있습니다.
에이전트는 차트의 관련성을 높이고 읽기 쉽도록 집계 또는 필터 적용과 같은 사소한 데이터 변환을 실행할 수 있습니다.
출력 형식
차트는 chart 결과 메시지로 반환되며 다음 형식으로 제공될 수 있습니다.
- Vega-Lite JSON
- SVG 이미지
컨텍스트의 ChartOptions 필드를 사용하여 이미지를 요청할 수 있습니다. 이미지가 요청되면 API는 이미지와 Vega-Lite JSON 출력을 모두 제공합니다.
에이전트 응답을 시각화로 렌더링
이 섹션에서는 Python SDK를 사용하여 Conversational Analytics API 응답에 제공된 차트 사양에서 시각화를 렌더링하는 방법을 보여줍니다. 샘플 코드는 응답의 chart 필드에서 차트 사양 (Vega-Lite 형식)을 추출하고 Altair 라이브러리 (Vega-Lite 기반)를 사용하여 차트를 렌더링하고 이미지로 저장한 후 표시합니다.
Vega-Lite 및 Vega-Lite 생태계로 차트를 렌더링하는 방법에 관한 자세한 내용은 Vega-Lite 시각화 제작 도구를 참고하세요.
예: Vega-Lite 출력에서 차트 렌더링
이 예시에서는 Conversational Analytics API 에이전트 응답에서 막대 그래프를 렌더링하는 방법을 보여줍니다. 이 예시에서는 다음 프롬프트와 함께 요청을 전송합니다.
"Create a bar graph that shows the top five states by the total number of airports."
샘플 코드에서는 다음 도우미 함수를 정의합니다.
render_chart_response:chart메시지에서 Vega-Lite 구성을 추출하고, Altair 라이브러리에서 사용할 수 있는 형식으로 변환하고, 차트를 렌더링하고,chart.png에 저장하고, 표시합니다.chat:inline_context변수와 현재messages목록을 사용하여 대화형 분석 API에 요청을 보내고 스트리밍 응답을 처리하며 차트가 반환되면render_chart_response를 호출하여 표시합니다.
다음 샘플 코드를 사용하려면 다음을 바꾸세요.
- sqlgen-testing: 필요한 API를 사용 설정한 결제 프로젝트의 ID입니다.
- Create a bar graph that shows the top five states by the total number of airports: Conversational Analytics API에 전송할 프롬프트입니다.
from google.cloud import geminidataanalytics
from google.protobuf.json_format import MessageToDict
import altair as alt
import proto

# Helper function for rendering chart response
def render_chart_response(resp):
  def _convert(v):
    if isinstance(v, proto.marshal.collections.maps.MapComposite):
      return {k: _convert(val) for k, val in v.items()}
    elif isinstance(v, proto.marshal.collections.RepeatedComposite):
      return [_convert(el) for el in v]
    elif isinstance(v, (int, float, str, bool, type(None))):
      return v
    else:
      return MessageToDict(v)

  try:
    vega_config = _convert(resp.result.vega_config)
    chart = alt.Chart.from_dict(vega_config)
    chart.save('chart.png')
    chart.display()
    print("Chart rendered and saved as chart.png")
  except Exception as e:
    print(f"Error rendering chart: {e}")

# Helper function for calling the API
def chat(q: str, inline_context, messages):
  billing_project = "sqlgen-testing"

  input_message = geminidataanalytics.Message(
      user_message=geminidataanalytics.UserMessage(text=q)
  )
  messages.append(input_message)

  client = geminidataanalytics.DataChatServiceClient()
  request = geminidataanalytics.ChatRequest(
      inline_context=inline_context,
      parent=f"projects/{billing_project}/locations/global",
      messages=messages,
  )

  # Make the request
  try:
    stream = client.chat(request=request)

    for reply in stream:
      if reply.system_message and hasattr(reply.system_message, 'chart'):
        # ChartMessage includes `query` for generating a chart and `result` with the generated chart.
        if hasattr(reply.system_message.chart, 'result'):
          print("Chart result found in response.")
          render_chart_response(reply.system_message.chart)
        else:
          print("Chart message found, but no result yet.")
      # Append system messages to maintain context for follow-up turns
      if reply.system_message:
          messages.append(geminidataanalytics.Message(system_message=reply.system_message))

  except Exception as e:
    print(f"Error calling API: {e}")

# Example Usage:
# Assuming 'inline_context' and 'messages' are initialized as per "Build a data agent using the Python SDK"
# Example initialization (replace with your actual context and message history):
# inline_context = geminidataanalytics.InlineContext(...)
# messages = []

# Send the prompt to make a bar graph
chat("Create a bar graph that shows the top five states by the total number of airports")