This page explains how Provisioned Throughput works, how to control
overages or bypass Provisioned Throughput, and how to monitor usage.
## How Provisioned Throughput works
This section explains how Provisioned Throughput works by using
quota checking through the quota enforcement period.
### Provisioned Throughput quota checking
Your Provisioned Throughput maximum quota is a multiple of the
number of generative AI scale units (GSUs) purchased and the throughput per GSU.
It's checked each time you make a request within your *quota enforcement
period*, which is how frequently the maximum Provisioned Throughput
quota is enforced.
At the time a request is received, the true response size is unknown. Because we
prioritize speed of response for real-time applications,
Provisioned Throughput estimates the output token size. If the
initial estimate exceeds the available Provisioned Throughput
maximum quota, the request is processed as pay-as-you-go. Otherwise, it is
processed as Provisioned Throughput. This is done by comparing the
initial estimate to your Provisioned Throughput maximum quota.
When the response is generated and the true output token size is known, actual
usage and quota are reconciled by adding the difference between the estimate and
the actual usage to your available Provisioned Throughput quota
amount.
### Provisioned Throughput quota enforcement windows
Agent Platform applies a dynamic window while enforcing
Provisioned Throughput quota for Gemini models. This
provides optimal stability for traffic prone to spikes. Instead of a fixed
window, Agent Platform enforces the quota over a flexible window that
automatically adjusts, depending on the model type and the number of GSUs that
you've provisioned. As a result, you might temporarily experience prioritized
traffic that exceeds your quota amount on a per-second basis in some cases.
However, you must not exceed your quota over the window duration. These periods
are based on the Agent Platform internal clock time and are
independent of when requests are made.
#### How the quota enforcement window works
The enforcement window determines how much you can exceed, or "burst", above
your per-second limit, before you're throttled. This window is applied
automatically. Note that these windows are subject to change to optimize for
performance and reliability.
- **Small GSU allocations** (3 GSUs or less): The window can range from 40 to
120 seconds to allow for larger individual requests to process without
interruption.
For example, if you buy 1 GSU of `gemini-2.5-flash`, you get an average of
2,690 tokens per second of continuous throughput. Your total usage over any
120-second window can't exceed 322,800 tokens (2,690 tokens per second \*
120 seconds). Therefore, if you send a request that uses 70,000
tokens per second, but the total usage over 120 seconds remains below
322,800 tokens, then the 70,000-token per second burst still counts as
Provisioned Throughput, since the average usage doesn't exceed
2,690 tokens per second.
- **Standard (medium-sized) GSU allocations** (more than 3 GSUs): For
medium-sized GSU deployments (for example, fewer than 50 GSUs), the window can range
from 5 seconds to 30 seconds. The GSU thresholds and context windows vary based
on the model.
For example, if you buy 25 GSUs of `gemini-2.5-flash`, you get an average of
67,250 tokens per second (2,690 tokens per second \* 25) of continuous
throughput. Your total usage over any 30-second window can't
exceed 2,017,500 tokens (67,250 tokens per second \* 30 seconds). Therefore,
if you send a request that uses 1,000,000
tokens per second but the total usage over 30 seconds remains within
2,017,500 tokens, then the 1,000,000-token per second burst still counts as
Provisioned Throughput, since the average usage doesn't exceed
67,250 tokens per second.
- **High-precision (large-scale) GSU allocations**: For large-scale GSU
deployments (for example, 50 GSUs or more), the window can range from 1 to 5
seconds to ensure that high frequency requests are processed with maximum
accuracy across the infrastructure.
For example, if you buy 250 GSUs of `gemini-2.5-flash`, you get an average of
672,500 tokens per second (2,690 tokens per second \* 250) of continuous
throughput. Your total usage over any 5-second window can't exceed
3,362,500 tokens (672,500 tokens per second \* 5 seconds). Therefore,
if you send a request that uses 5,000,000 tokens per second, then it won't be processed as
Provisioned Throughput, because the total usage of 5,000,000
tokens exceeds the 3,362,500 token limit over a 5-second window. On the
other hand, a request that uses 1,000,000 tokens per second can be processed
as Provisioned Throughput, if the average usage over
the 5-second window doesn't exceed 672,500 tokens per second.
## Control overages or bypass Provisioned Throughput
Use the API to control overages when you exceed your purchased throughput
or to bypass Provisioned Throughput on a per-request basis.
Read through each option to determine what you must do to meet your use case.
### Default behavior
If a request exceeds the remaining Provisioned Throughput quota, the
entire request is processed as an on-demand request by default and is billed at
the [pay-as-you-go rate](https://cloud.google.com/gemini-enterprise-agent-platform/generative-ai/pricing). When this
occurs, the traffic appears as **spillover** on the monitoring dashboards. For
more information about monitoring Provisioned Throughput usage, see
[Monitor Provisioned Throughput](https://docs.cloud.google.com/gemini-enterprise-agent-platform/models/provisioned-throughput/use-provisioned-throughput.md.txt#dimensions).
After your Provisioned Throughput order is active, the default
behavior takes place automatically. You don't have to change your code to begin
consuming your order as long as you are consuming it in the region provisioned.
### Use only Provisioned Throughput
If you are managing costs by avoiding on-demand charges, use only
Provisioned Throughput. Requests which exceed the
Provisioned Throughput order amount return an [error `429`](https://docs.cloud.google.com/gemini-enterprise-agent-platform/models/deploy/error-code-429.md.txt).
When sending requests to the API, set the `X-Vertex-AI-LLM-Request-Type` HTTP
header to `dedicated`.
### Use only pay-as-you-go
This is also referred to as using on-demand. Requests bypass the Provisioned Throughput
order and are sent directly to pay-as-you-go. This might be useful
for experiments or applications that are in development.
When sending requests to the API, set the `X-Vertex-AI-LLM-Request-Type` HTTP header to `shared`.
### Example
### Python
#### Install
```
pip install --upgrade google-genai
```
To learn more, see the
[SDK reference documentation](https://googleapis.github.io/python-genai/).
Set environment variables to use the Google Gen AI SDK with Vertex AI:
```bash
# Replace the `GOOGLE_CLOUD_PROJECT` and `GOOGLE_CLOUD_LOCATION` values
# with appropriate values for your project.
export GOOGLE_CLOUD_PROJECT=GOOGLE_CLOUD_PROJECT
export GOOGLE_CLOUD_LOCATION=global
export GOOGLE_GENAI_USE_ENTERPRISE=True
```
from google import genai
from google.genai.types import HttpOptions
client = genai.Client(
http_options=HttpOptions(
api_version="v1",
headers={
# Options:
# - "dedicated": Use Provisioned Throughput
# - "shared": Use pay-as-you-go
# https://cloud.google.com/vertex-ai/generative-ai/docs/use-provisioned-throughput
"X-Vertex-AI-LLM-Request-Type": "shared"
},
)
)
response = client.models.generate_content(
model="gemini-3.8-flash",
contents="How does AI work?",
)
print(response.text)
# Example response:
# Okay, let's break down how AI works. It's a broad field, so I'll focus on the ...
#
# Here's a simplified overview:
# ...
### Go
Learn how to install or update the [Go](https://docs.cloud.google.com/vertex-ai/generative-ai/docs/sdks/overview).
To learn more, see the
[SDK reference documentation](https://pkg.go.dev/google.golang.org/genai).
Set environment variables to use the Google Gen AI SDK with Vertex AI:
```bash
# Replace the `GOOGLE_CLOUD_PROJECT` and `GOOGLE_CLOUD_LOCATION` values
# with appropriate values for your project.
export GOOGLE_CLOUD_PROJECT=GOOGLE_CLOUD_PROJECT
export GOOGLE_CLOUD_LOCATION=global
export GOOGLE_GENAI_USE_ENTERPRISE=True
```
import (
"context"
"fmt"
"io"
"net/http"
"google.golang.org/genai"
)
// generateText shows how to generate text Provisioned Throughput.
func generateText(w io.Writer) error {
ctx := context.Background()
client, err := genai.NewClient(ctx, &genai.ClientConfig{
HTTPOptions: genai.HTTPOptions{
APIVersion: "v1",
Headers: http.Header{
// Options:
// - "dedicated": Use Provisioned Throughput
// - "shared": Use pay-as-you-go
// https://cloud.google.com/vertex-ai/generative-ai/docs/use-provisioned-throughput
"X-Vertex-AI-LLM-Request-Type": []string{"shared"},
},
},
})
if err != nil {
return fmt.Errorf("failed to create genai client: %w", err)
}
modelName := "gemini-2.5-flash"
contents := genai.Text("How does AI work?")
resp, err := client.Models.GenerateContent(ctx, modelName, contents, nil)
if err != nil {
return fmt.Errorf("failed to generate content: %w", err)
}
respText := resp.Text()
fmt.Fprintln(w, respText)
// Example response:
// Artificial Intelligence (AI) isn't magic, nor is it a single "thing." Instead, it's a broad field of computer science focused on creating machines that can perform tasks that typically require human intelligence.
// .....
// In Summary:
// ...
return nil
}
### Node.js
#### Install
```
npm install @google/genai
```
To learn more, see the
[SDK reference documentation](https://googleapis.github.io/js-genai/).
Set environment variables to use the Google Gen AI SDK with Vertex AI:
```bash
# Replace the `GOOGLE_CLOUD_PROJECT` and `GOOGLE_CLOUD_LOCATION` values
# with appropriate values for your project.
export GOOGLE_CLOUD_PROJECT=GOOGLE_CLOUD_PROJECT
export GOOGLE_CLOUD_LOCATION=global
export GOOGLE_GENAI_USE_ENTERPRISE=True
```
const {GoogleGenAI} = require('@google/genai');
const GOOGLE_CLOUD_PROJECT = process.env.GOOGLE_CLOUD_PROJECT;
const GOOGLE_CLOUD_LOCATION = process.env.GOOGLE_CLOUD_LOCATION || 'global';
async function generateWithProvisionedThroughput(
projectId = GOOGLE_CLOUD_PROJECT,
location = GOOGLE_CLOUD_LOCATION
) {
const client = new GoogleGenAI({
vertexai: true,
project: projectId,
location: location,
httpOptions: {
apiVersion: 'v1',
headers: {
// Options:
// - "dedicated": Use Provisioned Throughput
// - "shared": Use pay-as-you-go
// https://cloud.google.com/vertex-ai/generative-ai/docs/use-provisioned-throughput
'X-Vertex-AI-LLM-Request-Type': 'shared',
},
},
});
const response = await client.models.generateContent({
model: 'gemini-2.5-flash',
contents: 'How does AI work?',
});
console.log(response.text);
// Example response:
// Okay, let's break down how AI works. It's a broad field, so I'll focus on the ...
// Here's a simplified overview:
// ...
return response.text;
}
### Java
Learn how to install or update the [Java](https://docs.cloud.google.com/vertex-ai/generative-ai/docs/sdks/overview).
To learn more, see the
[SDK reference documentation](https://central.sonatype.com/artifact/com.google.genai/google-genai).
Set environment variables to use the Google Gen AI SDK with Vertex AI:
```bash
# Replace the `GOOGLE_CLOUD_PROJECT` and `GOOGLE_CLOUD_LOCATION` values
# with appropriate values for your project.
export GOOGLE_CLOUD_PROJECT=GOOGLE_CLOUD_PROJECT
export GOOGLE_CLOUD_LOCATION=global
export GOOGLE_GENAI_USE_ENTERPRISE=True
```
import com.google.genai.Client;
import com.google.genai.types.GenerateContentConfig;
import com.google.genai.types.GenerateContentResponse;
import com.google.genai.types.HttpOptions;
import java.util.Map;
public class ProvisionedThroughputWithTxt {
public static void main(String[] args) {
// TODO(developer): Replace these variables before running the sample.
String modelId = "gemini-2.5-flash";
generateContent(modelId);
}
// Generates content with Provisioned Throughput.
public static String generateContent(String modelId) {
// Client Initialization. Once created, it can be reused for multiple requests.
try (Client client =
Client.builder()
.location("us-central1")
.vertexAI(true)
.httpOptions(
HttpOptions.builder()
.apiVersion("v1")
.headers(
// Options:
// - "dedicated": Use Provisioned Throughput
// - "shared": Use pay-as-you-go
// https://cloud.google.com/vertex-ai/generative-ai/docs/use-provisioned-throughput
Map.of("X-Vertex-AI-LLM-Request-Type", "shared"))
.build())
.build()) {
GenerateContentResponse response =
client.models.generateContent(
modelId, "How does AI work?", GenerateContentConfig.builder().build());
System.out.println(response.text());
// Example response:
// At its core, **AI (Artificial Intelligence) works by enabling machines to learn,
// reason, and make decisions in ways that simulate human intelligence.** Instead of being
// explicitly programmed for every single task...
return response.text();
}
}
}
### REST
```bash
curl -X POST \
-H "Authorization: Bearer $(gcloud auth print-access-token)" \
-H "Content-Type: application/json" \
-H "X-Vertex-AI-LLM-Request-Type: dedicated" \ # Options: dedicated, shared
$URL \
-d '{"contents": [{"role": "user", "parts": [{"text": "Hello."}]}]}'
```
## Use Provisioned Throughput with an API Key
If you've purchased Provisioned Throughput for a specific project,
Google model, and region, and want to use it to send a request with an API key,
then you must include the project ID, model, location, and API key as parameters
in your request.
For information about how to create a Google Cloud API key bound to a
service account, see
[Get a Google Cloud API key](https://docs.cloud.google.com/gemini-enterprise-agent-platform/models/start/api-keys.md.txt).
To learn how to send requests to the Gemini API using an API key, see
the [API quickstart](https://docs.cloud.google.com/gemini-enterprise-agent-platform/models/start.md.txt?usertype=apikey#make-first-request).
For example, the following sample shows
how to submit a request with an API key while using Provisioned Throughput:
### REST
```bash
curl \
-X POST \
-H "Content-Type: application/json" \
"https://aiplatform.googleapis.com/v1/projects/PROJECT_ID/locations/LOCATION/publishers/google/models/MODEL_ID:generateContent?key=YOUR_API_KEY" \
-d $'{
"contents": [
{
"role": "user",
"parts": [
{
"text": "Explain how AI works in a few words"
}
]
}
]
}'
```
## Get email notifications
You can get email notifications about your
Provisioned Throughput orders by using the
[Essential Contacts API](https://docs.cloud.google.com/resource-manager/docs/reference/essentialcontacts/rest.md.txt).
After enabling, click **Notifications** at the top of the Provisioned Throughput Orders page. Then, in the dialog that opens, click **Essential contacts** and follow the on-screen instructions.
1.
Enable the Essential Contacts API, if it is not already enabled.
**Roles required to enable APIs**
To enable APIs, you need the `serviceusage.services.enable` permission. If you
created the project, then you likely already have this permission through the
Owner role (`roles/owner`). Otherwise, you can get this permission through the
Service Usage Admin role (`roles/serviceusage.serviceUsageAdmin`).
[Learn how to grant roles](https://docs.cloud.google.com/iam/docs/granting-changing-revoking-access.md.txt).
[Enable the API](https://console.cloud.google.com/apis/enableflow?apiid=essentialcontacts.googleapis.com&redirect=https://console.cloud.google.com)
2. Go to the Provisioned Throughput page.
[Go to Provisioned Throughput](https://console.cloud.google.com/agent-platform/provisioned-throughput)
3. Click **Notifications**.
4. In the **Notifications** dialog, click **Essential contacts**.
The Essential contacts page opens.
5. Click **Add contact**.
6. In the **Add a contact** dialog, enter the contact's email address into
the **Email** and **Confirm email** fields.
7. Select **Product updates**.
8. Click **Save**.
The contact email address is notified for the following
Provisioned Throughput events:
| Event | When the contact is notified |
|---|---|
| Order submitted | Within minutes |
| Order activated | Within minutes |
| Order update submitted | Within minutes |
| Order update activated | Within minutes |
| 1 month, 3 month, or 1 year order expiration | 2 weeks prior to expiration date |
| 1 week order expiration. | 3 days prior to expiration date |
| 1 month, 3 month, or 1 year auto-renewal | 2 weeks prior to auto-renewal date |
## Monitor Provisioned Throughput
> [!WARNING]
>
> **Preview**
>
>
> This feature is
>
> subject to the "Pre-GA Offerings Terms" in the General Service Terms section of the
> [Service Specific
> Terms](https://docs.cloud.google.com/terms/service-terms#1).
>
> Pre-GA features are available "as is" and might have limited support.
>
> For more information, see the
> [launch stage descriptions](https://cloud.google.com/products/#product-launch-stages).
You can self-monitor your Provisioned Throughput usage using a set
of metrics that are measured on the `aiplatform.googleapis.com/PublisherModel`
resource type.
Provisioned Throughput traffic monitoring is a public Preview
feature.
#### Dimensions
You can filter on metrics using the following dimensions:
| **Dimension** | **Values** |
|---|---|
| `type` | `input` `output` |
| `request_type` | **`dedicated`**: Traffic is processed using Provisioned Throughput. **`spillover`** : Traffic is processed as pay-as-you-go quota after you exceed your Provisioned Throughput quota. Note that the `spillover` metric isn't supported for Provisioned Throughput for Gemini 2.0 models if [explicit caching](https://docs.cloud.google.com/gemini-enterprise-agent-platform/models/context-cache/context-cache-overview.md.txt#explicit-caching) is enabled, because these models don't support explicit caching. In this case, the traffic appears as `shared`. **`shared`** : If Provisioned Throughput is active, then traffic is processed as pay-as-you-go quota using the shared [HTTP header](https://docs.cloud.google.com/gemini-enterprise-agent-platform/models/provisioned-throughput/use-provisioned-throughput.md.txt#only-pay-as-you-go). If Provisioned Throughput isn't active, then traffic is processed as pay-as-you-go, by default. |
#### Path prefix
The path prefix for a metric is
`aiplatform.googleapis.com/publisher/online_serving`.
For example, the full path for the `/consumed_throughput` metric is
`aiplatform.googleapis.com/publisher/online_serving/consumed_throughput`.
#### Metrics
The following Cloud Monitoring metrics are available on the
`aiplatform.googleapis.com/PublisherModel` resource for the
Gemini models. Use the `dedicated` request types to filter for
Provisioned Throughput usage.
| Metric | Display name | Description |
|---|---|---|
| `/dedicated_gsu_limit` | **Limit (GSU)** | Dedicated limit in GSUs. Use this metric to understand your Provisioned Throughput maximum quota in GSUs. |
| `/tokens` | **Tokens** | Input and output token count distribution. |
| `/token_count` | **Token count** | Accumulated input and output token count. |
| `/consumed_token_throughput` | **Token throughput** | Throughput usage, which accounts for the burndown rate in tokens and incorporates quota reconciliation. See [Provisioned Throughput quota checking](https://docs.cloud.google.com/gemini-enterprise-agent-platform/models/provisioned-throughput/use-provisioned-throughput.md.txt#pt-quota-checking). Use this metric to understand how your Provisioned Throughput quota was used. |
| `/dedicated_token_limit` | **Limit (tokens per second)** | Dedicated limit in tokens per second. Use this metric to understand your Provisioned Throughput maximum quota for token-based models. |
| `/characters` | **Characters** | Input and output character count distribution. |
| `/character_count` | **Character count** | Accumulated input and output character count. |
| `/consumed_throughput` | **Character throughput** | Throughput usage, which accounts for the burndown rate in characters and incorporates quota reconciliation [Provisioned Throughput quota checking](https://docs.cloud.google.com/gemini-enterprise-agent-platform/models/provisioned-throughput/use-provisioned-throughput.md.txt#pt-quota-checking). Use this metric to understand how your Provisioned Throughput quota was used. For token-based models, this metric is equivalent to the throughput consumed in tokens multiplied by 4. |
| `/dedicated_character_limit` | **Limit (characters per second)** | Dedicated limit in characters per second. Use this metric to understand your Provisioned Throughput maximum quota for character-based models. |
| `/model_invocation_count` | **Model invocation count** | Number of model invocations (prediction requests). |
| `/model_invocation_latencies` | **Model invocation latencies** | Model invocation latencies (prediction latencies). |
| `/first_token_latencies` | **First token latencies** | Duration from request received to first token returned. |
Anthropic models also have a filter for Provisioned Throughput but
only for `tokens` and `token_count`.
### Dashboards
Default monitoring dashboards for Provisioned Throughput provide
[metrics](https://docs.cloud.google.com/gemini-enterprise-agent-platform/models/provisioned-throughput/use-provisioned-throughput.md.txt#metrics) that let you better understand your usage and
Provisioned Throughput utilization. To access the dashboards, do the
following:
1. In the Google Cloud console, go to the **Provisioned Throughput**
page.
[Go to Provisioned Throughput](https://console.cloud.google.com/agent-platform/provisioned-throughput)
2. To view the Provisioned Throughput utilization of each model
across your orders, select the **Utilization summary** tab.
In the **Provisioned Throughput utilization by model** table, you can view
the following for the selected time range:
- Total number of GSUs you had.
- Peak throughput usage in terms of GSUs.
- The average GSU utilization.
- The number of times you reached your Provisioned Throughput limit.
3. Select a model from the **Provisioned Throughput utilization by
model** table to see more metrics specific to the selected model.
### Detailed metrics
Detailed metrics compute the Provisioned Throughput dashboards from
per-request inference logs instead of one-minute aggregate metrics. They show
traffic at second-level resolution, so you can see bursts that a one-minute
average hides and the individual seconds where traffic spilled over.
Detailed metrics add the following charts beside the standard ones: throughput,
cache hit rate and cached token use.
To turn on detailed metrics, see
[Enable in the console](https://docs.cloud.google.com/gemini-enterprise-agent-platform/models/capabilities/inference-metadata-logging.md.txt#enable-console). After the log bucket
upgrade finishes, open an order or a model from the **Utilization summary** tab
to see the detailed charts. To query the same data with SQL, for example
burndown by project, spillover by minute or cache hit rate, see
[Query with Observability Analytics](https://docs.cloud.google.com/gemini-enterprise-agent-platform/models/capabilities/inference-metadata-logging.md.txt#observability-analytics).
> [!NOTE]
> **Note:** Turning on detailed metrics turns on inference request metadata logging for the whole project: every Gemini and Claude model, on Provisioned Throughput and every pay-as-you-go option that the logs support.
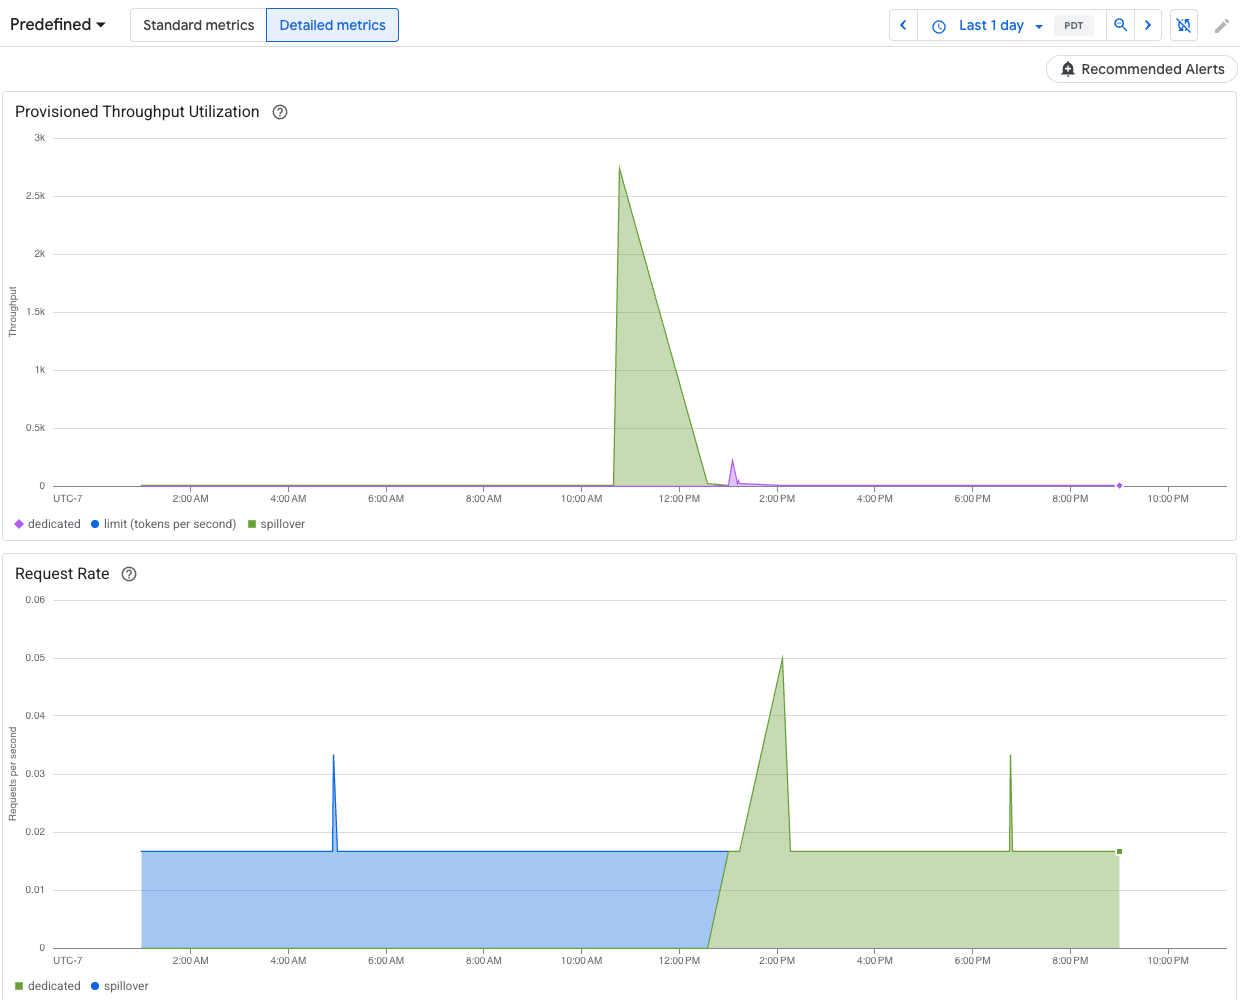 Detailed metrics selected on a Provisioned Throughput details page, over the last day. Provisioned Throughput Utilization shows throughput per second as dedicated and spillover against the limit (tokens per second). Request Rate shows requests per second as dedicated and spillover. 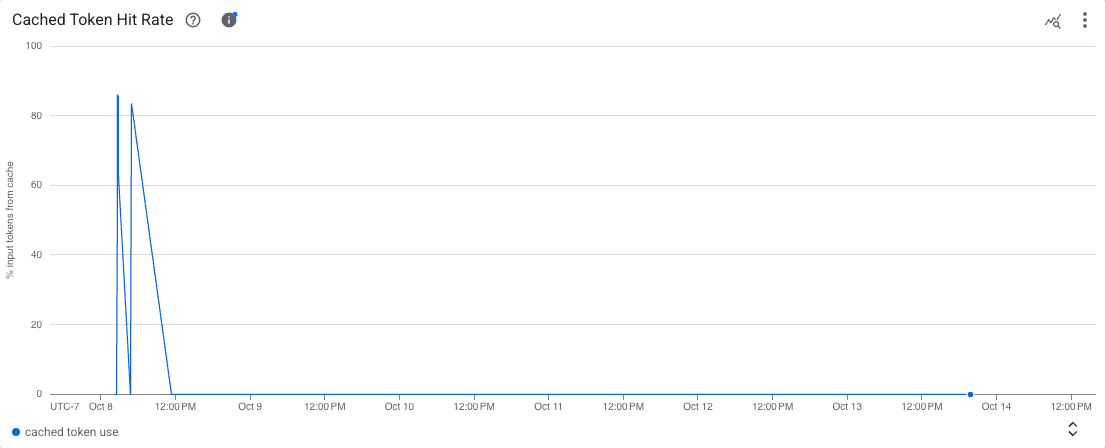 The Cached Token Hit Rate chart with detailed metrics selected, over seven days. It shows the percentage of input tokens served from cache, labeled cached token use.
### How to interpret monitoring dashboards
Provisioned Throughput
[checks available quota](https://docs.cloud.google.com/gemini-enterprise-agent-platform/models/provisioned-throughput/use-provisioned-throughput.md.txt#pt-quota-checking)
in real time at the millisecond level for requests as they are made, but
compares this data against a rolling
[quota enforcement period](https://docs.cloud.google.com/gemini-enterprise-agent-platform/models/provisioned-throughput/use-provisioned-throughput.md.txt#pt-quota-enforcement-period),
based on the Agent Platform
internal clock time. This comparison is independent of the time when the
requests are made. The monitoring dashboards report usage metrics after quota
reconciliation takes place. However, these metrics are aggregated to provide
averages for dashboard alignment periods, based on the selected time range.
The lowest possible granularity that the monitoring dashboards support is at
the minute level. To see second-level traffic, turn on
[detailed metrics](https://docs.cloud.google.com/gemini-enterprise-agent-platform/models/provisioned-throughput/use-provisioned-throughput.md.txt#detailed-metrics). Moreover, the clock time for the monitoring dashboards is
different from that of Agent Platform.
These differences in timings might occasionally result in discrepancies between
the data in the monitoring dashboards and real-time performance. These can
result from any of the following reasons:
- Quota is enforced in real time but the monitoring charts aggregate data into
1-minute or higher average dashboard alignment periods, depending on the time
range specified in the monitoring dashboards.
- Agent Platform and the monitoring dashboards run on different
system clocks.
- Over a period of one second, if a burst of traffic exceeds your
Provisioned Throughput quota based on the
[enforcement window](https://docs.cloud.google.com/gemini-enterprise-agent-platform/models/provisioned-throughput/use-provisioned-throughput.md.txt#pt-quota-enforcement-period),
the entire request is processed as spillover traffic. However, the overall
Provisioned Throughput utilization might appear low when the
monitoring data for that second is averaged within the 1-minute alignment
period, because the average utilization across the entire alignment period
might not exceed 100%. If you see spillover traffic, it confirms that your
Provisioned Throughput quota was fully utilized during the
quota enforcement period when those specific requests were made. This is
regardless of the average utilization shown on the monitoring dashboards.
#### Example of potential discrepancy in monitoring data
This example illustrates some of the discrepancies resulting from window
misalignment. Figure 1 represents throughput usage over a specific time period.
In this figure:
- The blue bars represent the traffic admitted as
Provisioned Throughput.
- The orange bar represents traffic that pushes the usage beyond the GSU limit
and is processed as spillover.
 **Figure 1.** Throughput usage over time periods
Based on the throughput usage, figure 2 represents possible visual
discrepancies, owing to windowing misalignment. In this figure:
- The blue line represents Provisioned Throughput traffic.
- The orange line represents spillover traffic.
 **Figure 2.** Possible visual discrepancies in monitoring dashboards
In this case, the monitoring data might show Provisioned Throughput
usage with no spillover for a monitoring aggregation timeframe, while
simultaneously observing Provisioned Throughput usage below the GSU
limit coinciding with a spillover in another monitoring aggregation timeframe.
#### Troubleshoot monitoring dashboards
You can troubleshoot unexpected spillover in your dashboards or 429 errors
by performing the following steps:
1. **Zoom In**: Set your dashboard time range to 12 hours or less to provide the
most granular alignment period of 1 minute. Large time ranges smooth out
spikes that cause throttling and increase the alignment period averages.
2. **Check Total Traffic**: Your model-specific dashboards show dedicated and
spillover traffic as two separate lines, which might lead to the incorrect
conclusion that Provisioned Throughput quota isn't fully utilized
and is spilling over prematurely. If your traffic exceeds available quota, the
entire request is processed as spillover. For another helpful visualization,
add a query to the dashboard using the Metrics Explorer and include
token throughput for the specific model and region. Don't include any
additional aggregations or filters to view the total traffic across all
traffic types (dedicated, spillover, and shared).
### Monitor Genmedia models
Provisioned Throughput monitoring isn't available on
Veo models.
### Alerting
After alerting is enabled, set default alerts to help you manage your traffic
usage.
#### Enable alerts
To enable alerts in the dashboard, do the following:
1. In the Google Cloud console, go to the **Provisioned Throughput**
page.
[Go to Provisioned Throughput](https://console.cloud.google.com/agent-platform/provisioned-throughput)
2. To view the Provisioned Throughput utilization of each model
across your orders, select the **Utilization summary** tab.
3. Select **Recommended alerts**, and the following alerts display:
- `Provisioned Throughput Usage Reached Limit`
- `Provisioned Throughput Utilization Exceeded 80%`
- `Provisioned Throughput Utilization Exceeded 90%`
4. Check the alerts that help you manage your traffic.
#### View more alert details
To view more information about alerts, do the following:
1. Go to the **Integrations** page.
[Go to Integrations](https://console.cloud.google.com/monitoring/integrations)
2. Enter *Agent Platform* into the **Filter** field and press **Enter** . **Google
Agent Platform** appears.
3. To view more information, click **View details** . The **Google
Agent Platform details** pane displays.
4. Select **Alerts** tab, and you can select an **Alert Policy** template.
## What's next
- Troubleshoot [Error code `429`](https://docs.cloud.google.com/gemini-enterprise-agent-platform/models/deploy/error-code-429.md.txt#troubleshoot-provisioned-through).