Gemini Enterprise Agent Platform Pipelines provides a set of predefined visualization types
for evaluating the result of a pipeline job (for example, `Metrics`,
`ClassificationMetrics`). However, there are many cases where custom
visualization is needed. Gemini Enterprise Agent Platform Pipelines provides two main
approaches to output custom visualization artifacts: Markdown and HTML files.
### Import required dependencies
In your development environment import the required dependencies.
```python
from kfp import dsl
from kfp.dsl import (
Output,
HTML,
Markdown
)
```
### Output HTML
To export an HTML file, define a component with the `Output[HTML]` artifact.
You also must write HTML content to the artifact's path. In this example you
use a string variable to represent HTML content.
> [!NOTE]
> **Note:** HTML and Markdown files are stored under the `pipeline_root` path in Cloud Storage. You must have sufficient permission to the Cloud Storage bucket to view visualization content.
```python
@dsl.component
def html_visualization(html_artifact: Output[HTML]):
public_url = 'https://user-images.githubusercontent.com/37026441/140434086-d9e1099b-82c7-4df8-ae25-83fda2929088.png'
html_content = \
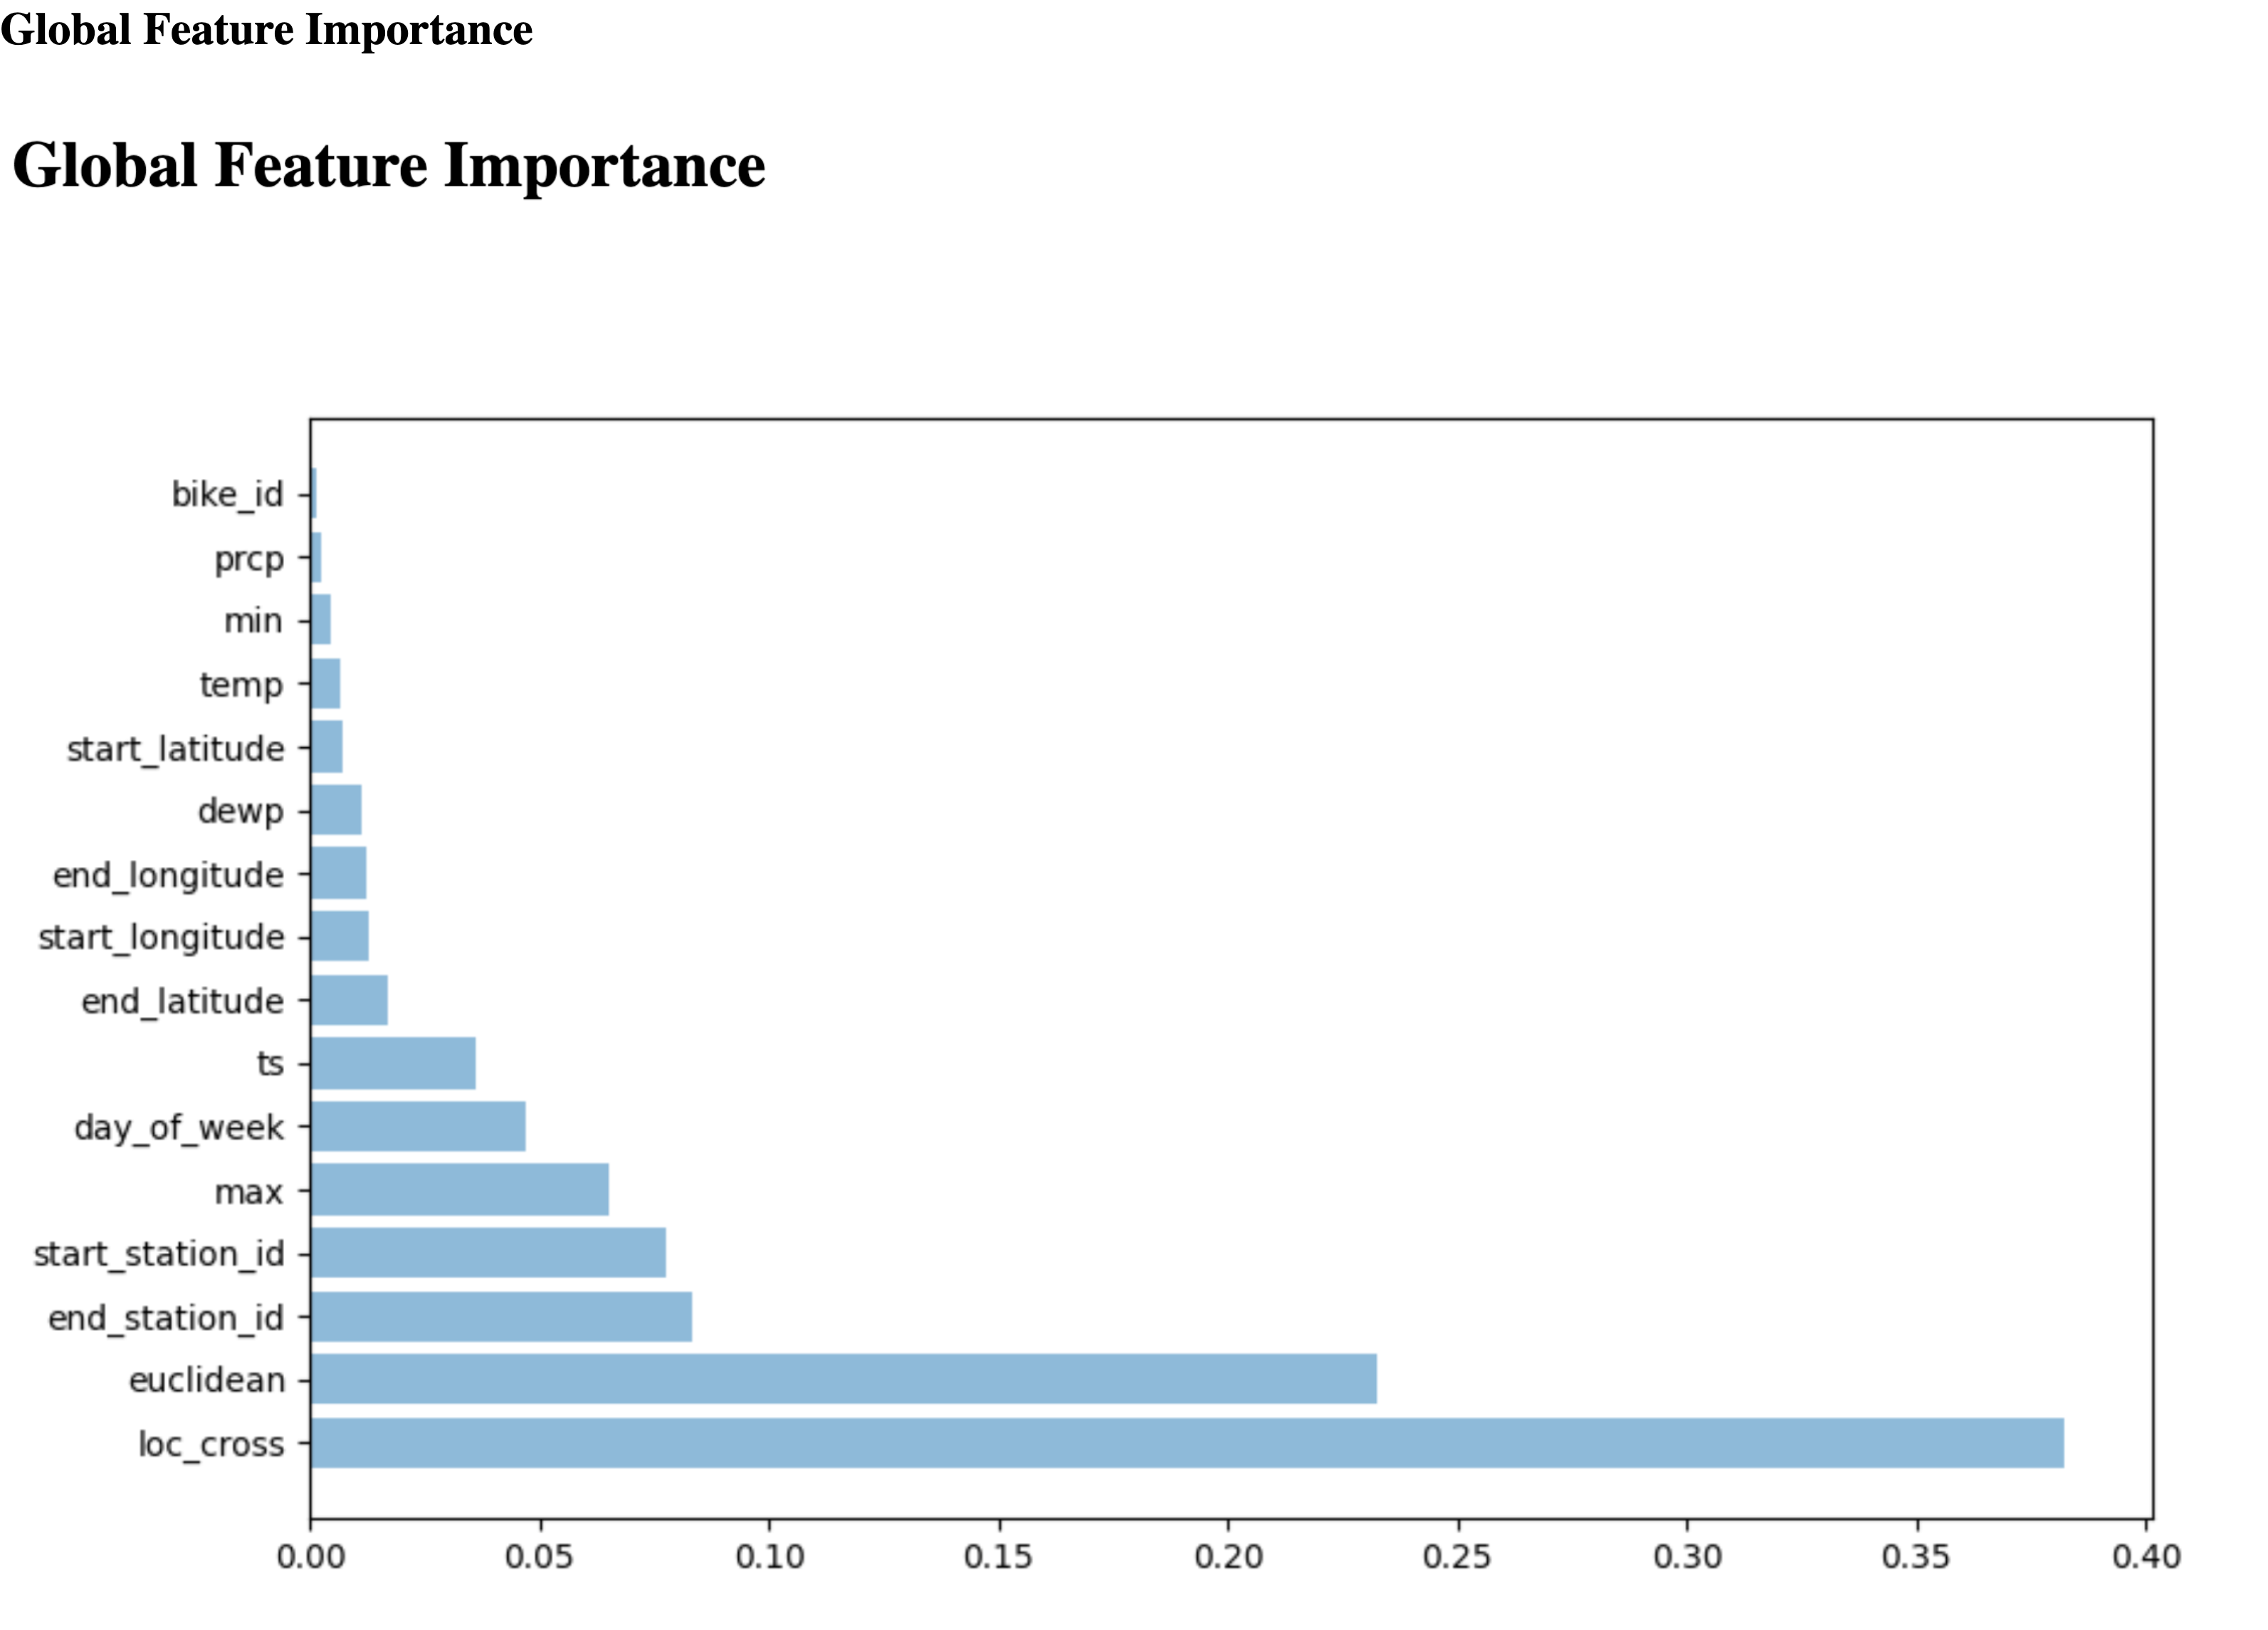
'Global Feature Importance
\n '.format(public_url)
with open(html_artifact.path, 'w') as f:
f.write(html_content)
```
**HTML artifact in the Google Cloud console:**
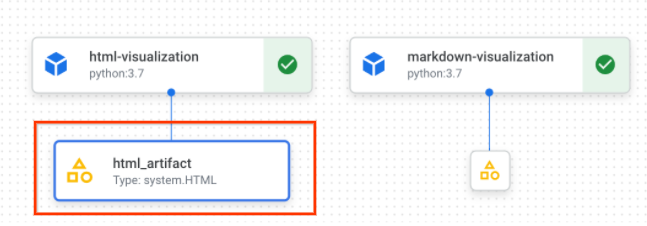
**HTML artifact information in the Google Cloud console:**
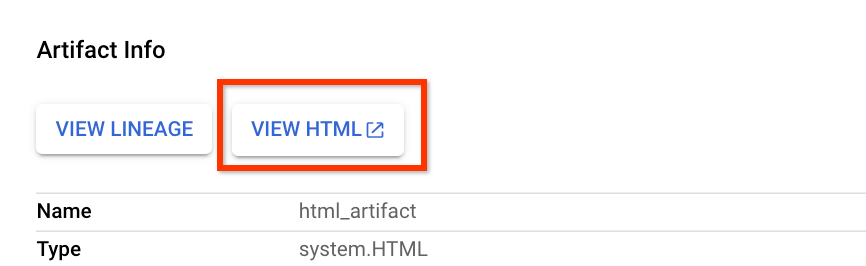
**Click "View HTML" to open HTML file on a new tab**
### Output Markdown
To export a Markdown file, define a component with the `Output[Markdown]`
artifact. You also must write Markdown content to the artifact's path. In this
example you use a string variable to represent Markdown content.
> [!NOTE]
> **Note:** HTML and Markdown files are stored under the `pipeline_root` path in Cloud Storage. You must have sufficient permission to the Cloud Storage bucket to view visualization content.
```python
@dsl.component
def markdown_visualization(markdown_artifact: Output[Markdown]):
import urllib.request
with urllib.request.urlopen('https://gist.githubusercontent.com/zijianjoy/a288d582e477f8021a1fcffcfd9a1803/raw/68519f72abb59152d92cf891b4719cd95c40e4b6/table_visualization.md') as table:
markdown_content = table.read().decode('utf-8')
with open(markdown_artifact.path, 'w') as f:
f.write(markdown_content)
```
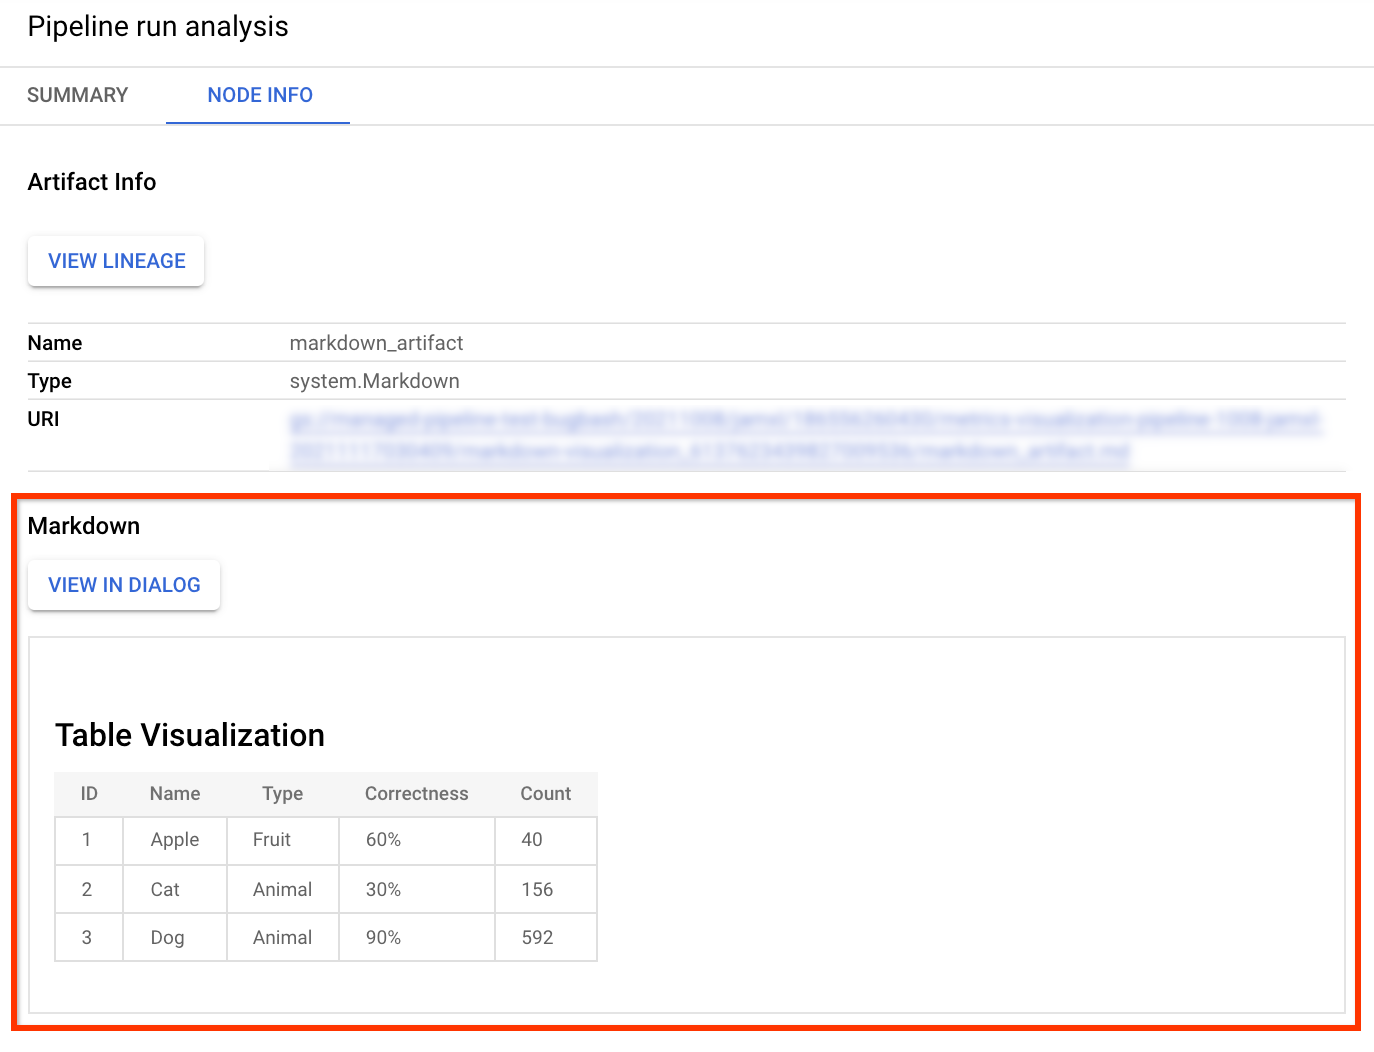
**Markdown artifact in the Google Cloud console:**
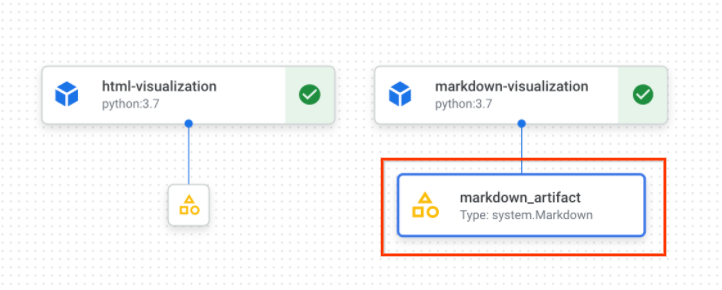
**Markdown artifact information in the Google Cloud console:**
### Create your pipeline
After you have defined your component with the HTML or Markdown artifact create
and run a pipeline that use the component.
```python
@dsl.pipeline(
name=f'metrics-visualization-pipeline')
def metrics_visualization_pipeline():
html_visualization_op = html_visualization()
markdown_visualization_op = markdown_visualization()
```
After submitting the pipeline run, you can view the graph for this run in
the Google Cloud console. This graph includes the HTML and Markdown artifacts
you declared in corresponding components. You can select these artifacts
to view detailed visualization.